QuestDB’s 2021 Series A deck is a highly technical, developer-centric presentation that successfully raised $15M. Rather than focusing on traditional revenue metrics, the deck leans heavily into open-source validation, performance benchmarks, and a high-pedigree investor network. By positioning time-series data as the fastest-growing database segment and showcasing a 500% growth in unique deployed instances within nine months, QuestDB built a compelling case for market dominance. The deck effectively uses social proof from enterprise giants like Airbus and Yahoo to balance its technical claim…
Key takeaways
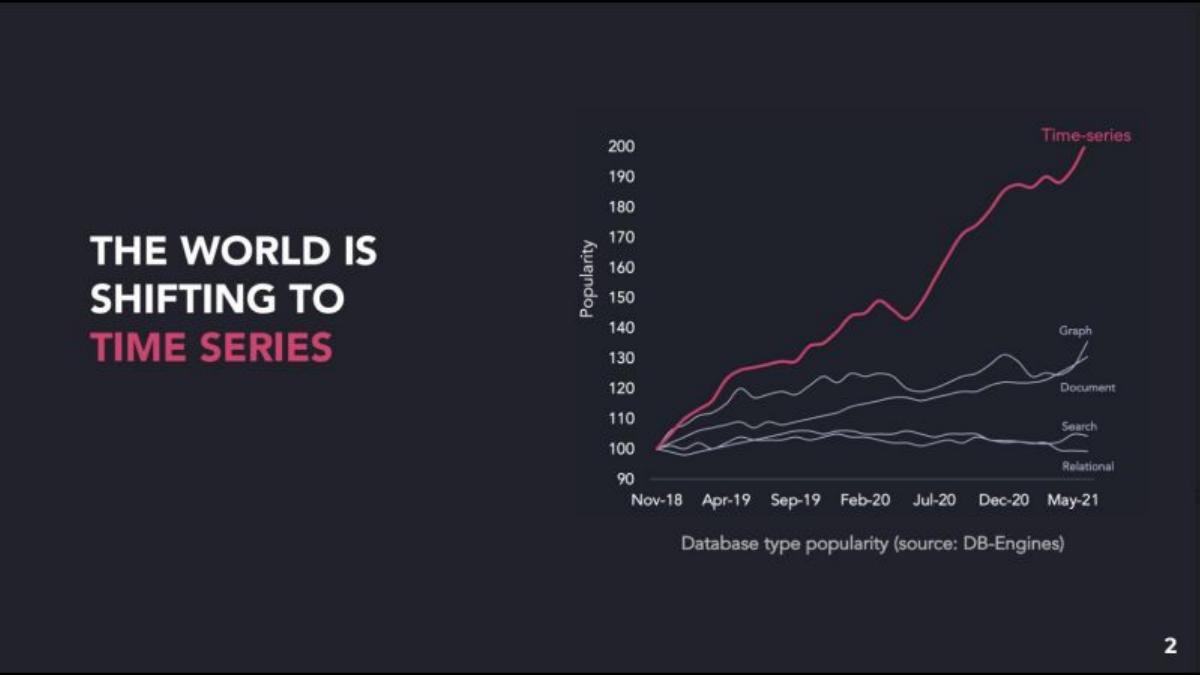
- Time-series databases are presented as the fastest-growing database category, significantly outperforming graph, document, and relational types (Slide 2).
- QuestDB claims a massive performance advantage, showing an ingestion rate of nearly 1,000,000 rows/sec for 10 million devices, while competitors drop below 100,000 (Slide 9).
- The company emphasizes its technical foundation, noting the database was written from scratch over 6 years with 300k lines of code (Slide 8).
- Community traction is a primary KPI, with GitHub stars growing from 1.2k in August 2020 to 4.7k by May 2021 (Slide 11).
- User adoption is highlighted as a core metric, showing a 500% increase in unique deployed instances between January and September 2021 (Slide 15).
- The deck explicitly asks for $12M to fuel developer adoption, though the catalogue listing confirms they ultimately raised $15M (Slide 17).
- A competitive matrix positions QuestDB as the only solution that is simultaneously fast, SQL-based, tiny in footprint, and open-source (Slide 16).
- The 'Open Source Leaders' slide serves as a powerful proxy for a traditional team slide, featuring founders from GitHub, Docker, and Reddit (Slide 19).
The QuestDB Series A Teardown
QuestDB’s 2021 Series A deck is a prime example of how to pitch a highly technical, open-source infrastructure product. In a space where performance is the primary currency, QuestDB doesn't lead with revenue; it leads with benchmarks and community velocity. The company successfully raised $15M (despite an initial ask of $12M shown in the deck) by convincing investors that they had built the fastest engine for the world’s fastest-growing data category.
Slides 1-3: Market Context and The Shift
Slide 1 is a minimalist title slide featuring the logo and the tagline: "Time for deeper insight." It sets a professional, dark-themed aesthetic that persists throughout the deck.
Slide 2 establishes the "Why Now?" by showing a chart from DB-Engines. It illustrates that Time-series databases are growing in popularity at a rate far exceeding Graph, Document, Search, and Relational databases. By indexing the popularity to 100 in Nov-18, the chart shows Time-series reaching a popularity score of 200 by May-21. This is a classic market-pull slide.
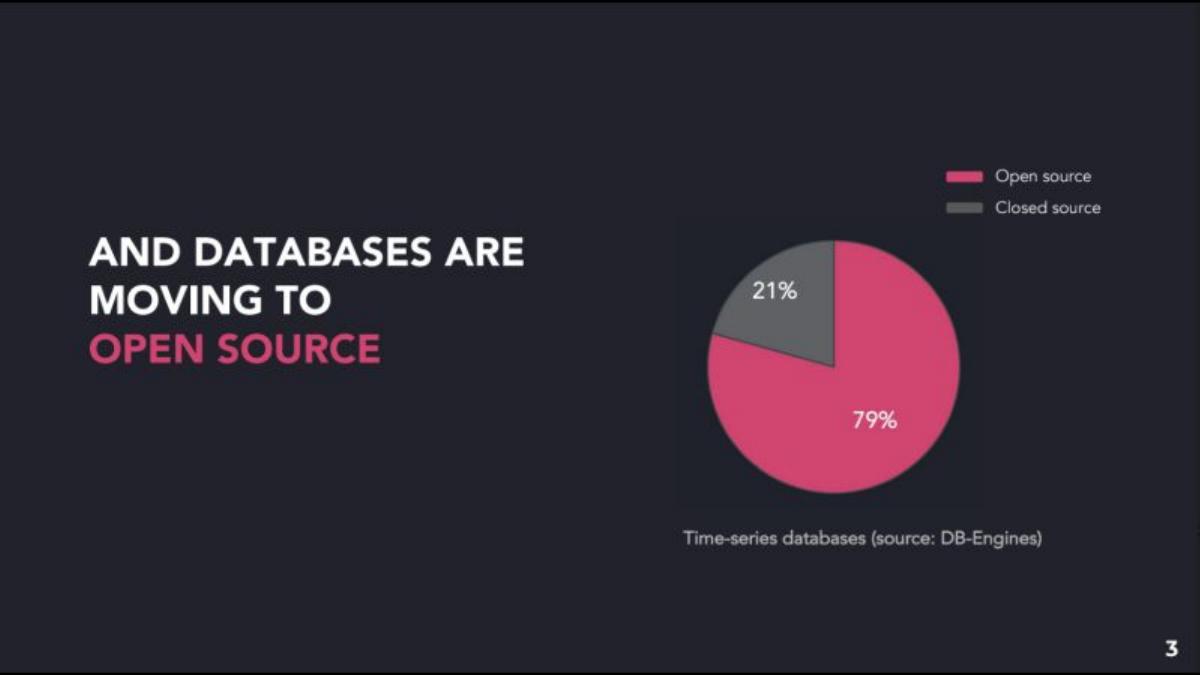
Slide 3 narrows the focus to Open Source. A pie chart shows that 79% of time-series databases are open source, compared to 21% closed source. This justifies QuestDB’s business model and community-first approach before they even describe the product.
Slides 4-7: The Problem and Use Cases
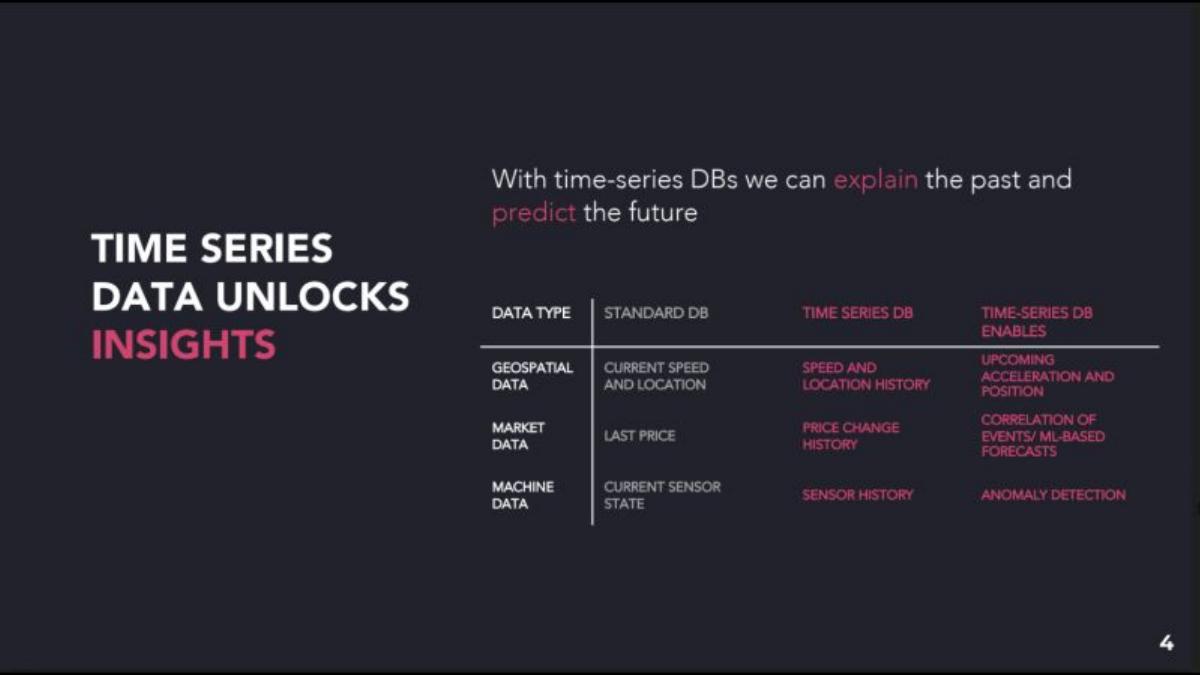
Slide 4 explains what time-series data actually does: it allows companies to "explain the past and predict the future." A table compares Standard DBs to Time Series DBs across Geospatial, Market, and Machine data. For example, in Market Data, a standard DB shows the "Last Price," while a Time Series DB shows "Price Change History" and enables "ML-based forecasts."
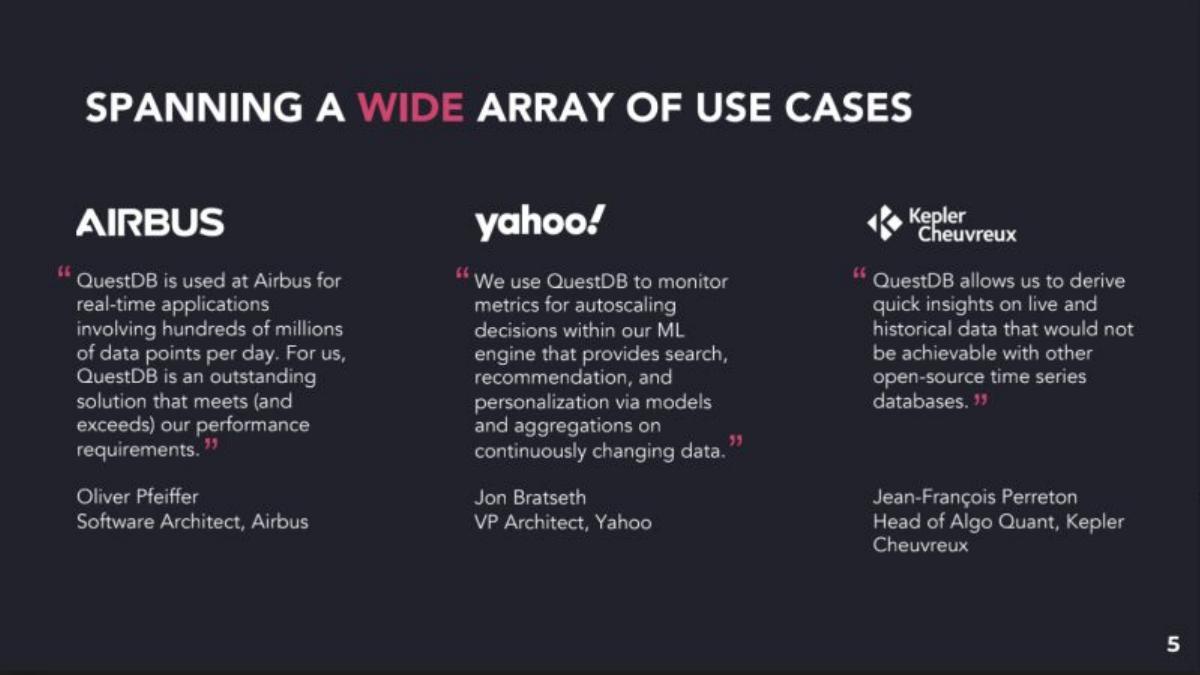
Slide 5 provides social proof via three major logos: Airbus, Yahoo, and Kepler Cheuvreux. The quotes are specific. Oliver Pfeiffer from Airbus notes that QuestDB handles "hundreds of millions of data points per day," while Jon Bratseth from Yahoo mentions using it for "autoscaling decisions within our ML engine."
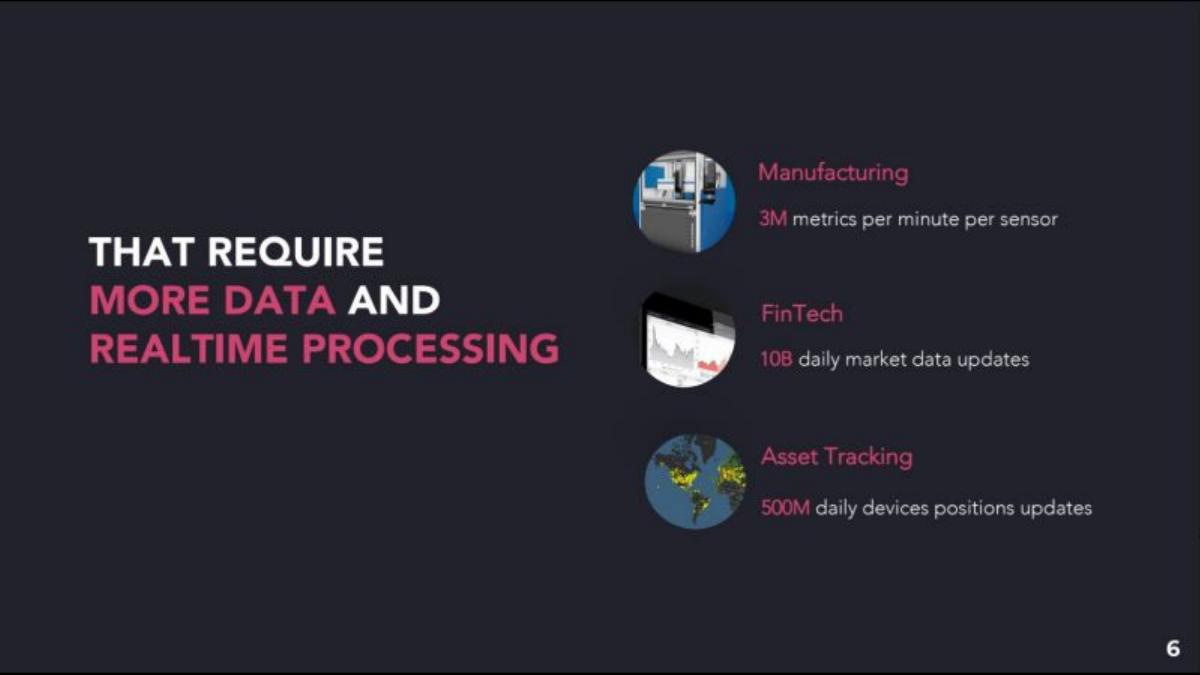
Slide 6 quantifies the scale of the problem. It lists Manufacturing (3M metrics/min/sensor), FinTech (10B daily updates), and Asset Tracking (500M daily updates). This slide defines the "High Scale" mentioned later in the deck.
Slide 7 identifies the pain points of incumbents: Low Ingestion Rate (leading to data loss), Slow Decisions (waiting for queries), and Spiraling Costs (slow databases require more servers). This sets the stage for QuestDB’s performance-based solution.
Slides 8-10: The Product and Performance
Slide 8 introduces the team’s expertise without naming individuals. It highlights a "Team from low-latency desks" at banks like HSBC, UBS, Morgan Stanley, and Merrill Lynch. Crucially, it states the database was "written from scratch" over 6 years with 300k lines of code, emphasizing that this isn't just a wrapper around existing technology.
Slide 9 is the "Killer Slide." It shows a bar chart of ingestion rates (Rows/sec). At 10 million devices, QuestDB maintains a massive lead (near 1,000,000 rows/sec) while InfluxDB and Timescale drop significantly. This visualizes the technical moat.
Slide 10 balances performance with "Simplicity." It mentions "Quick Deployment" (minimal setup, schema-less) and "Easy to Use" (SQL Console). A quote from a user, Petr Postulka, reinforces that QuestDB beats competitors on both performance and maintenance.
Slides 11-15: Traction and Community
Slide 11 is a dense timeline titled "We Move Fast." It tracks progress from Aug-19 to May-21. Key milestones include a $2.3M Seed round, YCombinator S20, and a #10 Launch on Hacker News. It also shows the growth of unique instances from 500 to 5.5k and GitHub stars from 150 to 4.7k.
Slide 12 highlights "The YC OSS Group," showing logos of other successful open-source companies like GitLab, Docker, and Nginx. This associates QuestDB with a high-performing peer group.
Slides 13, 14, and 15 are pure traction charts. Slide 13 shows GitHub stars climbing toward 5,000. Slide 14 shows community growth via Orbit. Slide 15 shows a 500% growth in unique deployed instances since January 2021. These slides prove that the product has found a following among developers.
Slides 16-19: Competition, The Ask, and Advisors
Slide 16 is a competitive matrix. QuestDB is compared to InfluxDB, Timescale, kx, and Amazon Timestream. QuestDB is the only one marked as "Fast" for ingestion, using "SQL," having a "Tiny" footprint, and using the "Apache 2.0" license. This is a very effective way to show how they occupy a unique quadrant in the market.
Slide 17 states the ask: "We're raising $12M to fuel developer adoption." It breaks down the focus areas into Developer Adoption KPIs, Product (Cloud solution, Enterprise features), and Lighthouse Customers.
Slide 18 provides a roadmap from "Now" through June 22. It covers Product (Serverless cloud, ML dimensions), Hiring (Sales, Dev Rel, Engineering), and GTM (Lighthouse relationships, Developer advocacy).
Slide 19 serves as the "Advisors" slide, titled "Open Source Leaders who are part of our journey." It features 14 high-profile individuals, including Tom Preston-Werner (GitHub), Sebastien Pahl (Docker), and Alexis Ohanian (Reddit). This slide provides immense credibility, acting as a surrogate for a detailed team slide.
What QuestDB Did Well
Performance as a Moat: By showing a benchmark where they outperform household names by 10x at scale, they make the investment seem like a bet on superior engineering. · Developer-First Metrics: For an open-source company, GitHub stars and "unique deployed instances" are more important than early revenue. QuestDB leaned into these metrics heavily. · Social Proof: The advisor slide (Slide 19) is one of the strongest in any deck. Having the founders of GitHub and Docker as advisors is a massive signal for a developer tool. · Clear Market Positioning: Slide 16 clearly explains why a developer would choose QuestDB over Amazon or InfluxDB.
What Was Missing
Founding Team Details: While the deck mentions the team's background in finance, it never actually names the founders or shows their faces. This is unusual for a Series A deck, which usually highlights the individuals leading the charge. · Business Model/Revenue: There is no mention of how the company currently makes money or plans to monetize the open-source community beyond a vague mention of "Enterprise features." · Unit Economics: There is no data on the cost of acquiring a developer or the lifetime value of an enterprise customer.
Founder Takeaways
If you are technical, show it: Don't be afraid of benchmarks if they are your primary advantage. QuestDB’s ingestion chart is the most memorable part of the deck. · Leverage your network: If you have high-profile advisors, give them their own slide. It builds trust when your product is complex. · Focus on the 'Why Now': The shift toward time-series data (Slide 2) makes the company's success feel inevitable rather than lucky. · Use 'Lighthouse Customers': Even if you don't have 100 customers, having three big names like Airbus and Yahoo is enough to prove enterprise viability.
Frequently asked questions
- What is the primary value proposition of QuestDB according to the deck?
- QuestDB positions itself as the fastest open-source time-series database. The deck emphasizes 'Performance combined with Simplicity,' highlighting its ability to handle massive data ingestion (10B daily market updates in FinTech) while remaining easy to use via a standard SQL console and a schema-less design.
- How does QuestDB demonstrate market demand?
- The deck uses a two-pronged approach: macro trends and micro traction. It cites DB-Engines data showing time-series databases as the fastest-growing sector and notes that 79% of these are open-source. On the micro level, it shows a 500% growth in deployed instances and a rapidly ascending GitHub star count.
- Which industries does QuestDB target?
- The deck identifies three primary high-scale use cases: Manufacturing (3M metrics per minute per sensor), FinTech (10B daily market updates), and Asset Tracking (500M daily device position updates). It also includes testimonials from Airbus and Yahoo to prove enterprise readiness.
- What is missing from this pitch deck?
- The deck notably lacks a traditional 'Team' slide that lists the founders' names, titles, and specific career histories. It also omits any mention of current revenue, pricing models, or unit economics, focusing entirely on developer adoption and technical performance as the indicators of value.
- How does QuestDB plan to use the Series A funds?
- According to slide 17, the $12M (later $15M) was earmarked for 'fueling developer adoption.' Specific goals included building a fully hosted Cloud solution, adding enterprise features, and expanding the engineering and customer success teams to support 'lighthouse customers' in FinTech and Data Science.