The ResultsOnAir deck is a striking example of 'less is more' in the pre-seed stage. Eschewing the traditional text-heavy format, the founders rely on bold analogies—specifically 'Mixpanel for TV' (Slide 1)—and massive typography to highlight a $40B market opportunity (Slide 2). The deck moves rapidly from problem (TV ads as a 'lottery') to a high-level product shot and then directly into aggressive traction metrics: 40% month-over-month growth and $200K ARR (Slides 5-6). While the deck lacks a formal 'Ask' slide or detailed competitive analysis, it succeeds in creating an narrative of moment…
Key takeaways
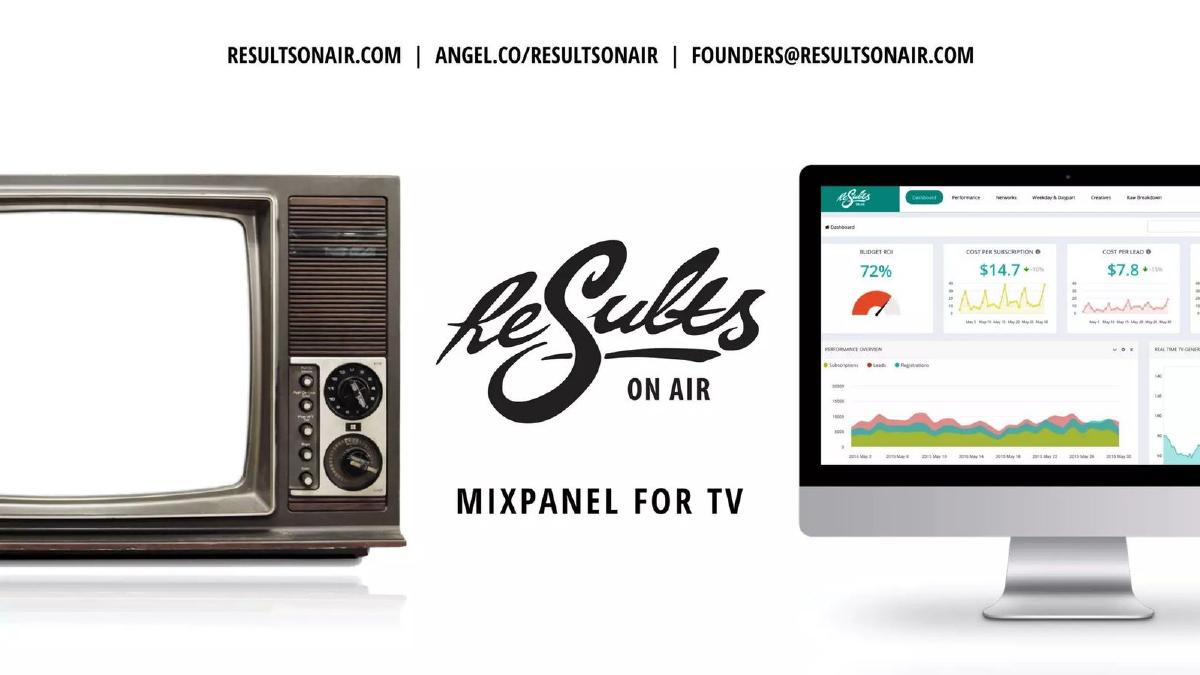
- The 'Mixpanel for TV' tagline on Slide 1 provides an immediate mental model for investors familiar with SaaS analytics.
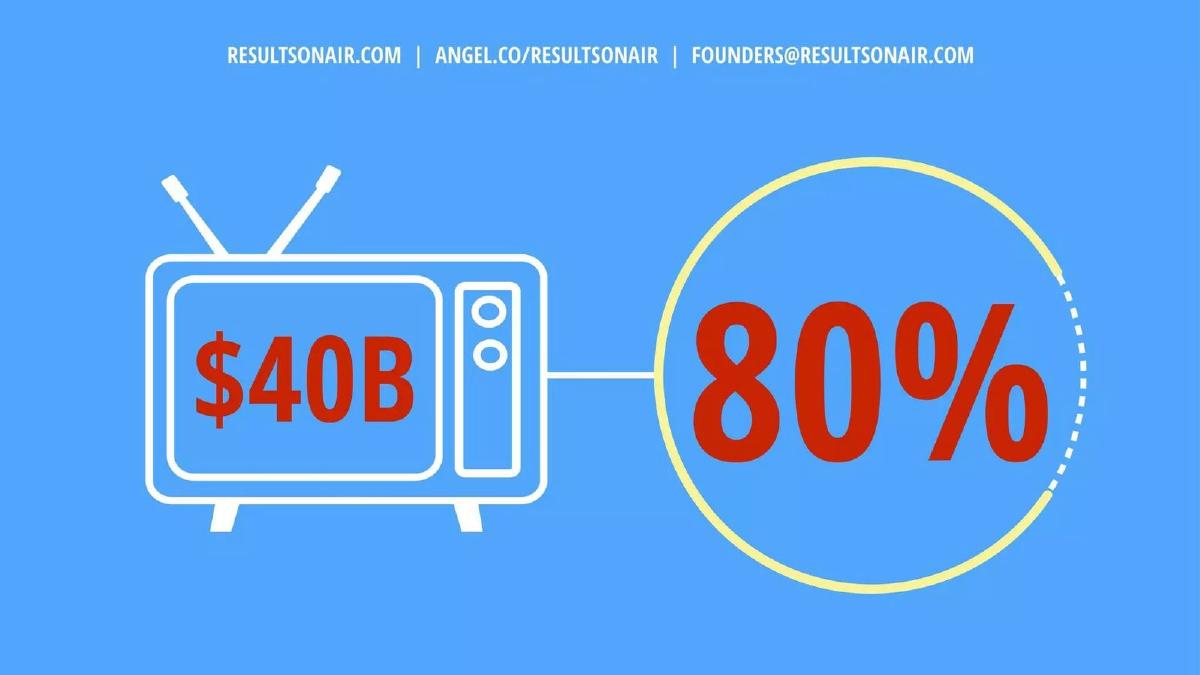
- Slide 2 uses a simple graphic to illustrate a $40B market where 80% of spend is potentially inefficient.
- The product is introduced on Slide 4 through a side-by-side comparison of a vintage TV and a modern analytics dashboard.
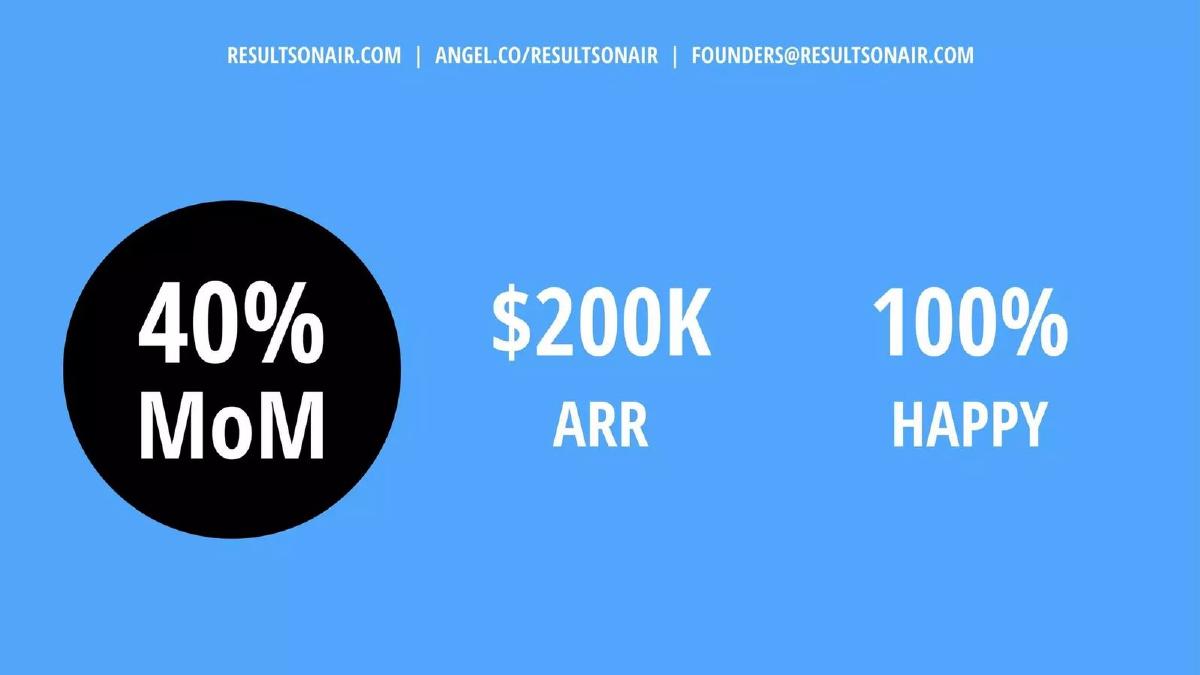
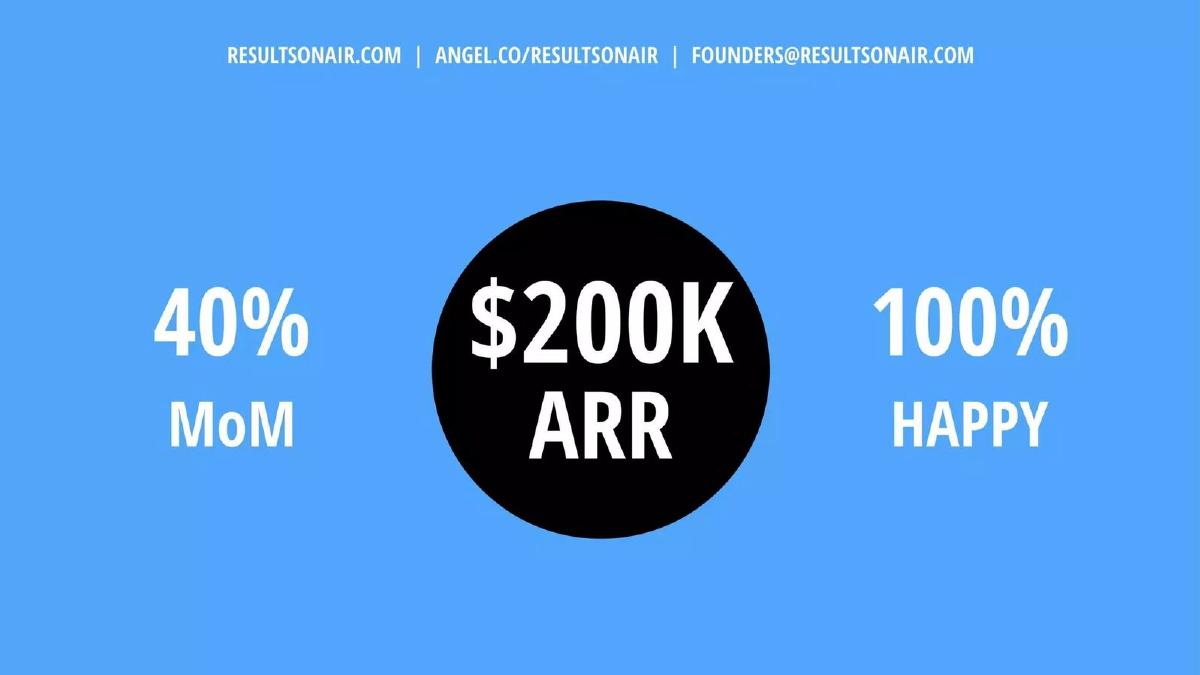
- Traction is highlighted through three consecutive slides (5, 6, and 7) that isolate 40% MoM growth, $200K ARR, and 100% customer satisfaction.
- A specific case study for 'Peachy.co.uk' on Slides 8 and 9 quantifies the value prop: +75% sales and -80% cost.
- The team slide (Slide 10) uses logos like Rocket Internet and FCB to establish credibility without needing long biographies.
- The deck completely omits a slide regarding the investment 'Ask' or the intended use of funds.
- There is no mention of the competitive landscape or the specific technology stack used to process the 'big data.'
The Power of the Analogy: ResultsOnAir Teardown
The ResultsOnAir pitch deck from 2014 is a masterclass in minimalist design. In an era where founders often feel compelled to pack every slide with charts and bullet points, this 10-slide deck takes the opposite approach. It relies on a single, powerful analogy and high-contrast visuals to move an investor through the narrative. By the time you reach the end, you know exactly what they do, who they do it for, and how fast they are growing, despite the deck containing almost no body text.
Slides 1-3: The Hook and the Problem
Slide 1: Title Slide The deck opens with the company logo and a bold sub-headline: "- MIXPANEL FOR TV -". This is a classic 'X for Y' positioning statement. In 2014, Mixpanel was the gold standard for event-based analytics in the web and mobile world. By claiming this title for TV, ResultsOnAir immediately tells the investor that they provide granular, actionable data for a medium that is traditionally opaque.
Slide 2: The Market Opportunity Instead of a complex TAM/SAM/SOM slide, the founders use two massive numbers: "$40B" inside a TV icon and "80%" in a circle. The implication is clear: $40 billion is spent on TV advertising, and a staggering 80% of it is unmeasured or wasted. It frames the market size and the inefficiency in a single glance.
Slide 3: The Problem Statement The problem is summarized in four words: "BUYING TV ADS = LOTTERY". The background image of lottery balls reinforces the idea that current TV advertising is a gamble. This sets the stage for a solution that introduces predictability and data.
Slides 4-7: The Solution and Traction
Slide 4: The Product The solution slide features a vintage television set on the left and a modern iMac displaying the ResultsOnAir dashboard on the right. The dashboard shows metrics like "Budget ROI (72%)", "Cost per Subscription ($14.7)", and "Cost per Lead ($7.8)". This visual contrast emphasizes the transition from 'old world' broadcasting to 'new world' digital-style analytics.
Slide 5: Traction - Growth The deck enters a three-slide 'Traction' sequence. Slide 5 features a large black circle with "40% MoM" (Month-over-Month) growth. By isolating this metric, the founders ensure the investor cannot miss the speed at which the company is scaling.
Slide 6: Traction - Revenue Continuing the theme, Slide 6 highlights "$200K ARR". For a pre-seed or early seed stage company in 2014, $200,000 in annual recurring revenue was a significant milestone, proving that customers were already willing to pay for the 'Mixpanel for TV' promise.
Slide 7: Traction - Retention The final traction slide shows "100% HAPPY". While 'happy' is a subjective metric, the 100% figure likely refers to a zero-churn rate among their initial pilot customers. It rounds out the growth and revenue story with a suggestion of product-market fit.
Slides 8-10: Proof and People
Slide 8: Case Study Part 1 The deck provides concrete proof using a client, Peachy.co.uk. The slide shows "+75% SALES" and "-80% COST". This is the ultimate 'so what?' of the platform. It demonstrates that the analytics aren't just for show; they lead to massive improvements in the client's bottom line.
Slide 9: Case Study Part 2 Slide 9 doubles down on the Peachy.co.uk success with a giant "10x RETURNS" graphic. This is the 'greed' slide, showing investors the kind of ROI the software can unlock for its users, which in turn justifies a high price point and rapid adoption.
Slide 10: The Team The final slide introduces the founders: Cristo (CEO), Kristel (CMO), and Kristo (CTO). They use a casual, friendly photo from an event (tagged #ESTONIANMAFIA, a nod to the Estonian startup scene). Below the names are three powerful logos: Rocket Internet, Southwestern, and FCB. This tells the investor that the team has experience in aggressive business building (Rocket), direct sales (Southwestern), and traditional advertising (FCB).
What Works in This Deck
The 'X for Y' Analogy: Using Mixpanel as a reference point is brilliant. It bypasses the need for a long technical explanation of event-based tracking and attribution. Investors immediately understand the product's function.
Extreme Focus: The deck doesn't wander. It follows a tight logic: The market is huge but wasteful (Slide 2), it's currently a gamble (Slide 3), we have the dashboard to fix it (Slide 4), and it's already working (Slides 5-9).
Visual Hierarchy: The use of large, bold fonts for the most important numbers (40%, $200K, 10x) ensures that even a 30-second skim of the deck leaves the investor with the key takeaways.
What Is Missing
The Ask: This is the most glaring omission. There is no slide indicating how much money the company is looking to raise, the valuation they are seeking, or what they plan to do with the capital. This information might have been reserved for the verbal pitch, but its absence in the deck is notable.
The 'How': While the deck shows the results of the data, it doesn't explain how they get the data. In 2014, TV attribution was a difficult technical challenge involving audio fingerprinting or real-time traffic correlation. A 'How it Works' slide would have helped de-risk the technical side of the investment.
Competition: The deck operates as if ResultsOnAir is in a vacuum. There is no mention of other TV attribution players or how they differ from traditional media buying agencies that claim to offer similar reporting.
What a Founder Should Copy
The Traction Sequence: Grouping your growth, revenue, and retention into three high-impact, single-metric slides (Slides 5, 6, 7) is a powerful way to build momentum. It prevents the data from getting lost in a crowded table.
Logo-Based Credibility: If you have worked at recognizable companies, don't write a paragraph about it. Use the logos on your team slide (Slide 10). It is faster to process and carries more weight visually.
The Case Study Slide: Instead of just saying "our customers love us," show the specific impact on their business (Slide 8). Use the customer's actual logo and the specific percentage improvements you generated for them. This turns a vague claim into a hard fact.
Frequently asked questions
- What is the primary value proposition of ResultsOnAir?
- Based on the deck, ResultsOnAir provides real-time analytics for TV advertising. By positioning themselves as 'Mixpanel for TV' (Slide 1), they promise to transform TV ad buying from a 'lottery' (Slide 3) into a data-driven process that can increase sales by 75% while reducing costs by 80% (Slide 8).
- How much revenue was the company generating at the time of this deck?
- Slide 6 explicitly states that the company had reached $200K in Annual Recurring Revenue (ARR). This is paired with a 40% month-over-month growth rate shown on Slide 5, indicating a strong early-stage growth trajectory.
- Who are the founders and what is their background?
- Slide 10 introduces the three founders: Cristo (CEO), Kristel (CMO), and Kristo (CTO). Their backgrounds are represented by logos rather than text, showing experience at Rocket Internet, Southwestern, and FCB, suggesting a mix of aggressive scaling and advertising industry experience.
- Is there a specific target market mentioned in the deck?
- While the deck mentions a general $40B TV ad market (Slide 2), the case study on Slides 8 and 9 focuses on Peachy.co.uk, a short-term loan provider. This suggests the platform is particularly effective for direct-response advertisers who need to track immediate ROI from their broadcasts.
- What is missing from this pitch deck that an investor might ask for?
- The deck is very lean. It lacks a 'The Ask' slide (how much they are raising), a 'Use of Funds' slide, a 'Competition' slide, and any technical detail on how they actually attribute web traffic or sales to specific TV ad spots.