Revi’s pitch deck is a masterclass in shifting the narrative from 'utility software' to 'revenue generator.' By positioning itself as an 'Autopilot Revenue Engine' rather than just another Point of Sale (POS) system, Revi justifies its presence in a mature market. The deck relies heavily on specific performance metrics, such as a 40% increase in average order volume and a 58% upsell acceptance rate. While the visual design is simple, the data is dense, focusing on sales efficiency—claiming a 3-day sales cycle compared to the industry average of 12-15 days. The deck successfully argues that re…
Key takeaways
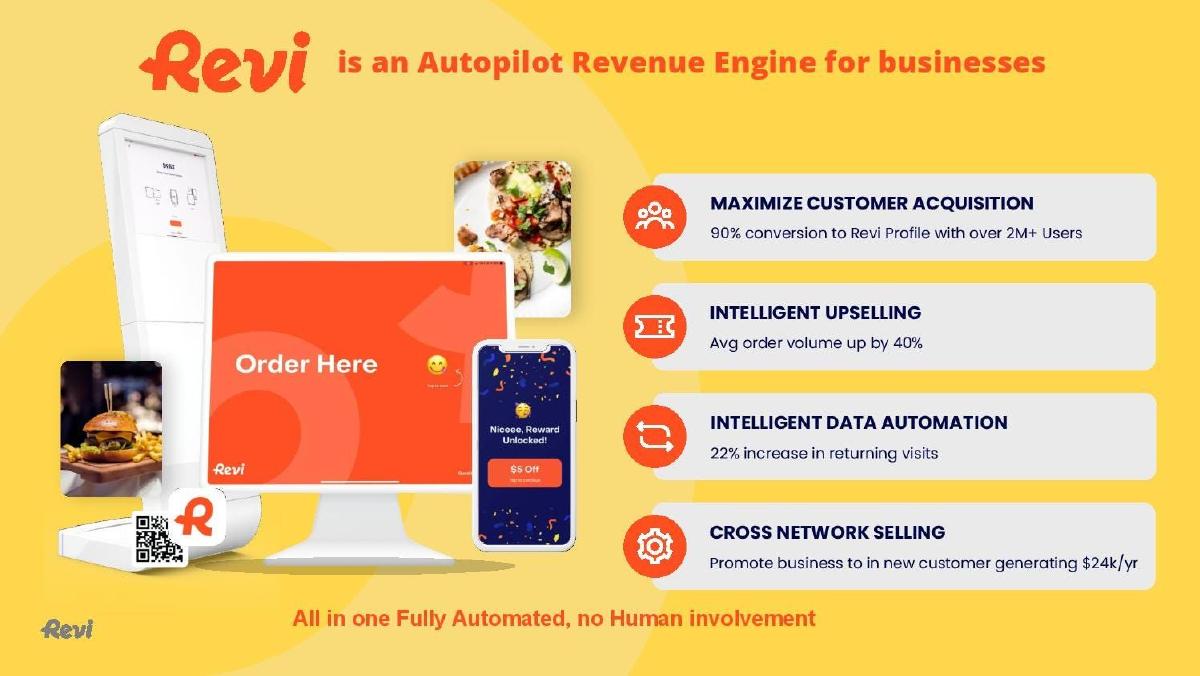
- Revi positions itself as an 'Autopilot Revenue Engine' to differentiate from traditional POS systems (Slide 2).
- The platform claims to drive a 40% lift in revenue through intelligent upselling and data automation (Slide 3).
- A 58% upsell acceptance rate is cited as a primary driver of increased order volume (Slide 3).
- Revi highlights a highly efficient sales process with a 3-day sales cycle and a 50% lead-to-demo conversion rate (Slide 5).
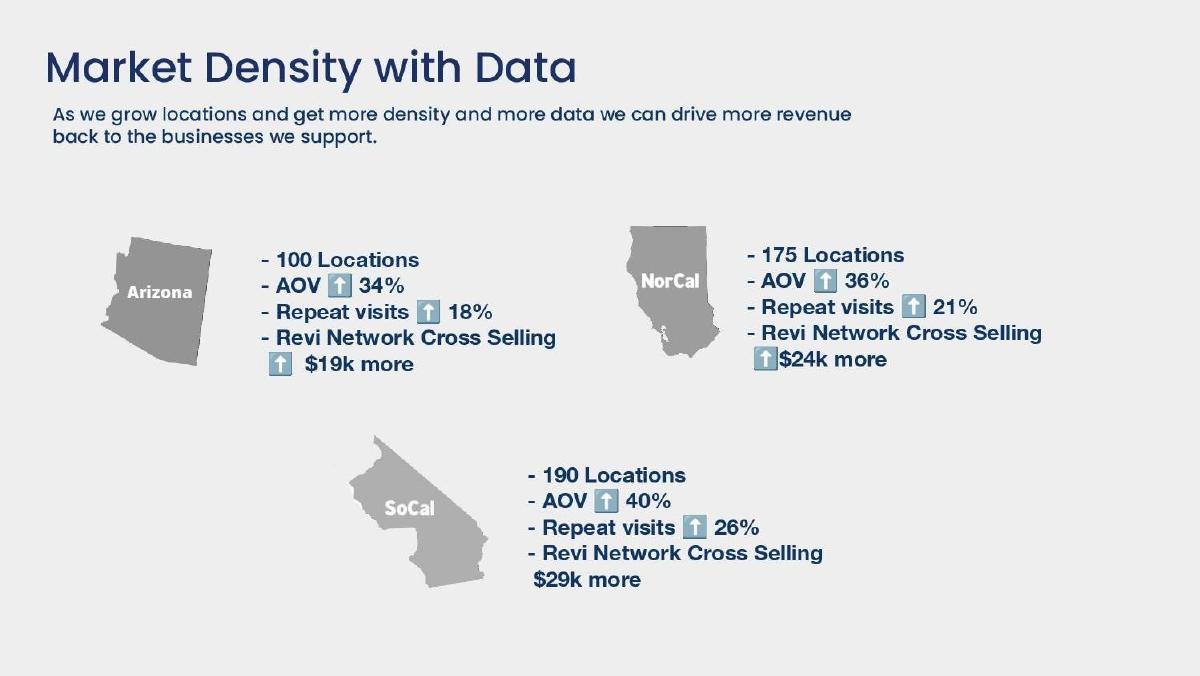
- The deck demonstrates geographic proof of concept, showing that SoCal locations generate $29k in cross-selling revenue compared to $19k in Arizona (Slide 13).
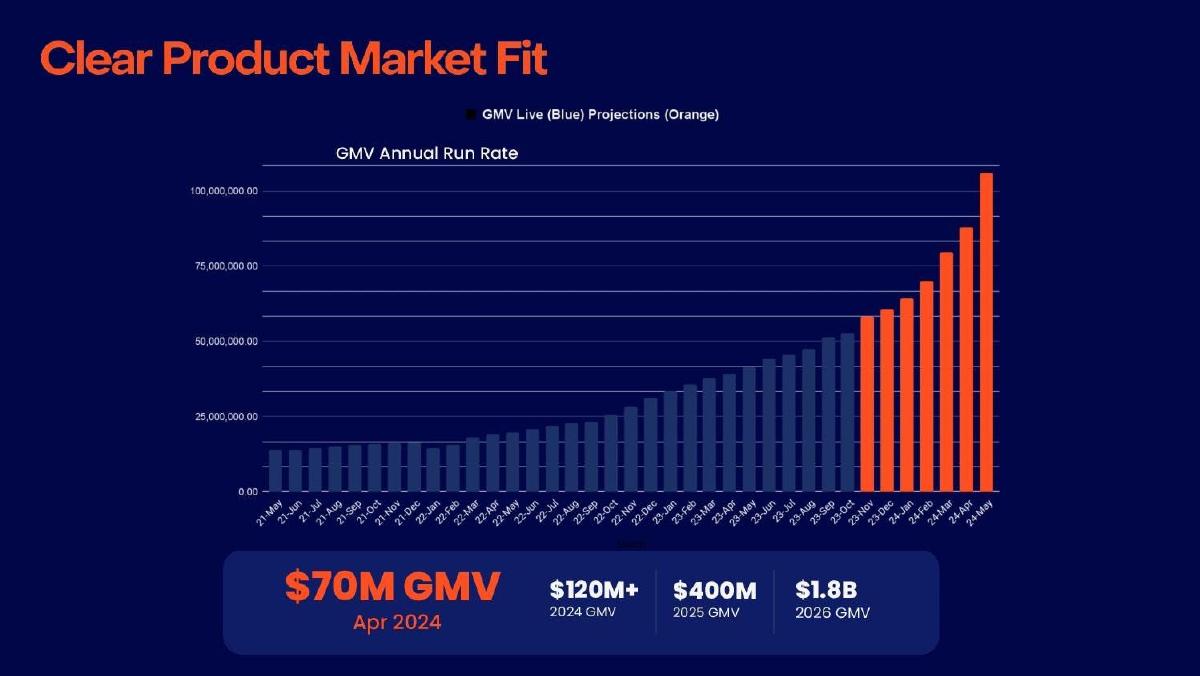
- GMV projections show an aggressive scale from $70M in April 2024 to a projected $1.8B by 2026 (Slide 15).
- The 'Ask' slide explicitly requests $10M to reach $20M in ARR, though publisher facts indicate $14.5M was ultimately raised (Slide 16).
- The deck lacks a traditional dedicated team slide, though the CEO and one other executive are pictured on sales and title slides (Slides 1, 5).
The Revi Pitch Deck: Selling Revenue, Not Software
Revi’s Series A deck is a focused, data-heavy presentation that avoids the common pitfall of over-explaining features. Instead, it leans into a single, compelling narrative: that restaurants are leaving money on the table, and Revi is the automated engine that recovers it. With a reported $14.5M raised in 2024, the company successfully navigated a highly competitive and saturated restaurant tech market by focusing on bottom-line impact rather than operational utility.
Slide 1: Title and Identity
The deck opens with a minimalist title slide featuring the Revi logo and the tagline "Revenue on Autopilot." CEO Eugene Johnson’s contact information is clearly displayed. The imagery—lifestyle shots of people eating and drinking—immediately grounds the technology in the physical world of hospitality. It establishes the brand's aesthetic: bright, approachable, and consumer-focused.
Slide 2: The Autopilot Revenue Engine
Slide 2 defines the product. It lists four key pillars: Maximize Customer Acquisition, Intelligent Upselling, Intelligent Data Automation, and Cross Network Selling. Crucially, it includes high-level proof points for each: a 90% conversion to Revi profiles, a 40% increase in average order volume (AOV), a 22% increase in returning visits, and $24k/year generated via cross-network selling. The footer emphasizes "no Human involvement," a key selling point for labor-strapped restaurants.
Slide 3: The 40% Revenue Lift
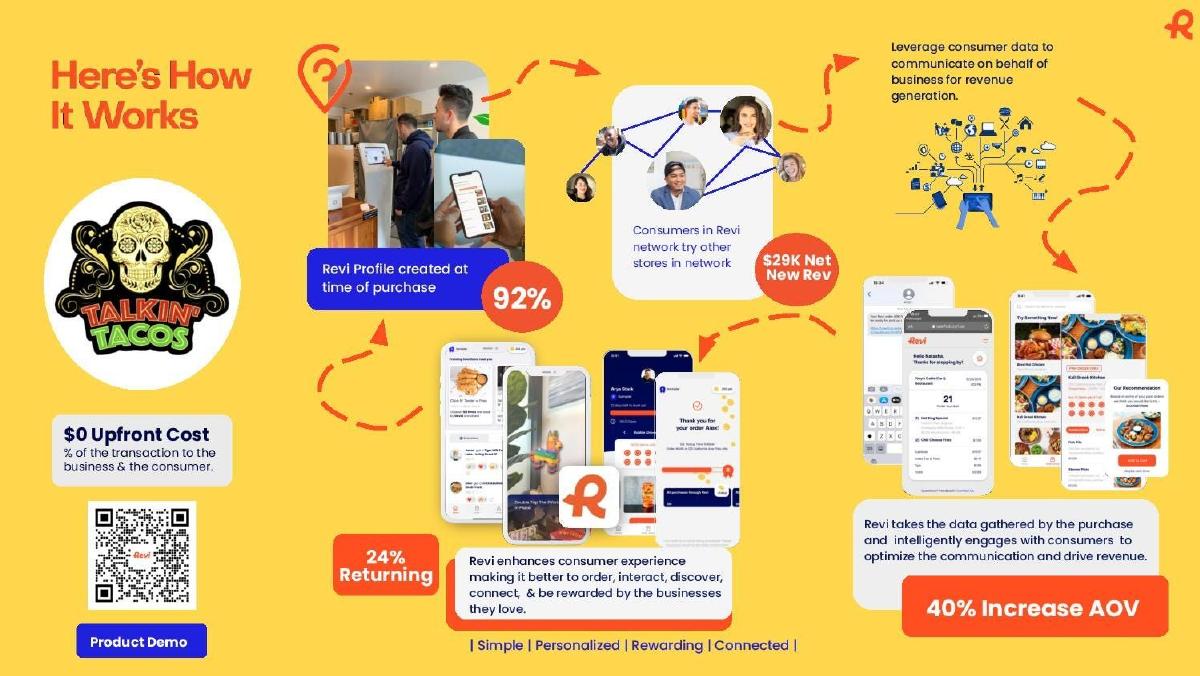
This slide addresses the "How." It contrasts the "Mature POS Market," which Revi claims offers only a 1%-4% revenue increase from switching brands, against Revi’s "10X Revenue Value." The visual uses a steep upward arrow to represent the 40% lift. The "3 Keys to Revenue uplift" are detailed on the right: 58% of users accept intelligent upsells, repeat visits increase by 22%, and the Revi Network generates $24k in net new customer revenue. This is a direct attack on legacy POS systems like Toast or Square, framing them as mere operational tools while Revi is a growth tool.
Slide 4: More Than a POS
Slide 4 positions Revi as a consolidator. It shows a vertical purchase journey—Marketing, Discovery, Delivery, Purchase, Rewards, and Experience—and lists competitors in each category (e.g., Instagram, Yelp, DoorDash, Square, Fivestars, Snackpass). Revi’s claim is that they consolidate and digitize this entire journey to enhance consumer experience, drive revenue, and cut costs. This slide is vital for explaining where Revi sits in a crowded ecosystem.
Slide 5: Superior Sales Velocity
This is one of the most unique slides in the deck. It focuses entirely on sales efficiency. Revi compares its metrics ("Us") against an unnamed "Them." The claims are aggressive: a 3-day sales cycle vs. 12-15 days, a 50% lead-to-demo rate vs. 30%, and a 50%+ demo-to-close rate vs. 27%. It also notes that Revi can deploy in 30 days compared to the industry standard of 60-90 days. This slide tells investors that Revi isn't just a good product; it's a product that is easy and cheap to sell.
Slide 12: Geographic Coverage
Slide 12 (numbered as such in the footer) outlines the company's expansion phases. Phase 1 (Bay Area to LA) and Phase 2 (Miami, Vegas, Arizona) are marked as "DONE." Phase 3, targeting major hubs like Austin, Boston, New York, and Seattle, is slated for 2023. This provides a clear historical context for the deck and shows a methodical approach to scaling.
Slide 13: Market Density and Data
This slide proves the network effect. Revi shows data from three regions: Arizona, NorCal, and SoCal. As the number of locations increases (from 100 in AZ to 190 in SoCal), the performance metrics improve. SoCal shows a 40% AOV increase and $29k in cross-selling revenue, compared to 34% and $19k in Arizona. This data validates the strategy of geographic clustering.
Slide 15: Product Market Fit and GMV Projections
The traction slide shows a bar chart of GMV (Gross Merchandise Volume) Annual Run Rate. It highlights a $70M GMV as of April 2024. The projections are bold: $120M+ for 2024, $400M for 2025, and $1.8B for 2026. The transition from blue bars (live) to orange bars (projections) clearly demarcates what has been achieved versus what is expected.
Slide 16: The $10M Ask
The final substantive slide outlines the funding request. Revi is "Raising $10M in order to reach $250M in GMV and $20M in ARR." The funds are allocated toward three goals: Grow Revenue (hiring sales and marketing), Move Upmarket (multi-location support), and Build Consumer Relationships. The slide includes a breakdown of effort: 30% for intimate engagement, 40% to grow revenue, 20% to build relationships, and 10% to move upmarket. Interestingly, while the slide asks for $10M, publisher reports indicate the company raised $14.5M, suggesting strong investor interest during the round.
What Revi Does Exceptionally Well
The Revi deck is highly effective because it focuses on outcomes rather than features . In the restaurant tech space, founders often get bogged down in explaining how their kitchen display system works or how their QR codes are generated. Revi ignores the 'how' for the first several slides and focuses entirely on the 'how much.' By leading with a 40% revenue lift, they immediately capture the attention of any investor looking for a high-growth SaaS play.
Furthermore, the sales efficiency slide (Slide 5) is a brilliant inclusion. For a Series A company, investors are looking for a repeatable sales motion. By showing that their sales cycle is 4x faster than the industry average, Revi demonstrates that they have cracked the code on customer acquisition in a notoriously difficult-to-sell market (SMB restaurants).
What is Missing from the Revi Deck
The most glaring omission is a comprehensive team slide . While CEO Eugene Johnson is featured, there is no information about the CTO, the engineering team, or the background of the founders. In a $10M+ round, investors typically want to see a deep bench of talent, especially in a product that claims to use "Intelligent Data Automation."
Additionally, the deck lacks a detailed unit economics slide . While they mention the "Annual Cost per Cohort" is $300k to generate $2M in ARR (Slide 5), they don't explicitly break down Customer Acquisition Cost (CAC) or Lifetime Value (LTV). Given the high churn rates in the restaurant industry, a slide dedicated to retention and net dollar retention (NDR) would have strengthened the case for the $1.8B GMV projection.
Founder Takeaways: Copy These Moves
Quantify the 'Switching Value': Don't just say your product is better; quantify the delta between you and the status quo. Revi’s comparison of a 1-4% lift (competitors) vs. a 40% lift (Revi) is a powerful framing device. · Prove the Network Effect: If your business benefits from density, show it. Slide 13 is a perfect example of using regional data to prove that the product becomes more valuable as it scales. · Sell the Sales Motion: If you have a highly efficient sales process, make it a slide. Investors love a company that can acquire customers faster and cheaper than the competition. · Focus on GMV as a Leading Indicator: For platforms that facilitate transactions, GMV is often a more exciting metric than pure SaaS revenue in the early stages. Revi uses GMV to show the sheer scale of economic activity flowing through their system.
Frequently asked questions
- What is Revi's primary value proposition?
- Revi positions itself as an 'Autopilot Revenue Engine.' Unlike standard POS systems that focus on operational excellence, Revi focuses on '10X Revenue Value' by automating customer acquisition, upselling, and retention. It claims to provide a 40% lift in revenue for businesses by using data to drive repeat visits and higher order values without human involvement.
- How does Revi compare its sales efficiency to competitors?
- On Slide 5, Revi claims a significantly faster and more effective sales motion. They report a 3-day sales cycle versus the industry's 12-15 days, a 50% lead-to-demo rate versus 30%, and a 50%+ demo-to-close rate versus 27%. They also claim to deploy in 30 days, whereas competitors take 60-90 days.
- What role does geographic density play in Revi's strategy?
- Slide 13 shows that as Revi gains density in a specific market, the value per location increases. In Southern California, where they have 190 locations, they see a 40% AOV increase and $29k in cross-selling revenue. In Arizona, with only 100 locations, those figures are lower (34% AOV and $19k cross-selling), proving their network effect.
- What are Revi's financial projections for the next few years?
- According to Slide 15, Revi reached a $70M GMV run rate in April 2024. They projected finishing 2024 at $120M+ GMV, growing to $400M in 2025, and hitting $1.8B in 2026. The funding ask on Slide 16 is specifically tied to reaching a milestone of $20M in ARR.
- Is there a team slide in the Revi deck?
- No, the deck omits a standard team slide featuring bios or logos of previous companies. CEO Eugene Johnson is featured on the title slide, and he appears alongside another team member on Slide 5 (Superior Sales), but the deck does not provide a comprehensive overview of the founding team's background or technical leadership.