SoFi’s 2021 investor presentation for its merger with Social Capital Hedosophia Holdings Corp. V (IPOE) is a comprehensive 90-slide document (23 of which are analyzed here) that pivots the company from a niche lender to a diversified fintech powerhouse. The deck centers on the 'Financial Services Productivity Loop', a strategy designed to lower customer acquisition costs (CAC) through high-frequency products like 'Money' and 'Invest', then monetize via high-LTV lending products. With a post-transaction equity value of $8.7 billion, the deck relies heavily on the acquisition of Galileo to prov…
Key takeaways
- The company targets 'HENWS' (High Earners Not Well Served), specifically those aged 22+ earning over $100,000 (Slide 28).
- Cross-buying a loan increases total variable profit per member by $825, a 180% increase compared to single-product users (Slide 20).
- The 'Financial Services Productivity Loop' aims to reach 4 million total products by the end of 2021 (Slide 24).
- SoFi's acquisition of Galileo is positioned as turning a cost center into a profit center, growing from 17 million accounts in Q1 2019 to 50 million in Q3 2020 (Slide 39).
- The deck identifies a $2 trillion opportunity by taking market share from incumbents like JPMorgan Chase ($363B market cap) and Visa ($494B market cap) (Slide 31).
- Projected financial results show a path to GAAP Net Income of $635 million by 2025, up from a projected loss of $220 million in 2020 (Slide 40).
- Lending remains the primary revenue driver, projected at $1.593 billion by 2025, but Financial Services is the fastest grower with a 153% projected CAGR (Slide 32, 40).
- The transaction was valued at an $8.7 billion post-transaction equity value, representing approximately 20x FY23 P/E (Slide 47).
The Macro Thesis: Disruption of Legacy Banking
SoFi begins its narrative by framing the financial services industry as a sector ripe for the same 'winner-takes-most' disruption seen in consumer electronics and retail. This is a classic 'Why Now' argument designed to prime investors for a large-scale valuation.
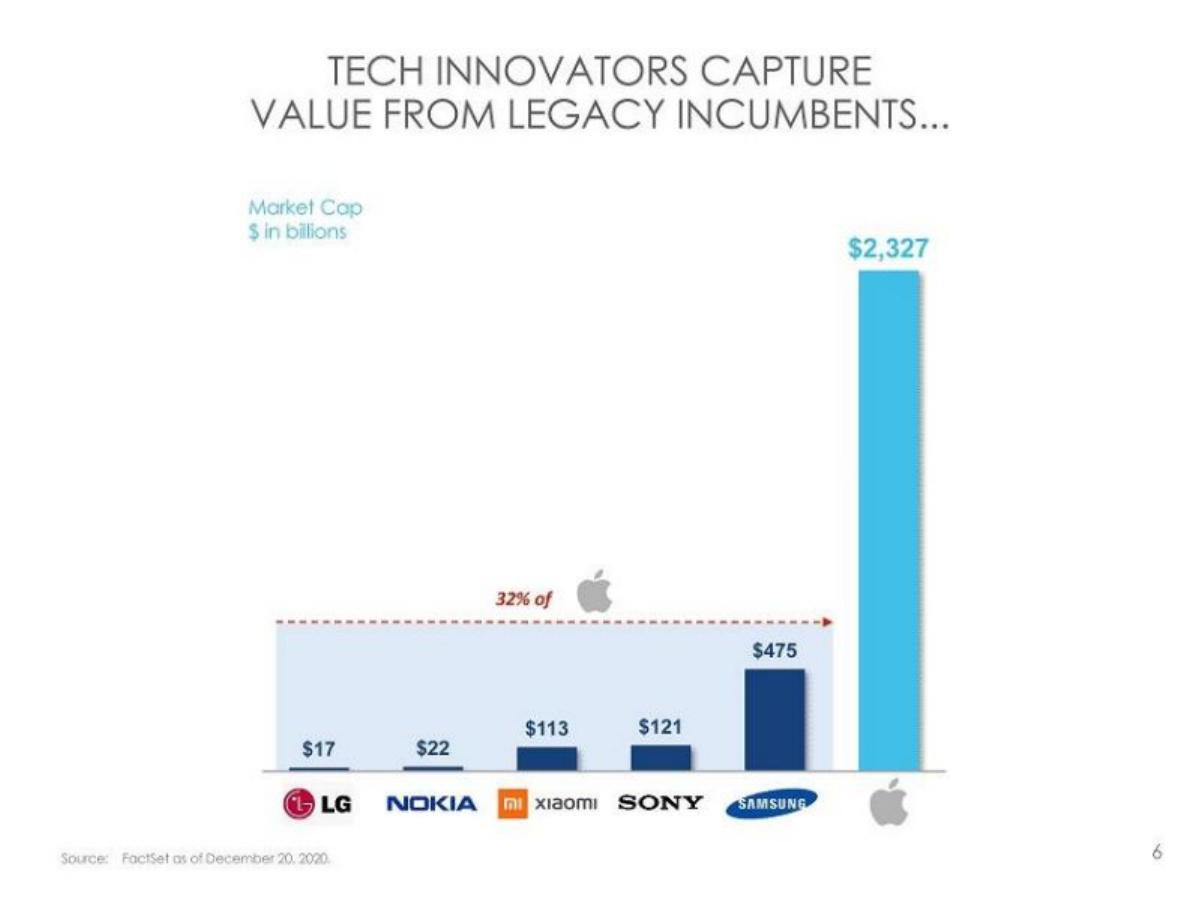
Slide 6: Tech Innovators Capture Value
The presentation opens with a comparison of Apple's market cap ($2,327 billion) against legacy handset makers like LG, Nokia, and Sony. The slide notes that Apple's market cap is significantly larger than the combined value of the incumbents it disrupted. This sets the stage for SoFi to claim a similar trajectory in banking.
Slide 11: The Amazon Comparison
A minimalist slide featuring only the Amazon logo serves as a transition. The implication is clear: SoFi intends to be the 'Amazon of Fintech,' moving from a single product (student loans) to a horizontal platform that dominates every category of its industry.
Slide 15: The Same Players are Still in Control
This slide highlights the stagnation of the banking sector. It shows the aggregate market cap of 'Too Big to Fail' banks reaching $1,166 billion in December 2020. The chart tracks the effective Fed funds rate against bank valuations, suggesting that despite economic shifts, a small group of incumbents still controls the lion's share of the market, leaving it vulnerable to a digitally native competitor.
Slide 19: Overwhelming and Siloed Choices
SoFi presents a 'market map' of the fintech landscape, showing dozens of logos categorized by service (Wealth Management, Checking, Insurance, etc.). The slide labels these as 'Overwhelming and Siloed Choices.' This identifies the problem SoFi intends to solve: fragmentation. By placing itself in the center, SoFi positions its 'Super App' as the solution to 'app fatigue' in personal finance.
The Solution: A Unified Financial Product Suite
After establishing the market gap, the deck moves into SoFi's specific value proposition and its three-pillar approach to consumer banking.
Slide 23: The Three Pillars
SoFi defines its competitive edge through three simple points: 1. Low / No Fees, 2. Fair and Transparent Lending, and 3. Full Suite of Services / Products. This is the 'what' of the business, focusing on consumer pain points with traditional banks.
Slide 27: Consumer + Enterprise
This transition slide introduces the dual nature of SoFi's business model. It is no longer just a B2C company; through its acquisition of Galileo, it has become a B2B infrastructure provider. This 'Consumer + Enterprise' strategy is the foundation for its 'Productivity Loop' mentioned later in the deck.
Slide 4: SoFi's Time in Financial Services
This slide quantifies the 'Winner Takes Most' opportunity. It shows a $2 trillion market opportunity, represented by the market caps of leaders like Visa ($494B), JPMorgan Chase ($363B), and Mastercard ($339B). SoFi positions itself as the modern alternative to these '1st Generation' companies whose technology was 'primarily built in 1950s and 1960s.'
Slide 8: Key Points of Differentiation
SoFi breaks down its member-centric approach into four categories: Fast, Selection, Content, and Convenience. It highlights specific actions like 'Fastest way to... buy / sell stock' and 'Personalized with member benefits.' The goal stated is to 'Build a TRUSTED RELATIONSHIP' and show that products are 'BETTER when used TOGETHER.'
The Engine: The Financial Services Productivity Loop
The core of the SoFi investment thesis is the 'Productivity Loop.' This is where the deck provides the unit economics that justify its multi-billion dollar valuation.
Slide 20: Unit Economics and Cross-Sell
This is arguably the most important slide in the deck. It provides a side-by-side comparison of a member with one product versus a member who cross-buys. Without cross-buy, a personal loan customer has a variable profit of $938. With cross-buy (coming from a 'Money' account), the variable profit jumps to $1,763—an 86% margin. The key takeaway is that the 'Member Acquisition' cost drops to $0 for the second product, as the user is already in the ecosystem.
Slide 24: The Productivity Loop Funnel
This slide visualizes the growth of the ecosystem. In Q3 2020, SoFi had ~2 million products. By the end of 2021, they projected ~4 million products. The funnel shows high-frequency, low-CAC products (Relay, Money, Invest) at the top, feeding into high-LTV, low-frequency products (Personal Loans, Student Loans, Home Loans) at the bottom. It notes that 60k loans from cross-buy were estimated to generate ~$48M in revenue.
Slide 28: Target Audience (HENWS)
SoFi defines its target demographic: 'High Earners Not Well Served.' These are individuals aged 22+ earning over $100,000 with high FICO scores. By focusing on this segment, SoFi ensures that its 'Productivity Loop' is populated by users with high lifetime value and low default risk.
Slide 35: Growth Compounding via Cross-Sell
The deck reinforces the cross-sell success with three key metrics: 65% of Home Loans come from existing members, 24% of new product sales come from existing members, and a total of 4 million products were projected for FY21.
The Enterprise Play: Galileo and Infrastructure
A significant portion of the deck is dedicated to Galileo, the payments processor SoFi acquired to bolster its technology stack and revenue diversity.
Slide 39: Galileo Total Accounts
This bar chart shows the explosive growth of Galileo's B2B platform. Accounts grew from 17 million in Q1 2019 to 50 million in Q3 2020. The headline, 'SoFi is turning a cost center into a profit center,' explains the strategic rationale: by owning the processor, SoFi pays itself for transaction processing while charging other fintechs to use the same rails.
Slide 32: Growth Trajectory and Lifecycle
This slide maps the three business segments. Financial Services is the 'entry' point with a 153% projected CAGR. The Technology Platform (Galileo) provides a 55% CAGR and 62% margin. Lending is the 'mature' engine with a 25% CAGR and 58% margin. This diversification is presented as a hedge against interest rate and geographic exposure.
Financial Projections and Valuation
The final section of the deck provides the hard numbers required for a SPAC merger, including five-year projections and the entry valuation for investors.
Slide 40: Selected Projected Financial Results
This detailed table provides a roadmap to profitability. Key figures include: Adjusted Net Revenue growing from $621 million (2020E) to $3.669 billion (2025E). Adjusted EBITDA is projected to swing from a $66 million loss in 2020 to a $1.177 billion profit in 2025. Crucially, GAAP Net Income is expected to turn positive in 2023 ($200 million) and reach $635 million by 2025.
Slide 47: Entry Valuation
The transaction is summarized with four key metrics: an $8.7B Post-Transaction Equity Value , a ~20x FY23 P/E multiple, a ~9x FY25 P/E multiple, and a 43% 5-YR Revenue CAGR . This slide is designed to show that while the entry price is high, the growth rate makes it attractive on a forward-looking basis.
What SoFi Does Well
The SoFi deck is exceptionally strong in its use of internal data to prove a strategic concept. The 'Productivity Loop' isn't just a buzzword; Slide 20 provides the exact dollar-for-dollar impact of cross-selling on variable profit. By showing that a second product has a $0 acquisition cost, they make a compelling case for the 'Super App' model that many other fintechs struggle to quantify.
Furthermore, the integration of Galileo is handled masterfully. Instead of treating it as a separate acquisition, they frame it as a vertical integration that improves the margins of the consumer business while providing a high-growth B2B revenue stream. This 'dual-engine' approach makes the company appear more resilient than a pure-play lender.
What is Missing
Despite the depth of the 90-slide deck, the 23-slide sample lacks a traditional 'Team' slide. While Anthony Noto's leadership is a known quantity, a SPAC deck usually benefits from highlighting the deep bench of banking and tech talent required to manage a bank charter. Additionally, there is little mention of the regulatory hurdles or the specific capital requirements associated with obtaining a bank charter, which was a major part of SoFi's strategy at the time.
The deck also leans heavily on 'Adjusted' metrics. While Slide 40 eventually shows GAAP Net Income, the primary narrative is built on 'Contribution Profit' and 'Adjusted EBITDA,' which can sometimes obscure the true cost of stock-based compensation and other non-cash expenses in a rapidly scaling tech company.
Founder Takeaways
Founders should study Slide 20 for how to present unit economics. Most decks simply state their CAC and LTV. SoFi goes a step further by showing how those metrics evolve as the customer relationship deepens. If you have a multi-product strategy, you must prove that the second product is cheaper to sell than the first.
Another takeaway is the 'Macro to Micro' flow. SoFi starts with the global banking industry (Slide 6), narrows down to the fintech landscape (Slide 19), and then lands on their specific target customer (Slide 28). This creates a sense of inevitability—that the market is shifting, and SoFi is the only player positioned to catch the wave. Finally, the use of a 'Productivity Loop' or 'Flywheel' diagram is a powerful way to communicate a complex business model in a single, repeatable image.
Frequently asked questions
- What is the 'Financial Services Productivity Loop' mentioned in the deck?
- It is SoFi's core strategic framework shown on Slide 24 and 28. It involves using low-CAC, high-frequency products (like Relay, Money, and Invest) to bring users into the ecosystem. Once inside, the data gathered allows SoFi to cross-sell high-LTV lending products (Personal Loans, Student Loan Refi) at near-zero additional marketing cost, significantly boosting the lifetime value of each member.
- How does SoFi justify its $8.7 billion valuation?
- The valuation is based on aggressive growth projections and margin expansion. Slide 47 cites a 43% five-year revenue CAGR and a valuation of ~20x FY23 P/E. This is supported by Slide 40, which projects Adjusted Net Revenue growing from $621 million in 2020 to over $3.6 billion by 2025, alongside a transition from net losses to significant profitability.
- What role does the Galileo acquisition play in this deck?
- Galileo is framed as the 'Technology Platform' segment. Slide 39 shows its rapid account growth (reaching 50 million accounts by Q3 2020). By owning the infrastructure that other fintechs use, SoFi vertically integrates its own stack (reducing costs) while generating high-margin (62% projected contribution margin) B2B revenue, as detailed on Slide 32.
- Who is SoFi's primary target customer according to the slides?
- Slide 28 explicitly identifies their target as 'HENWS'—High Earners Not Well Served. These are individuals aged 22 and older, predominantly earning over $100,000 per year with high FICO scores. The strategy is to capture these high-value users early in their professional lives and manage their entire financial lifecycle.
- What are the biggest risks or omissions in this presentation?
- While the deck is data-heavy, it omits a dedicated 'Team' slide in the 23-slide sample, which is unusual for a startup but common for a late-stage SPAC where the CEO (Anthony Noto) is already a public figure. It also relies heavily on 'Adjusted' metrics rather than GAAP figures for its primary narrative, though GAAP reconciliations are provided in the appendix (Slide 40).