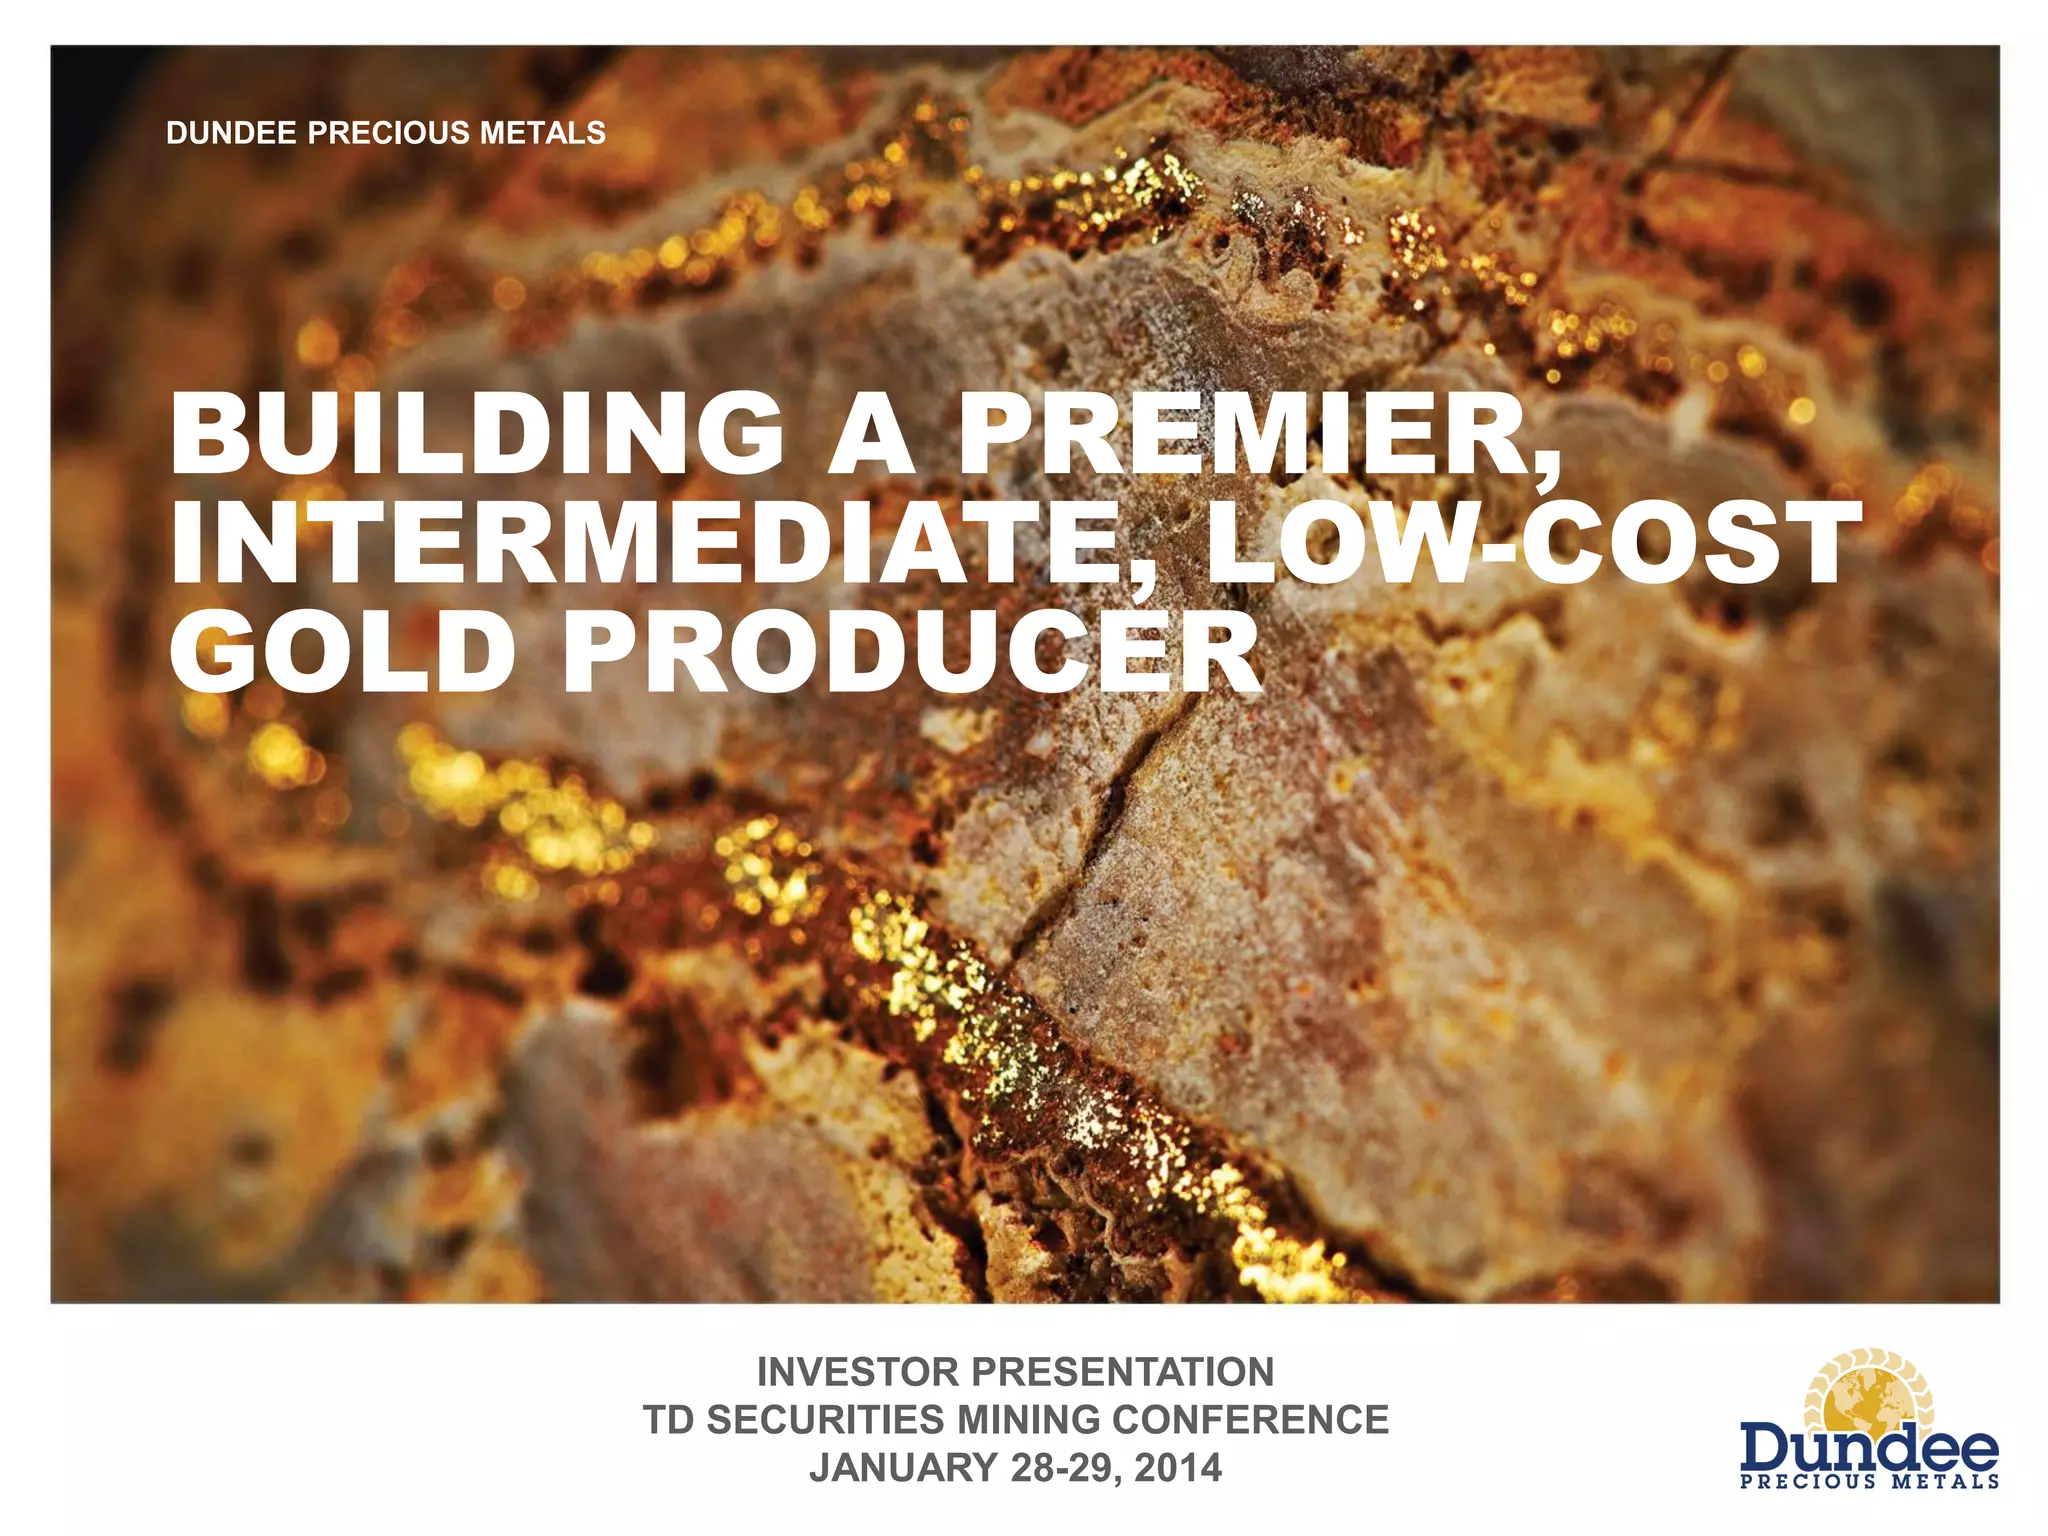
Dundee Precious Metals' 2014 investor presentation, prepared for the TD Securities Mining Conference, outlines its strategy to become a premier, low-cost gold producer. The deck highlights existing asset optimization, growth beyond current operations, and maintaining strong financial positions, as detailed on Slide 6. It showcases specific mine operations like Chelopech (Slide 11) and Krumovgrad (Slide 16), detailing recent accomplishments, outlooks, and asset overviews including resources, grades, and estimated mine life. The company emphasizes a compelling investment opportunity built on so…
Key takeaways
- The deck's title slide (Slide 1) clearly states the company's ambition to become 'BUILDING A PREMIER, INTERMEDIATE, LOW-COST GOLD PRODUCER' and identifies it as an 'INVESTOR PRESENTATION' for the 'TD SECURITIES MINING CONFERENCE'.
- Corporate Vision / Strategy (Slide 6) outlines five key objectives: building DPM into a premier producer, optimizing existing assets, growing beyond current assets, sustaining low quartile operating costs, and maintaining a strong balance sheet.
- Detailed operational data is provided for the Chelopech Mine (Slide 11), including 120,631 oz of gold and 42.7 Mlbs of copper produced in 2012, with cash costs of $9.00/oz (net of by-product credits).
- The Krumovgrad Mine (Slide 16) is presented as an 'open-pit, development-stage gold project' with an After-Tax NPV of $165.3 mm and an IRR of 31%.
- A 'COMPELING INVESTMENT OPPORTUNITY' (Slide 26) is framed around five pillars: Solid Financial Position, High Quality Assets with Further Potential, Commodity and Geographic Diversification, Pipeline of Organic Growth Opportunities, and Experienced Management Team and Board with Strong Track Record.
- Sustainable Development (Slide 31) is addressed across three categories: People, Health and Safety; Environment; and Local Communities, with total community spending & donations of $3.4mm in 2012.
- Detailed Chelopech Mineral Reserves and Resources as of December 31, 2012, are provided on Slide 36, broken down by category (Proven, Probable, Measured, Indicated, M&I, Inferred) and metal (Gold, Copper, Silver).
- The Kapan Mine: Cash Cost Reconciliation (Slide 41) presents detailed cost figures from Q3 2013 to Year 2009, showing cash cost of sales/oz gold (net of by-product credits) ranging from $599 in Q3 2013 to $501 in Year 2009.
Dundee Precious Metals Pitch Deck Teardown: TD Securities Mining Conference
This teardown analyzes the investor presentation by Dundee Precious Metals, prepared for the TD Securities Mining Conference in January 2014. The deck, comprising 44 slides in total, with 9 provided for this analysis, focuses on presenting the company's strategy, operational highlights, and financial performance to potential investors within the mining sector. As a presentation for a mining conference, its structure and content are tailored to an audience familiar with the industry's specific metrics and operational considerations.
The presentation aims to position Dundee Precious Metals as an attractive investment opportunity by showcasing its existing assets, growth projects, and commitment to sustainable practices. It provides detailed data on gold and copper production, reserves, and cash costs, which are critical for evaluating a mining company. While rich in operational and financial specifics, the deck omits certain elements commonly found in startup pitch decks, such as a dedicated team slide or an explicit funding ask, which is typical for established public companies presenting at industry conferences.
Slide 1: Cover Slide
The cover slide, titled 'BUILDING A PREMIER, INTERMEDIATE, LOW-COST GOLD PRODUCER', immediately sets the strategic ambition of Dundee Precious Metals. The company name, 'DUNDEE PRECIOUS METALS', is prominently displayed at the top left and bottom right, accompanied by its logo. The background features a blurred image of what appears to be gold ore, visually reinforcing the company's core business. Below the main title, the slide identifies the document as an 'INVESTOR PRESENTATION' for the 'TD SECURITIES MINING CONFERENCE' held on 'JANUARY 28-29, 2014'. This slide effectively communicates the company's focus and the context of the presentation.
Slide 6: Corporate Vision / Strategy
This slide, titled 'CORPORATE VISION / STRATEGY', outlines five key strategic pillars for Dundee Precious Metals. Each pillar is accompanied by a checkbox icon, suggesting a commitment to these objectives. The first objective is to 'Build DPM into a premier, international, intermediate, low-cost gold producer'. The second is to 'Optimize value of existing operating assets', with sub-points including 'Increase mine production and extend LOM' and 'Upgrade/expand smelter and establish long-term contracts that provide a stable return'. The third pillar is to 'Grow the business beyond existing operating assets', detailing 'Develop Krumovgrad Gold Project', 'Establish deep pipeline of greenfield exploration opportunities', and 'Complete acquisitions that offer accretive growth, diversity and gold exposure, while maintaining a conservative capital structure'. The fourth objective is to 'Sustain low quartile operating cost positions', and the fifth is to 'Maintain a strong balance sheet with ample liquidity and solid credit metrics'. The slide is visually enhanced with three images: miners underground, molten metal being poured, and an outdoor mining operation with a green plant in the foreground, illustrating different aspects of the mining process.
Slide 11: Chelopech Mine: Low Cost Operation with Lowest Quartile Cash Costs
Slide 11 focuses on the 'CHELOPECH MINE: LOW COST OPERATION WITH LOWEST QUARTILE CASH COSTS'. It presents 'Recent Accomplishments' and an 'Outlook' for the mine. Accomplishments include 'Mine/mill expansion completed on time and under budget in Q4 2012 (doubled capacity to 2 Mtpa)', 'Produced 120,631 oz of gold and 42.7 Mlbs of copper in 2012 at cash costs of $9.00/oz (net of by-product credits)', and 'Pyrite Recovery Project slated for completion and production to commence in Q1 2014'. The outlook includes plans to 'Capitalize on lower cost/ higher recovery staged flotation reactor technology', 'Perform targeted exploration to replace depletion and increase mineral resources/ reserves', and 'Continue to implement cost/margin improvements'.
An 'Asset Overview' table provides key data: 'DPM Ownership' at '100%', 'Location' in 'Bulgaria', 'Acquired' in 'Sept. 2003', 'Resources (at Dec 31, 2012)' of 'Gold (Moz) 4.7 (3.8g/t)' and 'Copper (Mlbs) 1,007.0 (1.2%)', 'Mine Type' as 'Underground', and 'Estimated Mine Life @ expanded rate' of '10+ years'. A bar chart at the bottom illustrates 'Gold Production (000 oz)' from 2009 to 2013F, showing an increase from 88 in 2009 to 125-143 in 2013F. Another bar chart displays 'EBITDA (US$M)' and 'Cash Cost (US$/oz)' from 2009 to 2013E, indicating EBITDA ranging from $369 in 2009 to $240-260 in 2013E, and cash costs ranging from $51 in 2009 to $9 in 2012, with a negative value in 2011.
Slide 16: Krumovgrad Mine: Open-Pit, Development-Stage Gold Project
Slide 16 details the 'KRUMOVGRAD MINE: open-pit, development-stage gold project'. 'Recent Accomplishments' include 'Successfully completed the EIA permitting process', 'Obtained a 30-year concession to develop deposit', 'Finalized archaeological work to support clearing of project site', and 'Completed basic engineering and initiated detailed engineering of process plant and integrated mine waste facility'. The 'Outlook' for Krumovgrad includes plans to 'Secure final local approvals required to proceed with ordering long lead items/construction', 'Seek opportunities to increase recoveries through use of SFR technology', 'Complete detailed engineering that optimizes value of project', and 'Evaluate other exploration opportunities within existing licenses and establish targeted drill program'.
An 'Asset Overview (1)' table provides specific project details: 'DPM Ownership' at '100%', 'Location' in 'Bulgaria', 'Deposit Type' as 'Low-sulphidation epithermal Au', 'Proposed Mine Type' as 'Open Pit', 'Gold Recoveries' at '85%', 'Grade' at '3.4 g/t', 'Annual ore tonnage production' of '850,000 tpy', 'Annual gold production' of '74,000 ounces', 'Mine Life' of '9 years', 'Capital Costs to complete' of '~US$127mm', 'Total cash cost per oz Au Eq' of '$404', 'Construction / Production' from '2015 / 2016', 'Average Annual EBITDA (2)' of '$52.6 mm', 'After-Tax NPV 7.5% (2)' of '$165.3 mm', and 'IRR (2)' of '31%'. A conceptual illustration of the Krumovgrad Gold Project is included at the bottom. Footnotes clarify that (1) is 'As per Krumovgrad 2012 Technical Report' and (2) 'Assuming gold and silver prices of $1,250/oz and $25.00/oz, respectively'.
Slide 21: DPM Brownfields Exploration Strategy: Krumovgrad
Slide 21 focuses on 'DPM BROWNFIELDS EXPLORATION STRATEGY: KRUMOVGRAD'. It features a schematic map outlining areas labeled 'Krumovgrad', 'IRAN TEPE', 'KHAN KRUM', and 'KESEBIR'. The map indicates 'Ground Magnetics - 200m Lines' with areas marked as 'Committed' and 'Contingent'. An 'Outlook' section lists exploration plans: 'Geophysics completed by end of 2013', 'Finalize target generation', 'Possible electrical geophysics follow up for targeting', and 'Second phase drilling depending on land use permitting'. The slide highlights the company's ongoing exploration efforts within its existing brownfield sites around Krumovgrad.
Slide 26: Compelling Investment Opportunity
This slide is titled 'COMPELLING INVESTMENT OPPORTUNITY' and presents a visual summary of Dundee Precious Metals' strengths. At the center is the Dundee Precious Metals logo. Five interconnected boxes surround the logo, each representing a key aspect of the investment opportunity. These are: 'Solid Financial Position', 'High Quality Assets with Further Potential', 'Commodity and Geographic Diversification', 'Pipeline of Organic Growth Opportunities', and 'Experienced Management Team and Board with Strong Track Record'. This slide acts as a high-level summary of the company's value proposition for investors, consolidating the detailed information presented in other slides.
Slide 31: Sustainable Development
Slide 31 addresses 'SUSTAINABLE DEVELOPMENT', dividing the company's efforts into three categories: 'People, Health and Safety', 'Environment', and 'Local Communities'. Under 'People, Health and Safety', points include 'Develop and operate sustainable businesses where the health and safety of our employees is paramount', '2,617 full-time and 825 contracted employees worldwide', '99% of employees and 86% at the manager level (or above) are local nationals', 'Local hiring, ongoing safety improvements, employee training and fair compensation assist in maintaining healthy labour relations', and 'Corporate, regional and human resource policies and programs reflect local needs to attract, retain and motivate employees'. It also notes '2013 focused on reducing Lost Time Injuries (LTI) and Lost Time Injury Frequency Rate (LTIFR) and achieving zero fatalities at all sites'.
For 'Environment', the slide lists 'Promote sustainable growth and responsibility through pragmatic environmental solutions and practices across the business', 'Ongoing investment in plant upgrades and modernization at all sites has resulted in significant energy efficiency improvements', 'Award-winning environmental conservation at Chelopech', 'Chelopech tailings and waste management policies compliant with international best practices', 'Emissions control project (Project 2012) substantially complete', 'Continued environmental improvements at Tsumeb in 2013 and beyond', and 'A $204mm contract was signed with Outotec, to install a sulphuric acid plant to capture sulphur dioxide emissions, which is due for commissioning in late 2014'.
Under 'Local Communities', the slide states 'Provide economic benefits and participate in community development in meaningful and innovative ways', 'Appoint corporate and local operational executives to manage political relationships and corporate social responsibility (CSR)', 'Award-winning CSR initiatives at Chelopech', and 'Established the Dundee Foundation in Bulgaria in 2012, to separate our national and site-specific CSR spending'. It also mentions 'Foster stakeholder engagement with two public information centers in Chelopech and one in Krumovgrad'. A pie chart shows 'Community Spending & Donations Totalled $3.4mm in 2012', with categories: 'Arts & Culture 40%', 'Education 17%', 'Infrastructure 24%', 'Health 2%', 'Trusts 7%', and 'Misc. 10%'.
Slide 36: Chelopech Mine: Updated Mineral Reserves and Resources
Slide 36 provides detailed tables for 'CHELOPECH MINE: UPDATED MINERAL RESERVES AND RESOURCES' as of 'December 31, 2012'. Two main tables are presented: 'Chelopech Mineral Reserves – December 31, 2012' and 'Chelopech Mineral Resources – December 31, 2012'.
The 'Mineral Reserves' table breaks down by 'Category' (Proven, Probable, Total) and metals (Gold, Copper, Silver). For Gold, it lists 'Tonnes (M)', 'Grade (g/t)', and 'Ounces (M)'. For Copper, it lists 'Grade (%)', and 'Pounds (M)'. For Silver, it lists 'Grade (g/t)', and 'Ounces (M)'. For example, 'Proven' reserves include 12.3 M tonnes of gold at 3.4 g/t (1.4 M ounces), 1.3% copper (340 M pounds), and 9.3 g/t silver (3.7 M ounces).
The 'Mineral Resources' table similarly breaks down by 'Category' (Measured, Indicated, M&I, Inferred) and metals (Gold, Copper, Silver). For example, 'Measured' resources include 15.1 M tonnes of gold at 4.0 g/t (2.0 M ounces), 1.5% copper (490 M pounds), and 10.3 g/t silver (5.0 M ounces). Footnotes provide context for the figures, including the basis for gold equivalent cut-off grades and the compliance with NI 43-101 standards.
Slide 41: Kapan Mine: Cash Cost Reconciliation
Slide 41 presents a 'KAPAN MINE: CASH COST RECONCILIATION'. This slide features a detailed table showing various cost components in 'US$ thousands, unless otherwise indicated' from 'Q3 2013 Actual' back to 'Year 2009 Actual'. Key line items include 'Cost of Sales', 'Less amortization & other', 'Plus other charges, including freight', 'Less by-product credits', 'Cash cost of sales after by-product credits', 'Gold oz (payable metal)', and 'Cash cost of sales/oz gold, (net of by-product credits)'.
For example, in 'Q3 2013 Actual', 'Cost of Sales' was '9,672', 'Less by-product credits' was '(6,721)', resulting in 'Cash cost of sales after by-product credits' of '3,894'. The 'Gold oz (payable metal)' for Q3 2013 was '6,500', leading to a 'Cash cost of sales/oz gold, (net of by-product credits)' of '$599'. The table shows this metric fluctuating, for instance, from '$501' in 'Year 2009 Actual' to '$93' in 'Year 2011 Actual', and then to '$1,032' in 'Q2 2013 Actual'. Seven footnotes detail the copper prices used for by-product credit calculations for different periods.
What Works Well
Dundee Precious Metals' investor presentation for the TD Securities Mining Conference excels in providing detailed, industry-specific information. The deck's strength lies in its comprehensive operational and financial data, which is crucial for an audience of mining investors. The 'CORPORATE VISION / STRATEGY' (Slide 6) is clearly articulated, setting a strong foundation for the company's direction. The detailed 'Asset Overview' tables for Chelopech (Slide 11) and Krumovgrad (Slide 16) provide essential metrics like ownership, location, resources, grades, mine life, and financial projections (NPV, IRR), which are critical for evaluating mining projects. The inclusion of 'Recent Accomplishments' and 'Outlook' for each mine demonstrates a forward-looking perspective backed by past performance.
The 'Sustainable Development' slide (Slide 31) is a significant positive, showcasing the company's commitment beyond just financial returns. It addresses environmental, social, and governance (ESG) factors, which are increasingly important to investors. The breakdown of community spending and donations adds a tangible dimension to their CSR efforts. Furthermore, the 'COMPELING INVESTMENT OPPORTUNITY' slide (Slide 26) effectively summarizes the key value propositions, making it easy for investors to grasp the overarching benefits. The 'Cash Cost Reconciliation' (Slide 41) provides granular financial transparency, allowing for a deep dive into the cost structure, which is vital for a commodity-based business.
What is Missing
While the deck is strong on operational and financial data, it omits several elements commonly found in pitch decks, particularly those from earlier-stage companies or those seeking specific funding. There is no dedicated 'Team' slide, which is a standard component for showcasing the experience and expertise of the leadership. For an investor presentation, highlighting the management team's track record and capabilities is often crucial for building confidence. Although Slide 26 mentions an 'Experienced Management Team and Board with Strong Track Record', it does not provide any names, roles, or specific achievements.
The deck also lacks an explicit 'Ask' slide, which would typically detail the amount of funding sought, its intended use, and the proposed terms. Given this is an investor presentation at a conference, the 'ask' might have been communicated verbally or in accompanying materials, but its absence from the slides means the specific purpose of the fundraising is not explicitly stated within the deck itself. Similarly, there is no 'Problem/Solution' framework, which is common in many pitch decks to articulate the market need and how the company addresses it. For an established mining company, the 'problem' might be implicitly understood (e.g., global demand for precious metals), but an explicit statement could still strengthen the narrative. Finally, a competitive landscape analysis or a clear market size slide is not present, which could provide context on Dundee Precious Metals' position relative to its peers and the overall industry opportunity.
What a Founder Should Copy
Founders, especially those in capital-intensive industries or with complex operational models, can learn valuable lessons from Dundee Precious Metals' presentation style. Firstly, the clear articulation of 'CORPORATE VISION / STRATEGY' (Slide 6) is excellent. Defining strategic pillars provides a roadmap and demonstrates a well-thought-out plan. Founders should strive to present their strategic direction with similar clarity and actionable objectives.
Secondly, the detailed 'Asset Overview' and 'Outlook' sections for specific projects (Slides 11, 16) are highly effective. Providing concrete metrics, accomplishments, and future plans for key assets builds credibility and demonstrates a deep understanding of the business. For founders, this translates to presenting specific product roadmaps, key performance indicators (KPIs), and milestones with granular detail. The inclusion of financial projections like NPV and IRR, even with footnotes for assumptions, is also a strong practice for demonstrating potential returns.
Thirdly, the 'Sustainable Development' slide (Slide 31) is a model for integrating ESG considerations into an investor narrative. Founders should consider how to articulate their commitment to social responsibility, environmental stewardship, and good governance, as these factors are increasingly important to investors. Quantifying community impact, as seen with the pie chart of spending, makes these efforts tangible. Lastly, the 'COMPELING INVESTMENT OPPORTUNITY' summary (Slide 26) is a great way to distill complex information into easily digestible value propositions, which can serve as a strong concluding statement or an executive summary for investors.
Frequently asked questions
- What is the primary objective of Dundee Precious Metals as stated in the deck?
- The primary objective, as stated on the title slide (Slide 1) and reiterated on Slide 6, is to build Dundee Precious Metals into a premier, intermediate, low-cost gold producer. This involves optimizing existing assets, growing operations, sustaining low operating costs, and maintaining a strong financial position.
- What specific financial or operational metrics are provided for the Chelopech Mine?
- For the Chelopech Mine (Slide 11), recent accomplishments include producing 120,631 oz of gold and 42.7 Mlbs of copper in 2012, with cash costs of $9.00/oz (net of by-product credits). The mine's estimated life is stated as 10+ years, and it is identified as an underground mine.
- How does Dundee Precious Metals describe its investment opportunity?
- On Slide 26, the company describes a 'COMPELLING INVESTMENT OPPORTUNITY' based on five pillars: a Solid Financial Position, High Quality Assets with Further Potential, Commodity and Geographic Diversification, a Pipeline of Organic Growth Opportunities, and an Experienced Management Team and Board with a Strong Track Record.
- Does the deck provide information on the company's sustainability efforts?
- Yes, Slide 31 is dedicated to 'SUSTAINABLE DEVELOPMENT'. It covers initiatives related to People, Health and Safety (e.g., 2,617 full-time employees), Environment (e.g., energy efficiency improvements, emissions control), and Local Communities (e.g., appointing corporate and local operational executives, $3.4mm in community spending & donations in 2012).
- What key information is missing from the provided slides that is often found in pitch decks?
- Based on the provided slides, key omissions include a dedicated 'Team' slide detailing key personnel, an explicit 'Ask' outlining the funding sought and its use, and a 'Problem/Solution' framework. The deck also lacks a clear market size analysis or competitive landscape overview.