WeDidIt's 12-slide deck is a masterclass in visual storytelling and traction-led pitching. By focusing on the 'data-driven' aspect of fundraising, the company moved away from the traditional 'charity tech' stigma and into the lucrative world of data analytics. The deck successfully highlights a massive $50B market size (Slide 2) and demonstrates rapid growth in analyzed donor records, jumping from 5k in April to 4.2M by September (Slide 10). While the specific revenue figures are redacted in this version, the inclusion of high-profile clients like Amnesty International and the Los Angeles Zoo…
Key takeaways
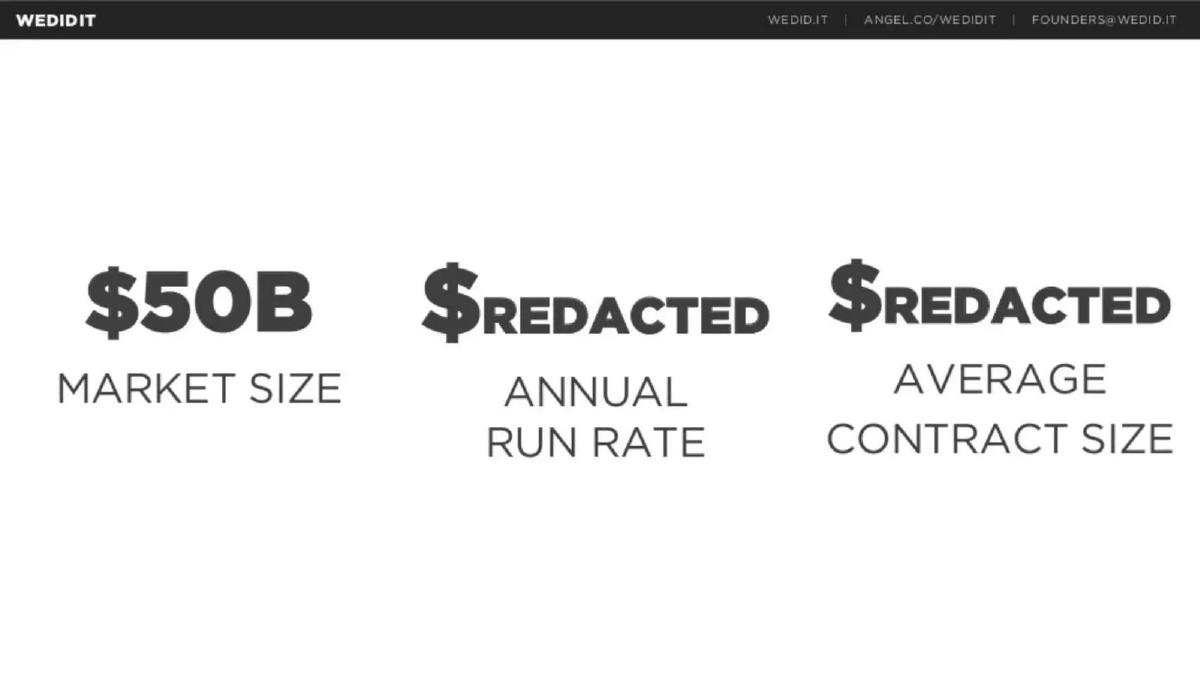
- The deck defines the market size at a substantial $50B on Slide 2.
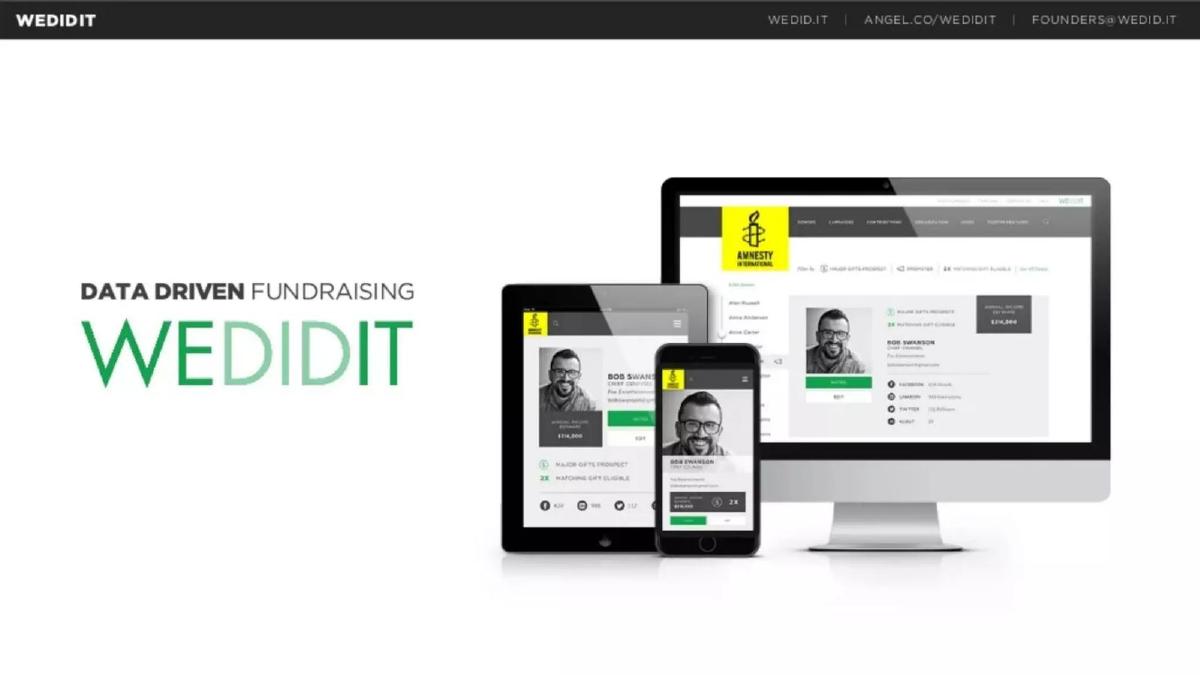
- WeDidIt positions itself as 'Data Driven Fundraising' on the title slide to differentiate from generic donation platforms.
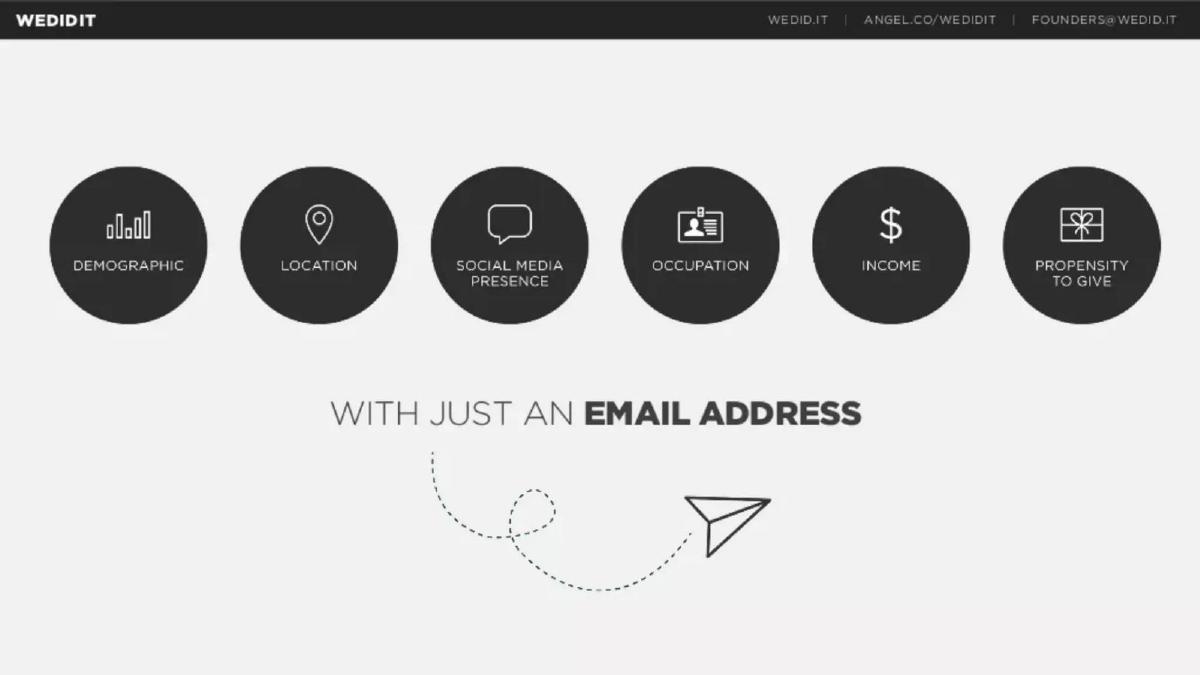
- Product utility is demonstrated by showing how they extract six data points, including 'Propensity to Give,' from just an email address on Slide 6.
- Traction is validated by a list of 65 clients, including major organizations like California State University Fullerton and Amnesty International on Slide 7.
- The company claims a 20% increase in client fundraising ROI on Slide 7.
- Data processing scale is shown via a steep growth curve, reaching 4.2M analyzed donor records by September on Slide 10.
- The founding team leverages past experience at high-growth companies like Google, DoubleClick, and Meltwater on Slide 11.
- The deck completely omits a formal 'Ask' slide or a detailed breakdown of how the $1.6M would be spent.
The WeDidIt Pitch Deck Teardown
WeDidIt entered the market in 2012, a time when the nonprofit sector was struggling to transition from traditional direct mail to digital-first strategies. Their deck, which helped secure $1.6 million, focuses heavily on the transition from 'guesswork' to 'data.' By framing fundraising as a data science problem, they appealed to the burgeoning interest in Big Data that defined the early 2010s venture capital landscape.
Slide 1: Title and Positioning
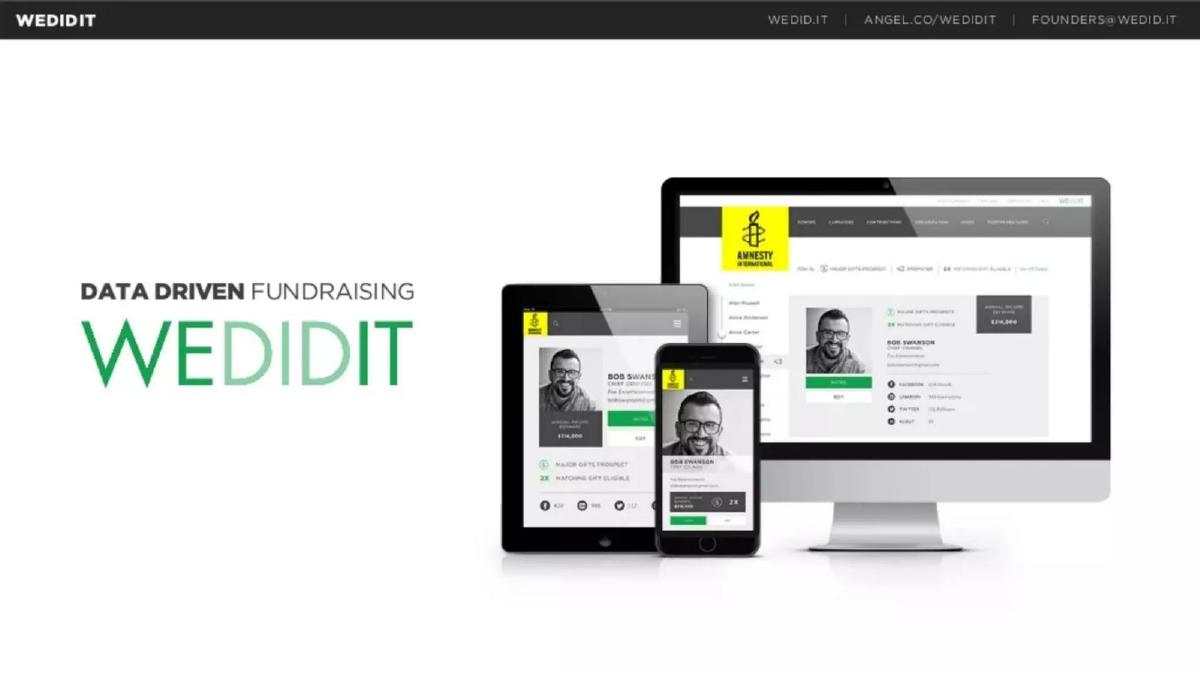
The title slide is minimalist, featuring the company logo and the tagline "DATA DRIVEN FUNDRAISING." The inclusion of a laptop, tablet, and smartphone displaying the interface immediately signals that this is a modern, multi-platform SaaS solution. The contact information, including an AngelList link, is placed in the header, which was a common practice for startups raising during the rise of that platform.
Slides 2-3: Market and High-Level Metrics
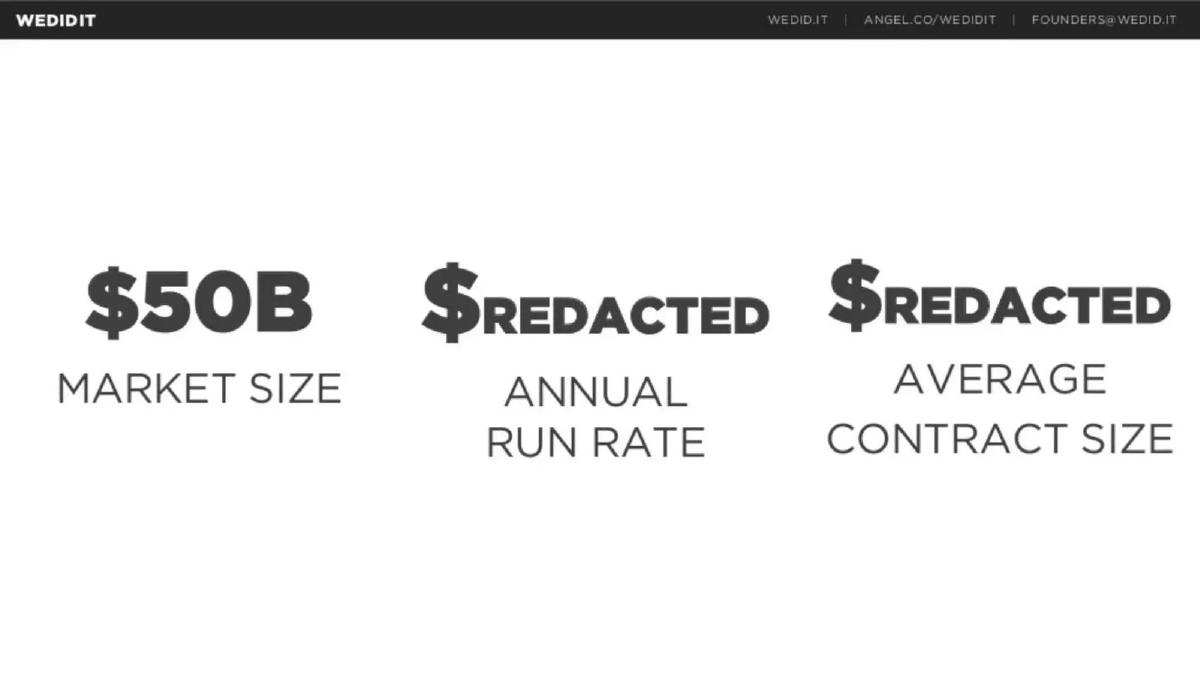
Slide 2 sets the stage with three large figures. The "$50B MARKET SIZE" establishes the scale of the opportunity. The other two metrics, "ANNUAL RUN RATE" and "AVERAGE CONTRACT SIZE," are redacted in this public version, but their prominent placement suggests that the founders were leading with their financial performance. Slide 3 is a duplicate of Slide 2, likely used for emphasis during a live presentation.
Slides 4-5: The Problem of Fragmentation
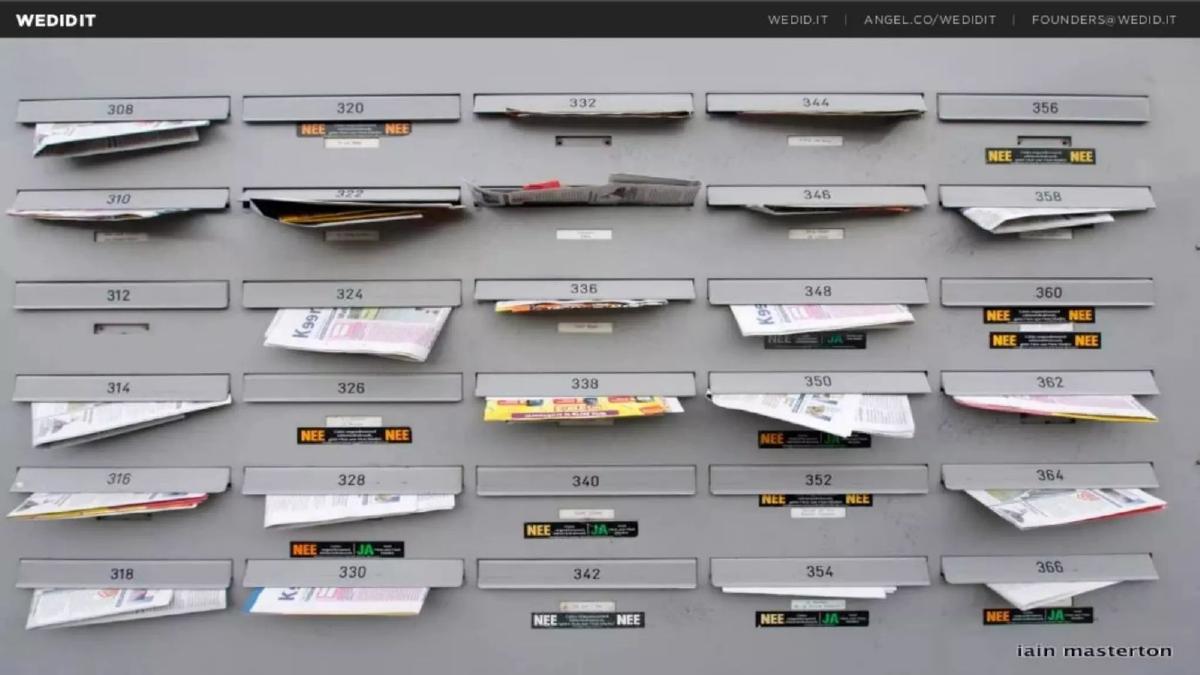
Slide 4 uses a full-bleed image of mailboxes stuffed with paper, a visual metaphor for the 'old way' of fundraising (snail mail). Slide 5 articulates the digital version of this chaos. It shows a stressed worker surrounded by stacks of paper, with icons representing Excel charts, Twitter trends, Street Fundraising, Snail mail, Facebook insights, Emails, LinkedIn, and MailChimp. The message is clear: donor data is everywhere, and it is overwhelming for nonprofit staff to consolidate.
Slide 6: The Solution - Data Enrichment
This is the 'magic' slide. It claims that "WITH JUST AN EMAIL ADDRESS," WeDidIt can provide six key pillars of donor intelligence: Demographic, Location, Social Media Presence, Occupation, Income, and Propensity to Give. This slide addresses the core technical value proposition: automated data enrichment that replaces manual research.
Slide 7: Traction and Social Proof
WeDidIt uses Slide 7 to prove they aren't just a concept. They list "65 CLIENTS" and display logos for California State University Fullerton, Amnesty International, Los Angeles Zoo & Botanical Gardens, and the Network for Teaching Entrepreneurship. Most importantly, they claim that "CLIENT FUNDRAISING ROI" is "UP 20%," providing a concrete reason for nonprofits to pay for the service.
Slides 8-9: Revenue Growth
Slides 8 and 9 are dedicated to "ARR" and "Sales in September." While the numbers are redacted, the fact that these occupy their own slides indicates that the company had significant month-over-month growth that they wanted to highlight as a standalone achievement.
Slide 10: The Data Moat
Slide 10 shows a chart of "ANALYZED DONOR RECORDS." The growth is dramatic: 5k in April, 15k in May, 20k in June, 30k in July, 240k in August, and a massive jump to 4.2M in September. This exponential curve suggests a viral loop or a major enterprise integration that significantly increased their data assets, which is a key indicator of future platform power.
Slide 11: The Team
The founders— Su Sanni, Ben Lamson, and Bryan Liff —are presented with their respective roles (CEO, Sales & Marketing, CTO). The logos at the bottom of their profiles (Google, DoubleClick, Meltwater, Huffington Post) serve as a proxy for competence, showing that the team has experience at both massive tech giants and high-growth media/data companies.
Slide 12: Closing
The final slide returns to the logo and contact information. It is a standard 'thank you' slide that keeps the focus on the brand identity.
What Works in the WeDidIt Deck
Visual Simplicity: The deck uses very little text. It relies on large numbers and clear icons to tell the story, which prevents the audience from getting bogged down in details during a pitch. · Metric-Driven Narrative: Even with redactions, it is clear the deck is built around traction. By highlighting ROI, client count, and data volume, they answer the 'does it work?' question early. · Clear Pain Point: The 'stressed worker' slide (Slide 5) is highly relatable to anyone who has worked in a nonprofit or sales environment, making the solution feel necessary rather than just 'nice to have.'
What is Missing from the WeDidIt Deck
The Ask: There is no slide stating how much money they are looking for or what the milestones for the next 18 months are. This is a significant omission for a fundraising deck. · Competitive Landscape: The deck doesn't mention other fundraising platforms like Blackbaud or emerging crowdfunding sites. Investors usually want to know how a startup plans to defend its position against incumbents. · Business Model: While they mention contract sizes, they don't explain the pricing structure (e.g., is it a percentage of funds raised, a monthly SaaS fee, or a per-record enrichment fee?). · Unit Economics: There is no mention of Customer Acquisition Cost (CAC) or Lifetime Value (LTV), which are critical for 'Later' stage companies to prove scalability.
What a Founder Should Copy
The 'One Piece of Input' Slide: Slide 6 is excellent. Showing how a complex output (six data points) comes from a simple input (one email) is the best way to demonstrate product power. · Growth Curve Selection: If your revenue is still small, find a 'proxy metric' that is growing fast—like WeDidIt did with 'Analyzed Donor Records' on Slide 10—to show the scale of your platform's activity. · Social Proof Placement: Don't just list logos; list the number of clients and the specific ROI you generated for them on the same slide. It turns a 'logo cloud' into a 'case study.'
Frequently asked questions
- What is the primary value proposition of WeDidIt according to the deck?
- The primary value proposition is transforming donor research into an automated, data-driven process. As shown on Slide 6, the platform takes a single email address and returns demographics, location, social media presence, occupation, income, and 'propensity to give.' This solves the problem of fragmented data sources illustrated on Slide 5, where founders highlight the chaos of managing Excel charts, Twitter trends, and snail mail.
- How does WeDidIt demonstrate market validation?
- Market validation is demonstrated through three core metrics on Slide 7: a total of 65 active clients, the inclusion of recognizable logos like Amnesty International, and a specific performance metric claiming that client fundraising ROI increases by 20%. This combination of quantity, quality (brand names), and outcome (ROI) provides a strong signal of product-market fit.
- Who are the founders and what is their background?
- The founding team consists of Su Sanni (CEO), Ben Lamson (Sales & Marketing), and Bryan Liff (CTO). According to Slide 11, they bring experience from established tech and media firms including Google, DoubleClick, Meltwater Group, The Huffington Post, and Brown Brothers Harriman. This suggests a blend of technical capability and enterprise sales experience.
- What is the significance of the growth chart on Slide 10?
- Slide 10 tracks 'Analyzed Donor Records' from April to September. It shows an exponential growth curve, starting at 5,000 records and skyrocketing to 4.2 million in just six months. For an investor, this slide represents the 'engine' of the business; it proves the software's ability to ingest and process massive amounts of data, which is critical for a data-driven fundraising platform.
- What key fundraising elements are missing from this deck?
- The deck lacks several standard components: there is no 'Ask' slide detailing the amount being raised or the terms, no 'Use of Funds' slide, and no detailed 'Competition' slide. Additionally, while Slide 2 mentions 'Average Contract Size,' the actual financial figures for ARR and monthly sales are redacted, leaving the viewer without a clear picture of the company's unit economics or revenue efficiency.