KiKi's 2019 seed deck is a concise 10-slide presentation that successfully secured $250,000 in funding. The company positions itself as a disruptor in the social and dating app space by introducing a revenue-sharing model where users are rewarded for real-world experiences. The deck leans heavily on its business model—a 70/30 split with users and a merchant subscription fee—and its rapid early traction, showing a jump from $1.6k to $205k in quarterly revenue over one year. While the deck lacks a formal 'Ask' slide and detailed unit economics, it effectively uses the prestige of its investors…
Key takeaways
- The startup claims a total addressable market of $20 billion on slide 8.
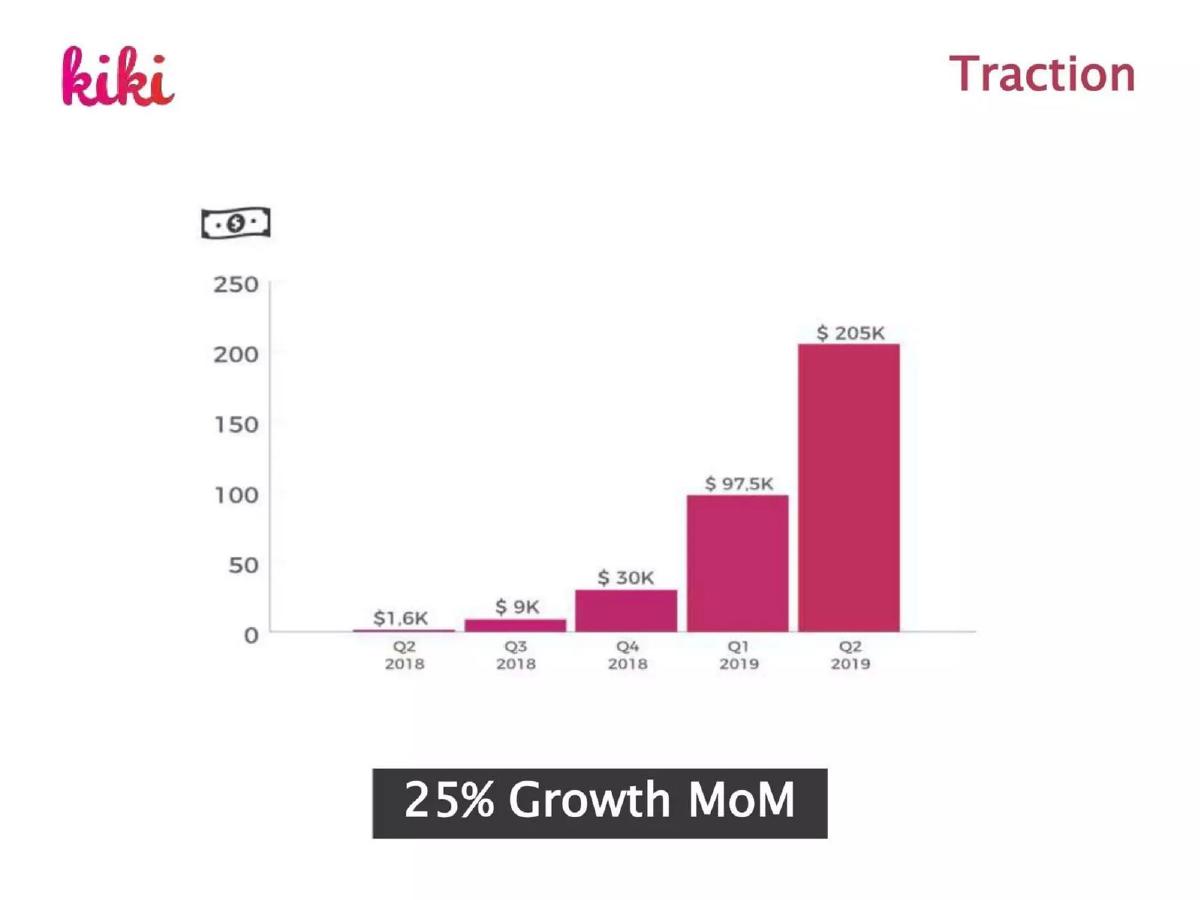
- Revenue growth is the primary highlight, showing a move from $1.6K in Q2 2018 to $205K in Q2 2019 on slide 6.
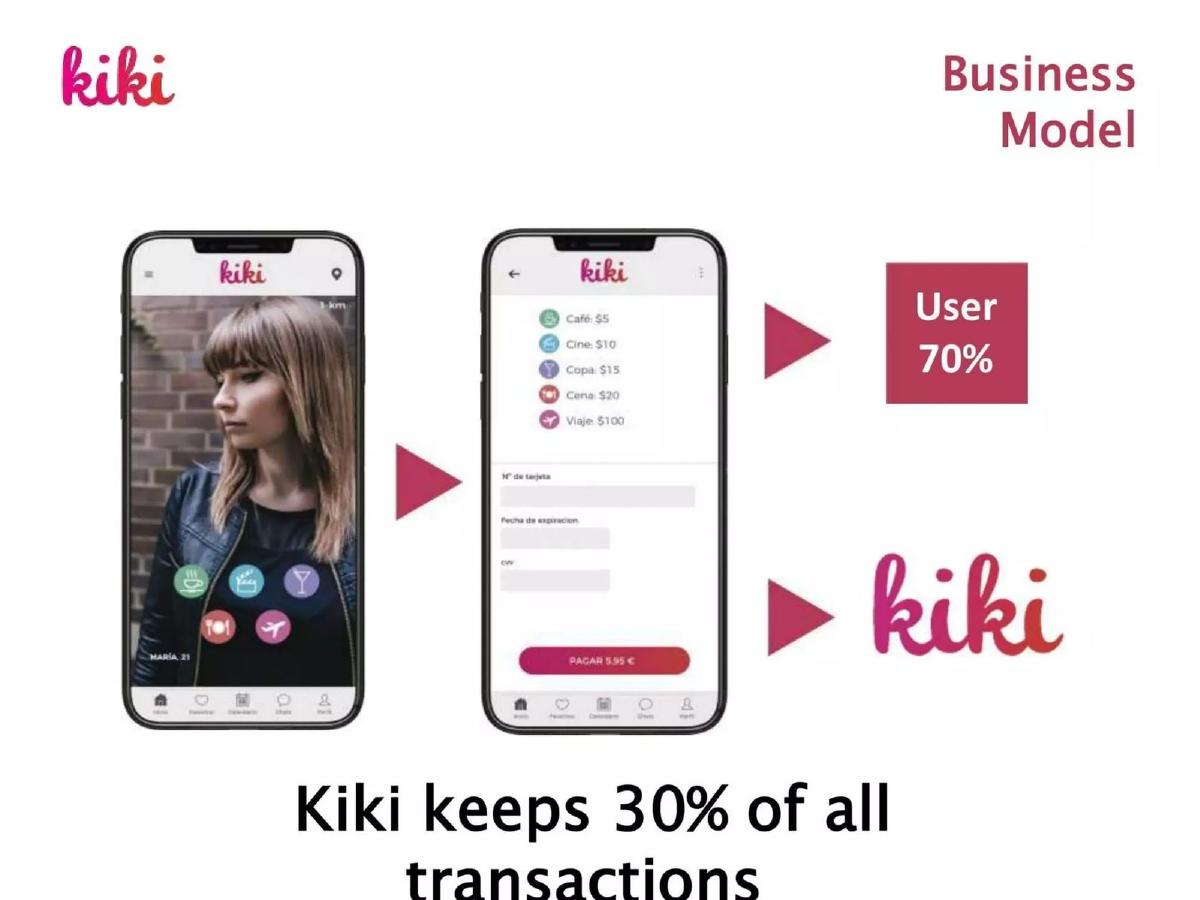
- The business model relies on a 70% payout to users, with KiKi retaining 30% of all transactions as shown on slide 4.
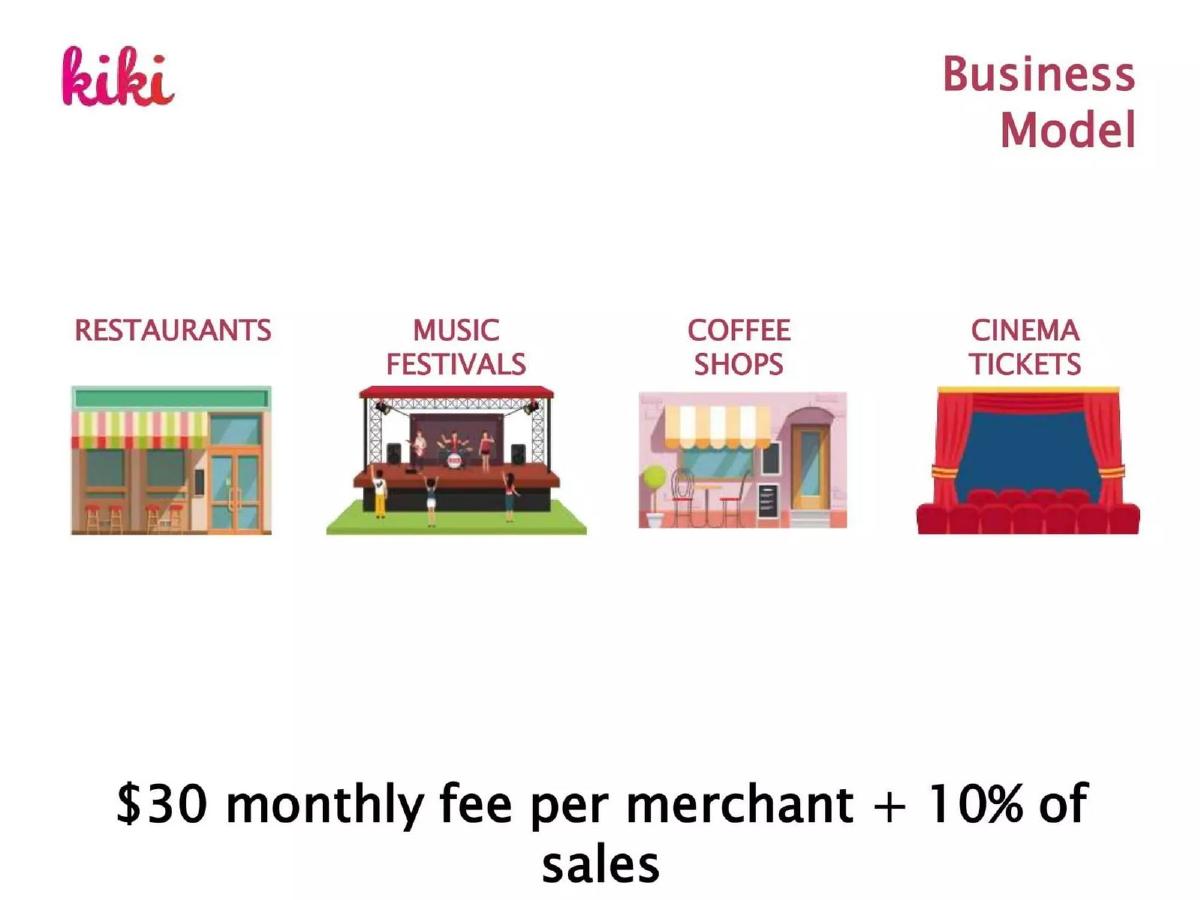
- A secondary revenue stream involves a $30 monthly fee per merchant plus 10% of sales, targeting restaurants and coffee shops on slide 5.
- The deck identifies a target audience of over 500 million Millennials and Gen Z users who are 'bored' with traditional social apps on slide 2.
- KiKi positions itself as the 'Airbnb' or 'Uber' of dating, aiming to disrupt traditional markets as illustrated on slide 7.
- The team slide (slide 9) highlights high-profile backing from 500 Startups and Tim Draper.
- The deck completely omits a slide detailing the specific funding amount requested or the planned use of funds.
Introduction: The Social Network that Pays
KiKi entered the crowded social and dating app market in 2018 with a unique premise: instead of keeping users glued to their screens to maximize ad revenue, the app would pay users to meet in real life. This 10-slide deck was used during their time at 500 Startups in 2019 to secure $250,000 in seed funding. The presentation is a classic example of a 'traction-first' deck, where the business model and growth numbers do the heavy lifting to overcome the inherent skepticism surrounding new social networks.
Slide 1: Title and Hook
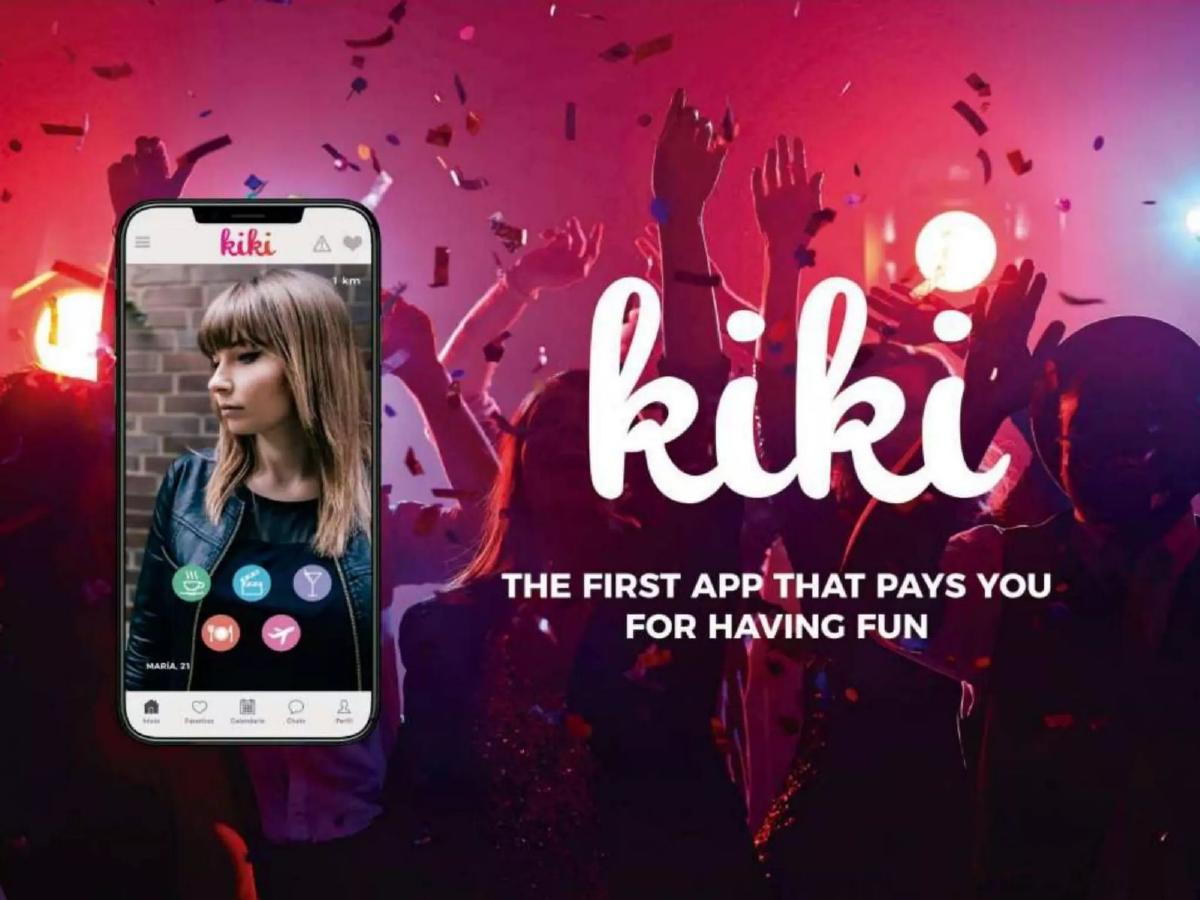
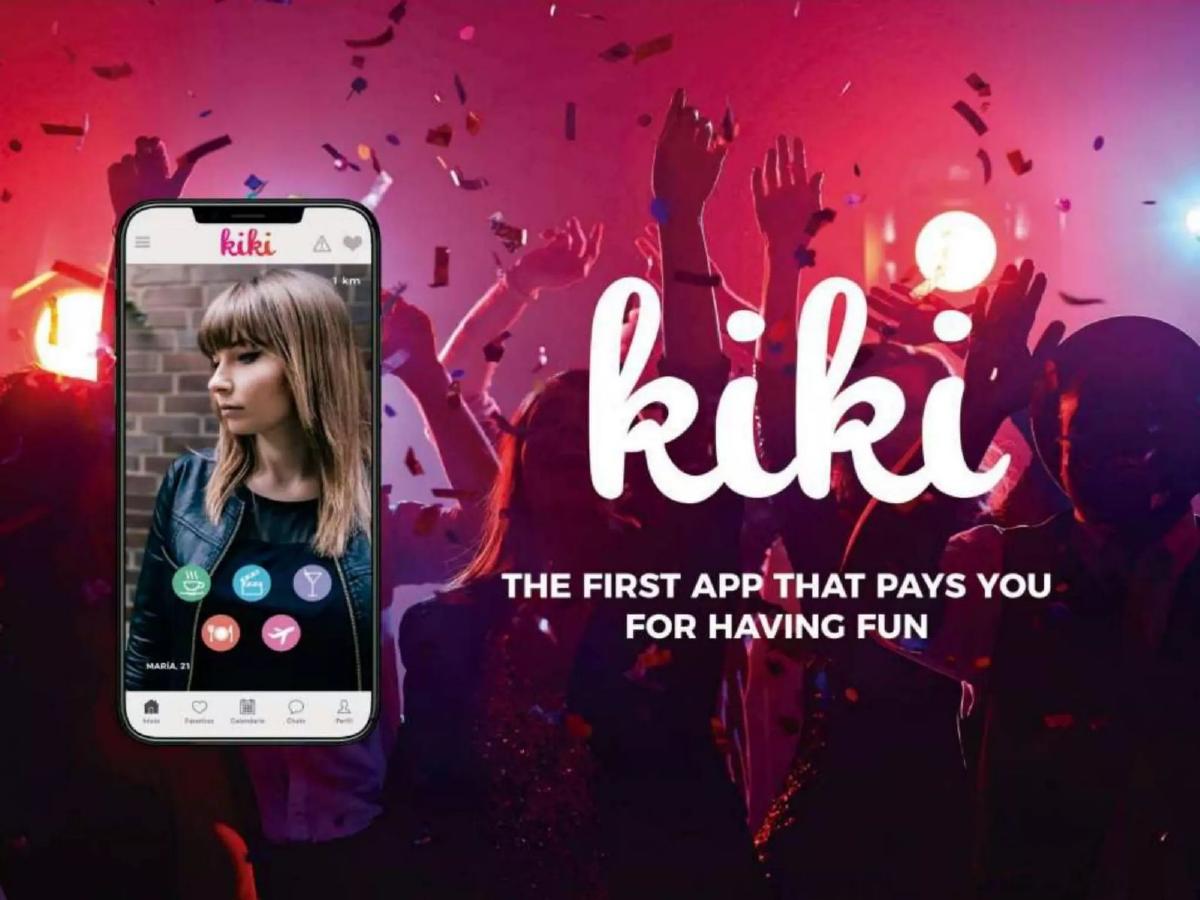
The cover slide features high-energy imagery of a party, immediately signaling the 'social' and 'fun' nature of the product. The tagline, "THE FIRST APP THAT PAYS YOU FOR HAVING FUN," is a bold hook. It also includes a smartphone mockup showing the UI, which features icons for coffee, drinks, and dining, grounding the abstract concept of 'fun' into specific, transactable real-world activities.
Slide 2: The Problem
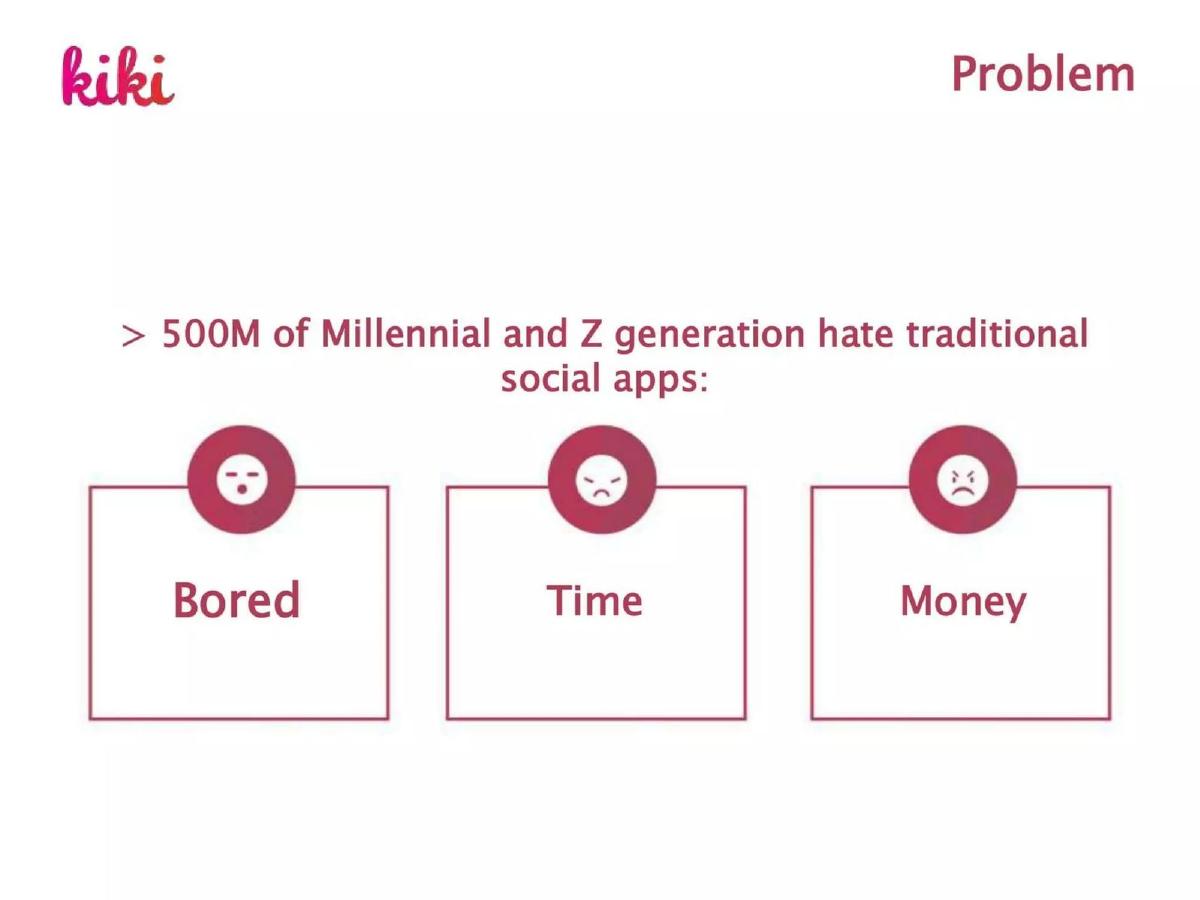
KiKi identifies a massive market of "500M of Millennial and Z generation" who supposedly "hate traditional social apps." The slide breaks the problem down into three pillars: Bored , Time , and Money . While the slide is light on text, the implication is that current apps are time-wasters that offer no financial return to the user, leading to platform fatigue.
Slide 3: The Solution
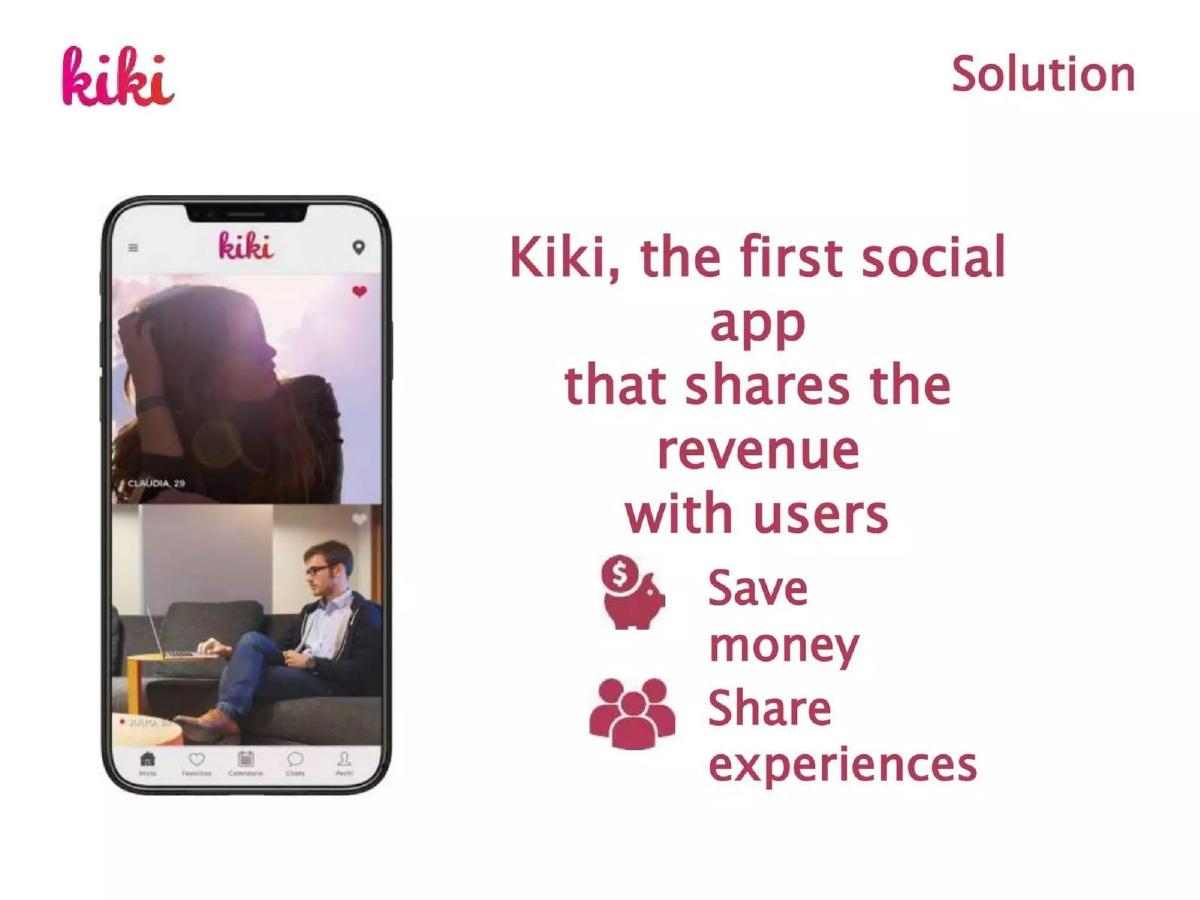
The solution slide defines KiKi as "the first social app that shares the revenue with users." It lists two primary benefits: "Save money" and "Share experiences." By framing the app as a way to monetize one's social life, KiKi attempts to differentiate itself from Tinder or Bumble, which are often viewed as purely transactional or gamified time-sinks.
Slide 4: Business Model - User Side
This slide is critical for understanding how the 'paying users' mechanic actually works. It shows a UI where users can select activities with associated costs: Café ($5), Cine ($10), Copa ($15), Cena ($20), and Viaje ($100) . The flow indicates that when a transaction occurs, the "User [receives] 70%" and "KiKi keeps 30% of all transactions." This clarifies that KiKi isn't just giving money away; it is acting as a marketplace for social experiences where the 'host' or 'inviter' is compensated.
Slide 5: Business Model - Merchant Side
KiKi introduces a second revenue stream targeting local businesses. By partnering with Restaurants, Music Festivals, Coffee Shops, and Cinemas , KiKi charges a "$30 monthly fee per merchant + 10% of sales." This positioning turns the app into a lead-generation tool for the hospitality and entertainment industries, diversifying its income beyond user-to-user fees.
Slide 6: Traction
This is the 'money slide.' It displays a bar chart of quarterly revenue growth from 2018 to 2019. The figures are:
Q2 2018: $1.6K · Q3 2018: $9K · Q4 2018: $30K · Q1 2019: $97.5K · Q2 2019: $205K
The slide also highlights "25% Growth MoM." For a seed-stage startup, showing a jump from $1.6k to over $200k in annual run-rate within a year is a powerful indicator of product-market fit.
Slide 7: Market Disruption
To help investors categorize the company, KiKi uses a 'Comparison' framework. It aligns itself with famous disruptors: Hotels vs. Airbnb , Retailers vs. Amazon , and Taxi vs. Uber . It then places Dating vs. KiKi at the bottom. This suggests that KiKi is doing to the dating/social industry what Uber did to transportation—introducing a gig-economy element to personal interactions.
Slide 8: Market Size
Using an iceberg graphic, KiKi visualizes its opportunity. Above the water are competitors like Tinder, Happn, CoffeeMeetsBagel, Airbnb, and Groupon . KiKi is represented as the massive bulk of the iceberg below the surface. The slide claims a "$20 BILLION MARKET," though it does not provide a source or a breakdown of how that figure was calculated (TAM/SAM/SOM).
Slide 9: Team & Advisors
The team slide is heavy on social proof. It features Chris (CEO) , described as a serial entrepreneur, and Manuel (COO) , with a background at KPMG. The middle row is dedicated to their heavy-hitting investors: 500 Startups and Tim Draper . The bottom row lists advisors from Adobe, the White House, and Nokia/Beats . For a $250k round, this level of advisory and institutional backing is exceptionally strong.
Slide 10: Contact and Call to Action
The final slide uses the hashtag #LetsKiKi and provides the CEO's direct email and phone number. It is a standard closing slide that maintains the brand's pink-and-white visual identity.
What Works in This Deck
The strongest element of this deck is the Traction Slide (Slide 6) . In the social media space, where many startups fail to monetize for years, KiKi showed immediate and scaling revenue. By proving that users were willing to pay for these experiences early on, they de-risked the investment significantly. Additionally, the Business Model (Slides 4 & 5) is remarkably clear. Many founders struggle to explain complex revenue-sharing mechanics, but KiKi used simple icons and percentages to make it instantly understandable.
The inclusion of Tim Draper and 500 Startups (Slide 9) acts as a powerful 'trust signal.' For a small $250k seed round, having one of the world's most famous venture capitalists (Draper) associated with the project suggests that the due diligence has already been done by experts.
What Is Missing
The most glaring omission is the Ask Slide . There is no mention of how much money they are looking for, what the valuation is, or what the 'milestones' for the next 18 months look like. While this information is often discussed in person, including it in the deck helps set the stage for the negotiation.
Furthermore, the deck lacks Unit Economics . While we see total revenue, we don't see the Customer Acquisition Cost (CAC). In social apps, growth is often expensive. Investors would want to know if that $205K in revenue cost $300K in marketing to acquire. There is also no Product Roadmap or Technology slide. It’s unclear if there is any proprietary matching algorithm or if the app is purely a manual marketplace.
What a Founder Should Copy
Founders should emulate the visual simplicity of this deck. There are no walls of text. Each slide has one job and one clear takeaway. The use of the 'Iceberg' and 'Disruption' analogies (Slides 7 & 8) are excellent ways to communicate a complex vision using familiar mental models. If you are building a marketplace, the Revenue Split slide (Slide 4) is a perfect template for showing how money flows through your ecosystem without over-complicating the visual design.
Frequently asked questions
- What is KiKi's core value proposition?
- KiKi positions itself as a social network that 'shortens the virtual time' of users by incentivizing real-world meetings. According to slide 3, it is the first social app that shares revenue with users. The goal is to move interactions from the screen to physical experiences like coffee, dinner, or trips, rewarding users with 'KiKi Coins' for these engagements.
- How does KiKi generate revenue?
- The company employs a dual-sided monetization strategy. Slide 4 shows that KiKi takes a 30% commission on all user-to-user transactions. Additionally, slide 5 outlines a B2B model where merchants (restaurants, cinemas, etc.) pay a $30 monthly subscription fee plus a 10% commission on sales generated through the app.
- What traction did KiKi show to investors?
- KiKi demonstrated significant early revenue growth. Slide 6 features a bar chart showing quarterly revenue starting at $1.6K in Q2 2018 and scaling to $205K by Q2 2019. The slide claims a 25% Month-over-Month (MoM) growth rate, which was likely the primary driver for their $250,000 seed round.
- Who are the key people and investors behind KiKi?
- The team is led by CEO Chris, a serial entrepreneur in marketing, and COO Manuel, formerly of KPMG. The startup gained significant credibility by joining 500 Startups and receiving backing from Tim Draper (DU Ventures). Slide 9 also lists advisors with backgrounds at Adobe, Nokia, and the White House.
- What is missing from the KiKi pitch deck?
- The deck is missing several standard components. Most notably, there is no 'Ask' slide detailing how much they are raising or the valuation. It also lacks a detailed breakdown of user acquisition costs (CAC), lifetime value (LTV), or a roadmap showing future product milestones beyond the initial Spanish MVP.