The TIM Brasil investor presentation from May 2015 serves as a strategic roadmap for a telecommunications incumbent facing a maturing market. With 45 slides in total, the deck focuses on the 'Internet Market Evolution,' highlighting a projected shift where internet services would grow from 12% of revenue in 2010 to 60% by 2020. The company emphasizes its 32% market share in 4G and a 27% year-over-year increase in data users as of 1Q15. A significant portion of the deck is dedicated to 'Cost Efficiency,' projecting a decline in Mobile Termination Rates (MTR) and Subscriber Acquisition Costs (S…
Key takeaways
- The company projects internet services will comprise 60% of the revenue mix by 2020, up from just 12% in 2010 (Slide 6).
- TIM Brasil achieved a 32% market share in 4G and accounted for 50% of smartphone sales in the market as of 1Q15 (Slide 11).
- Data ARPU (Average Revenue Per User) saw a 29% year-over-year increase between 1Q14 and 1Q15 (Slide 11).
- The deck forecasts a significant reduction in Mobile Termination Rates (MTR), dropping from R$0.34 in 2012 to a projected R$0.02 by 2019 (Slide 6).
- Operational efficiency is a core pillar, with projections showing a steady decline in Subscriber Acquisition Cost (SAC) through 2017 (Slide 26).
- The company participated in the 700MHz auction, securing Block 2 for a winning bid of R$1,947 million, a 0.99% premium over the minimum price (Slide 31).
- Gross revenues for 1Q15 were R$6,819,970 thousand, representing a 3.2% decrease compared to 1Q14 (Slide 41).
- Value Added Services (VAS) grew 21.8% year-over-year, reaching R$1,825,718 thousand in 1Q15, offsetting declines in long distance and interconnection (Slide 41).
Executive Summary: A Legacy Giant in Transition
The TIM Brasil investor presentation from May 2015 is a comprehensive look at a telecommunications leader navigating the most significant shift in the industry's history: the death of voice and the birth of the data-centric economy. The deck is data-heavy, transparent, and strategically focused on how the company intends to maintain its margins through operational efficiency and 4G dominance.
Slide 1: Title and Branding
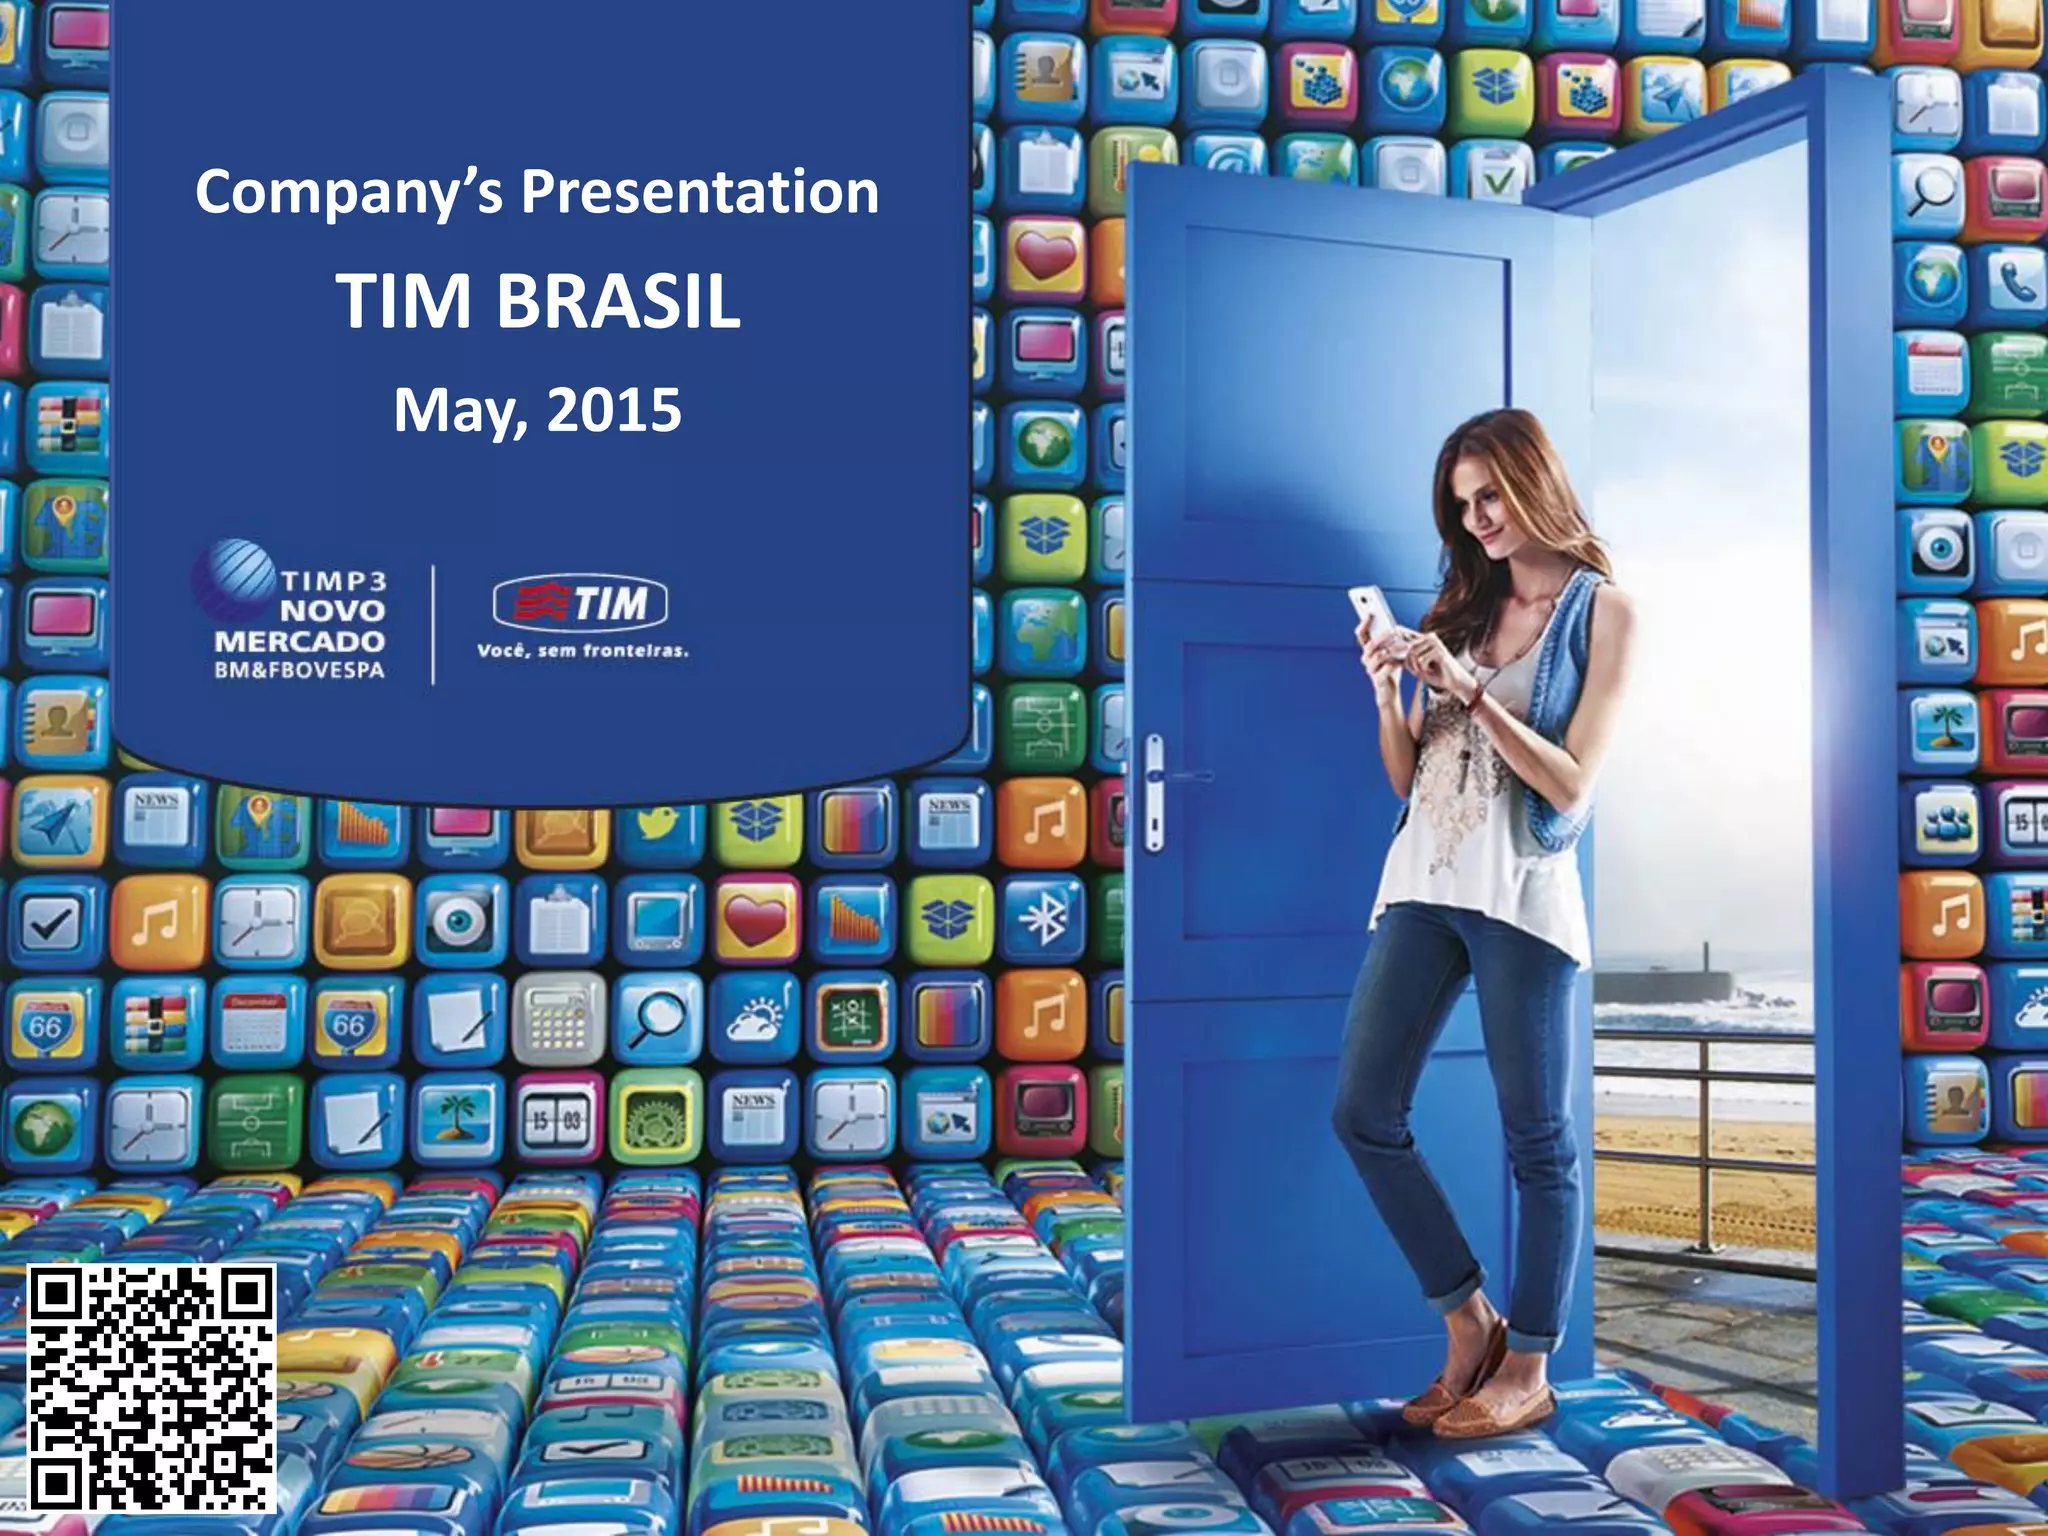
The cover slide establishes the context: a formal 'Company’s Presentation' for TIM Brasil dated May 2015. It includes the ticker symbol (TIMP3) and its listing on the Novo Mercado BM&FBOVESPA, signaling to investors that the company adheres to high standards of corporate governance. The imagery of a woman stepping through a door made of mobile apps into a bright, open landscape serves as a metaphor for the transition from a closed utility to an open digital platform.
Slide 6: Strategic Positioning and Market Evolution
This is arguably the most important slide for understanding the company's long-term thesis. Titled 'Internet Market Evolution,' it visualizes the 'Revenue Mix' shift. In 2010, Voice (Incoming and Outgoing) dominated the revenue stream, with Internet accounting for only 12%. By 2020, TIM projects Internet will grow to 60%, while Voice Outgoing shrinks to 37% and SMS collapses to 1%. Key Metric: The slide notes a 'Sharp Decrease' in SMS traffic from 9.5 billion in Jan-13 to 2.6 billion in Nov-14. To counter this, TIM highlights 'Internet Opportunities' in a market where most households lack fixed access, making mobile the primary gateway to the web.
Slide 11: The 4G Growth Engine
Slide 11, 'Data Growth Continues, Fueled by 4G,' provides the proof of concept for the strategy outlined on Slide 6. Value Added Services (VAS) Gross Revenues grew from R$1.2 billion in 1Q13 to R$1.8 billion in 1Q15. Key Figures: Data users grew 27% YoY, and Data ARPU (Average Revenue Per User) increased by 29%. Most notably, TIM claims a 32% market share in 4G and states that they represent 50% of the market share of smartphone sales, positioning them as the primary hardware provider for the data revolution.
Slide 18 & 22: Section Dividers
These slides serve as simple thematic breaks for 'Network and Quality Evolution' and 'Fixed Business.' While they contain no data, they indicate a structured presentation that addresses infrastructure and non-mobile business units, though the specific details for these sections are not included in this 9-slide sample.
Slide 26: Cost Efficiency and Projections
For an investor, this slide is the 'how.' It outlines the path to profitability through 2017. The 'Mobile Customer Base' is projected to grow from 73.4 million in 2013 to 75.7 million in 2014, with continued growth expected through 2017. Operational Efficiency: The slide forecasts a decline in Subscriber Acquisition Cost (SAC) and Leased Lines Costs. It also shows a dramatic 'MTR Path' (Mobile Termination Rate) dropping from R$0.34 in 2012 to R$0.02 in 2019. The 'EBITDA - Capex' chart at the bottom right shows a projected expansion of the margin, suggesting that the heavy investment phase is yielding to a period of higher cash flow retention.
Slide 31: The 700MHz Auction Details
This slide provides granular detail on a major capital expenditure: the 700MHz spectrum auction. TIM secured Block 2 (National) for a winning bid of R$1,947 million. The slide compares this to competitors Vivo and Claro, who paid similar amounts. Strategic Context: TIM highlights that the 'Spectrum acquisition at fair price' (1.07 USD/MHz/Pop adjusted for GDP) was below the international average of 1.22, suggesting disciplined capital allocation. It also outlines a 'Clean-up Cost Road Map' of R$1,199 million through 2018 to prepare the spectrum for use.
Slide 36: Competitive Offer Landscape
This slide is a dense matrix comparing the 'Recent Main Changes' in offers from TIM, Vivo, Claro, and Oi. It tracks changes quarterly from 1Q14 to 1Q15. For TIM, it notes the launch of 'Infinity Turbo 7' and the increase of SMS and internet offers to R$0.60/day. This slide demonstrates that TIM is hyper-aware of its competitors' pricing strategies, particularly the move toward blocking internet access once data limits are reached—a significant shift in consumer billing logic at the time.
Slide 41: Quarterly Historical Data
The final slide in the sample is a full financial P&L. Key Financial Data: Gross Revenues for 1Q15 were R$6,819,970 thousand, down 3.2% YoY. However, 'Value added services - VAS' grew 21.8% to R$1,825,718 thousand. Operating Expenses were reduced by 5.3%, leading to an EBITDA of R$1,339,501 thousand (a 1.7% increase). Net Income for 1Q15 stood at R$312,701 thousand, a 16% decrease from 1Q14, largely driven by a 116.9% increase in negative Net Financial Results (financial expenses).
What TIM Brasil Does Well
The deck is exceptionally strong in its transparency and granularity . Unlike many startup decks that hide behind vague 'market trends,' TIM Brasil provides exact figures for SMS traffic decline, specific auction bid premiums, and a line-by-line competitive comparison. By showing the 'MTR Path' and 'SAC' projections, they give investors a clear mathematical basis for their margin expansion claims. The use of the 2010-2020 revenue mix chart (Slide 6) is a masterclass in 'anchor and adjust' storytelling—it acknowledges the decline of the old business while providing a credible, data-backed vision for the new one.
What is Missing
Despite its length (45 slides), the 9-slide sample omits several critical areas. There is no team or leadership slide in this selection, which is vital for understanding who is executing this complex transition. There is also a lack of qualitative customer sentiment data ; while they show data usage increasing, they don't address churn rates or customer satisfaction in the face of price increases and data caps. Finally, the 'Fixed Business' section is represented only by a divider, leaving a gap in the narrative regarding how their landline and broadband assets complement the mobile strategy.
Founder Takeaways: Copy These Strategies
The 'Bridge' Narrative: If your company is pivoting or facing a declining legacy market, use a chart like Slide 6 to show exactly how the new revenue stream will overtake the old one over a 10-year horizon. · Competitive Benchmarking: Don't just say you are better than competitors. Create a matrix like Slide 36 that tracks specific feature launches and price changes over time. It proves you are paying attention. · Regulatory Awareness: TIM uses the 'MTR Path' to show how government regulations will actually help their bottom line. If your industry is regulated, show the 'regulatory tailwinds' in your favor. · Unit Economics Evolution: Slide 26 shows SAC (Subscriber Acquisition Cost) not just as a static number, but as a declining trend. Founders should show how their CAC will decrease as the brand matures or operations scale. · Financial Granularity: Providing a full P&L (Slide 41) rather than just a few 'vanity metrics' builds immense trust with sophisticated investors.
Frequently asked questions
- How did TIM Brasil address the decline in traditional voice revenue?
- TIM Brasil leaned heavily into the 'Data Growth' narrative. Slide 11 shows that while voice was declining, Data (Web & Content) gross revenues grew from R$1.2 billion in 1Q13 to R$1.8 billion in 1Q15. They positioned 4G as the primary fuel for this growth, capturing 32% of the 4G market share to ensure that as customers migrated away from voice, they remained within the TIM ecosystem for data-heavy consumption.
- What was the company's strategy regarding cost management?
- The strategy, detailed on Slide 26, focused on three pillars: Network & Interconnection Savings, Operational Efficiency, and Fixed Business Progress. They specifically targeted a reduction in Leased Lines Costs and Subscriber Acquisition Costs (SAC). Furthermore, they highlighted the 'MTR Path,' showing a regulatory-driven decrease in interconnection costs that would improve margins over time as the market shifted toward data.
- How did TIM Brasil compare to its competitors in terms of pricing and offers?
- Slide 36 provides a rare, granular look at the competitive landscape, listing specific offer changes for TIM, Vivo, Claro, and Oi from 1Q14 to 1Q15. TIM highlighted its move to increase SMS and internet offers from R$0.50 to R$0.60 per day and its 'Infinity Turbo 7' launch. This transparency suggests a highly commoditized market where TIM sought to lead on data-centric plan innovations.
- What were the results of the 700MHz spectrum auction for TIM?
- According to Slide 31, TIM successfully bid R$1,947 million for Block 2 (10+10 MHz) in the national 700MHz auction. This was a strategic win, as the price was only 0.99% above the minimum price. The slide also notes a 'Clean-up Cost Road Map' totaling R$1,199 million through 2018, which was necessary to clear the spectrum for mobile use.
- What do the 1Q15 financial results indicate about the company's health?
- Slide 41 shows a mixed financial picture. While Gross Revenues fell 3.2% YoY, EBITDA grew 1.7% to R$1,339,501 thousand, and EBITDA margins improved by 1.4 percentage points to 29.5%. This indicates that despite top-line pressure from a maturing voice market, the company's cost-cutting measures and transition to higher-margin data services were successfully protecting the bottom line.