MedReleaf’s October 2017 presentation is a masterclass in establishing 'medical-grade' authority within a nascent, highly regulated industry. At the time of the deck, the company boasted an $890 million market capitalization and an 18% market share in Canada. The deck effectively uses comparative metrics, such as showing their patients consume 1.8x the national average (1.35 grams per day vs. 0.75), to signal product efficacy and brand loyalty. Financially, the company demonstrated rapid scaling, growing Adjusted EBITDA from $4.6 million in F2016 to $13.9 million in F2017. While the deck focu…
Key takeaways
- MedReleaf claimed an 18% market share of the Canadian medical dried cannabis market as of June 2017 (Slide 4).
- The company achieved significant profitability growth, with Adjusted EBITDA rising from $4.6 million in F2016 to $13.9 million in F2017 (Slide 7).
- MedReleaf patients consume 1.35 grams per day, which is 1.8x the national average of 0.75 grams (Slide 7).
- The product portfolio includes over 20 dried products, 4 oil products, and 4 capsule products (Slide 16).
- Extracts as a percentage of sales grew from 2.8% in Q3 F17 to 14.3% in Q1 F18 (Slide 19).
- The company emphasizes safety through third-party testing for over 300 pesticides and contaminants (Slide 13).
- Management holds a 7.1% ownership stake in the company based on 93.2 million fully diluted shares (Slide 22).
- The executive team features significant healthcare and institutional experience, including former VPs from Mount Sinai Hospital and Deloitte (Slide 22).
Executive Summary and Market Positioning
The MedReleaf investor presentation from October 2017 serves as a strategic snapshot of a company at the height of the Canadian medical cannabis expansion. With a market capitalization of $890 million (Slide 1), the deck is designed to reassure institutional investors of the company's operational maturity and clinical focus. Unlike many 'green rush' decks of the era that focused on speculative cultivation square footage, MedReleaf leads with market share and profitability metrics.
Slide 1: Title and Market Data
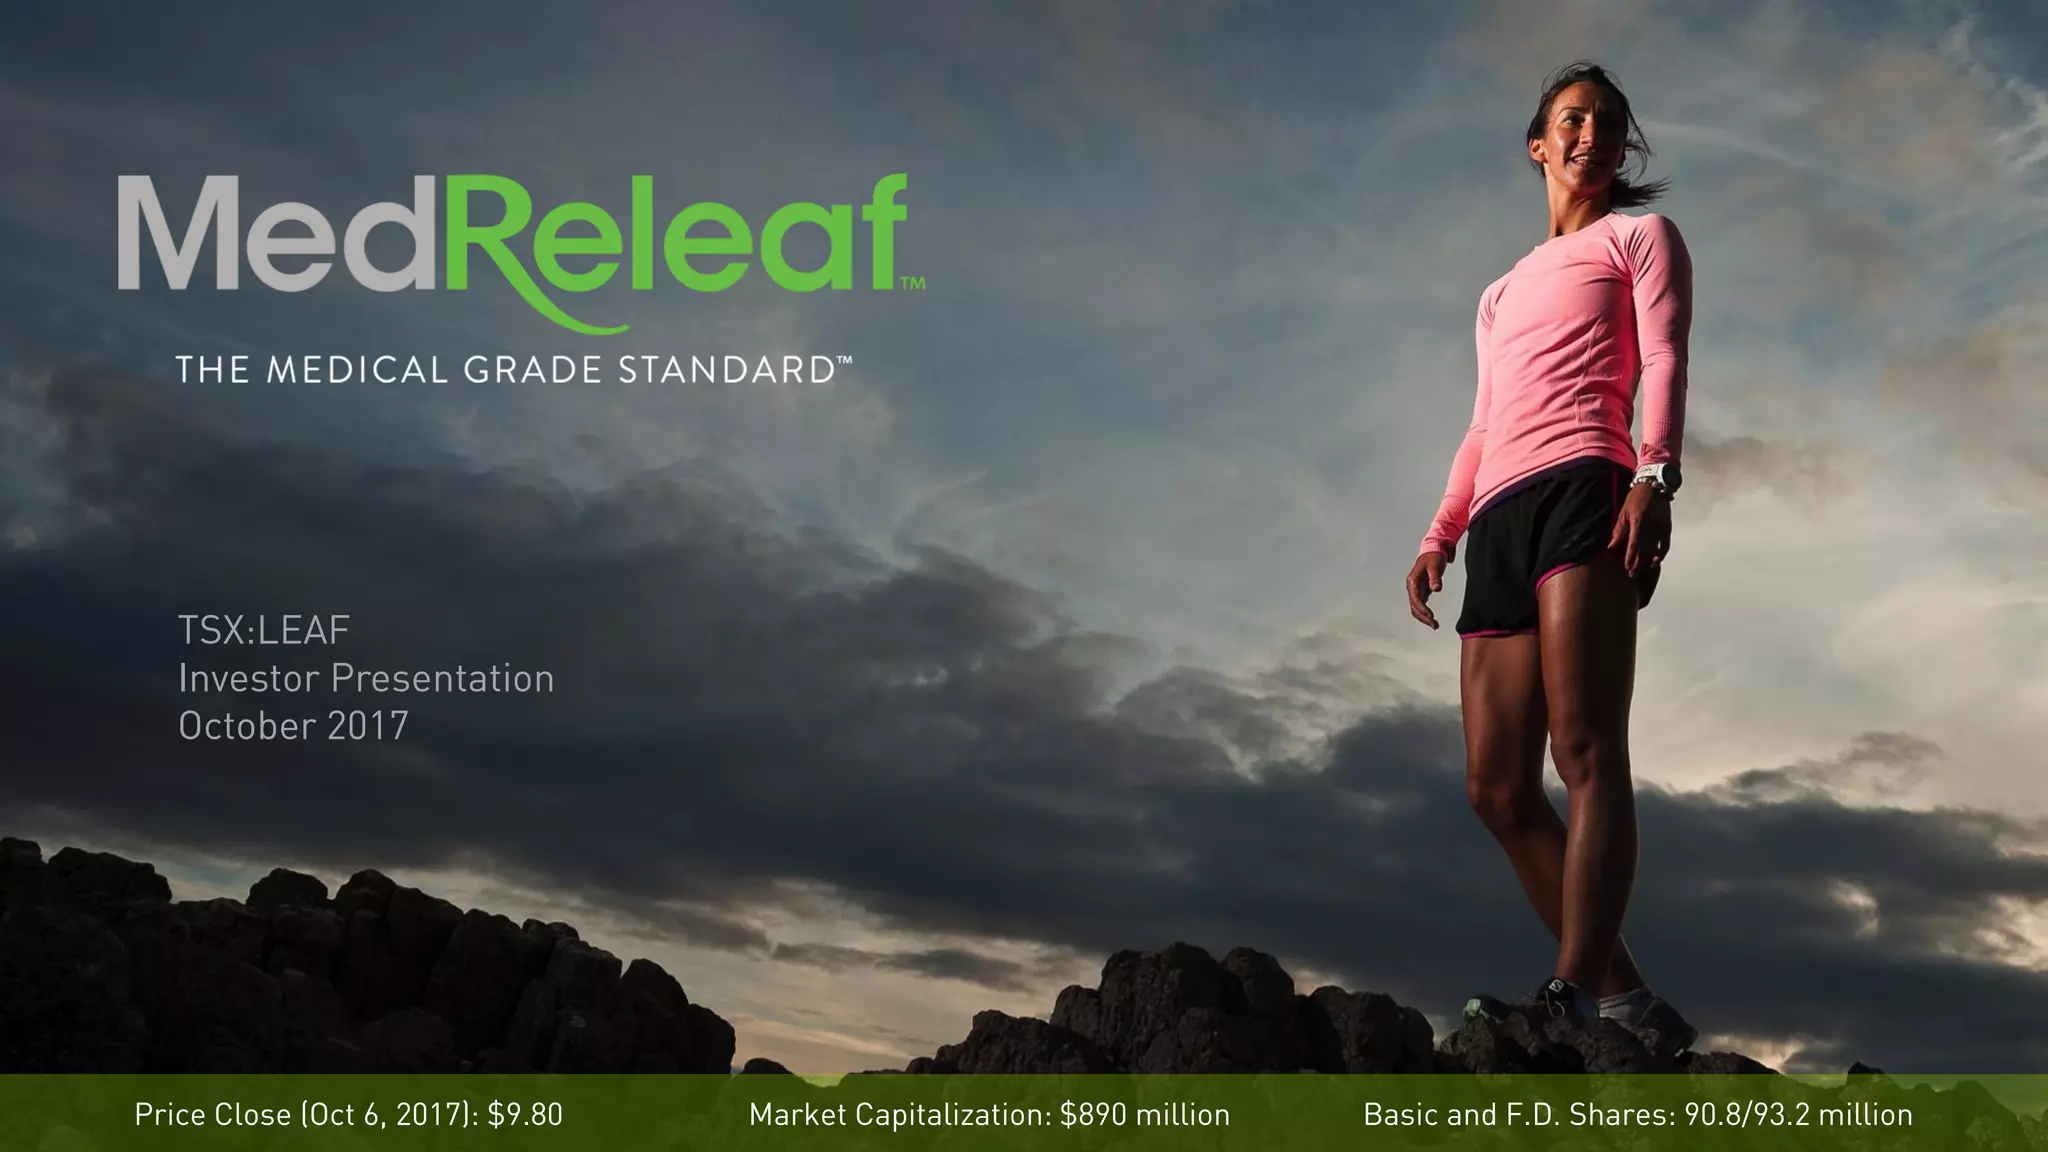
The cover slide establishes immediate financial credibility. It lists the TSX ticker (LEAF) and provides a 'Price Close' of $9.80 as of October 6, 2017. By including the market capitalization ($890 million) and the share count (90.8 million basic / 93.2 million fully diluted) directly on the front page, MedReleaf signals that it is a transparent, publicly-traded entity rather than a speculative startup. The tagline 'The Medical Grade Standard' sets the thematic tone for the rest of the presentation.
Slide 4: Market Share Dominance
Slide 4 is perhaps the most critical slide for establishing the company's 'moat.' It shows that MedReleaf captured 18% of the Canadian medical dried cannabis market for the year ending June 2017. The visual contrast is stark: while there were 64 licenses held by various producers, MedReleaf alone accounted for nearly a fifth of the total volume sold. This slide effectively argues that despite a crowded regulatory field, the market was already consolidating around a few top-tier players.
Slide 7: Profitability and Consumption Metrics
This slide focuses on two distinct areas: financial growth and patient behavior. The bar chart for Adjusted EBITDA shows a significant jump from $4.6 million in F2016 to $13.9 million in F2017. However, it also shows a slight dip in Q1 F18 ($1.9M) compared to Q1 F17 ($3.5M), which the deck does not explicitly explain in the provided slides. The right side of the slide introduces a 'stickiness' metric: MedReleaf patients consume 1.35 grams per day, nearly double the national average of 0.75 grams. This is used to imply that MedReleaf’s 'medical grade' products are more effective or preferred by heavy users, driving higher LTV (Lifetime Value) per patient.
Slide 9: Business Overview
Slide 9 serves as a transition, featuring a high-resolution image of an indoor cultivation facility. While it contains no text other than the heading, the visual is intended to demonstrate the scale and cleanliness of their 'analytically-driven operations' mentioned earlier in the deck. It reinforces the 'medical grade' branding through the sterile, industrial appearance of the grow room.
Slide 13: Patient Centricity and Safety
Slide 13 addresses the 'how' behind their market share. The company highlights three pillars: Patient Safety (testing for 300+ pesticides), Product Development (1,000s of patient surveys), and Delivery (same-day shipping). The claim of 89% customer satisfaction is a strong social proof metric. By focusing on 'exclusive locking containers' and 'third-party testing,' MedReleaf distances itself from the recreational market and aligns itself with pharmaceutical standards.
Slide 16: Product Portfolio and Awards
This slide details the breadth of their offerings. With 20+ dried products and a growing list of oils and capsules, the company demonstrates it is not a one-strain operation. The inclusion of 'Proprietary genetics' and the 'Tikun Olam' partnership suggests a genetic moat that competitors cannot easily replicate. The right side of the slide lists several '1st place awards' from 2014 through 2016, providing external validation of their product quality across High-CBD, Sativa, and Indica categories.
Slide 19: The Shift to Extracts
Slide 19 highlights the company's evolution from a flower-based business to a value-added derivative business. The chart shows that extracts grew from 2.8% of sales in Q3 F17 to 14.3% in Q1 F18. This is a crucial 'margin expansion' story. Extracts like the Avidekel and Midnight capsules offer 'precise dosing,' which appeals to both physicians and patients who are uncomfortable with smoking. Being the 'first licensed producer in Canada with an oil-capsule product' is a key competitive claim used here.
Slide 22: Management and Governance
The final slide in this selection presents the leadership team. The bios are heavy on institutional experience: Neil Closner (Mount Sinai Hospital), Igor Gimelshtein (Birch Hill Equity Partners), and Darren Karasiuk (Deloitte). This is not a team of 'hobbyist growers' but a team of corporate and healthcare executives. The note that 'Management owns 7.1%' is included to show alignment with shareholders, though it is a relatively modest percentage for a founding team, likely reflecting the dilution required to reach an $890M market cap.
What MedReleaf Does Well
The deck is exceptionally disciplined in its focus on 'Medical Grade' standards. Every slide, from the pesticide testing to the clinical backgrounds of the management team, reinforces this single value proposition. They also do a great job of using 'National Average' benchmarks to make their own data look more impressive. Showing that their patients consume 1.8x more than the average is a clever way to signal product superiority without making unsubstantiated medical claims.
What is Missing from the Deck
While the deck is strong on historical performance, it lacks detailed forward-looking projections for the upcoming recreational legalization in Canada (which occurred in 2018). There is no mention of the cost per gram to produce, which is a standard metric for cannabis producers to demonstrate operational efficiency. Additionally, while they mention 'ongoing innovation,' there is no specific roadmap for new IP or international expansion beyond the Canadian market share they currently hold.
Founder Takeaways: What to Copy
Benchmark against the industry: If your metrics are better than the national or industry average, show the comparison side-by-side as MedReleaf did on Slide 7. · Quantify your 'Quality': Don't just say you have a good product. MedReleaf quantified it with '300+ pesticides tested' and '1,000s of patient surveys' (Slide 13). · Show the revenue mix shift: If you are moving from low-margin to high-margin products, use a chart like Slide 19 to show the percentage of sales growth in that new category. · Institutionalize your team: Highlight the non-industry experience of your team (e.g., healthcare, private equity) to prove you can handle the rigors of a regulated market.
Frequently asked questions
- What was MedReleaf's market position in 2017?
- According to Slide 4, MedReleaf held an 18% share of the Canadian medical dried cannabis market for the twelve-month period ending June 2017. At the time, there were 64 licenses held by producers, placing MedReleaf as a dominant player among a large field of competitors.
- How does MedReleaf justify its 'Medical Grade' branding?
- The company relies on clinical rigor and patient outcomes. Slide 13 highlights third-party testing for 300+ contaminants and thousands of completed patient surveys. Slide 16 showcases multiple '1st place awards' from the Canadian Cannabis Awards for Top High-CBD, Sativa, and Indica strains, reinforcing their quality claims.
- What do the financial trends indicate about their product mix?
- Slide 19 shows a rapid shift toward higher-value products. Extracts (oils and capsules) jumped from just 2.8% of sales in Q3 F17 to 14.3% in Q1 F18. This suggests the company was successfully migrating its customer base toward 'novel new products' which typically carry higher margins than dried flower.
- Is the management team experienced in the cannabis sector?
- The team combines cannabis-specific expertise with traditional institutional backgrounds. CEO Neil Closner was the Chairman of the Board of Cannabis Canada Association, while VP Strategy Darren Karasiuk previously led the cannabis practice at Deloitte. This mix was intended to provide both industry knowledge and corporate governance credibility (Slide 22).
- What is the significance of the consumption metrics on Slide 7?
- MedReleaf reports that its patients consume 1.35 grams per day compared to the national average of 0.75 grams. This 1.8x multiplier is used to demonstrate 'patient-centric' success, implying that their specific strains and medical-grade standards lead to higher utilization and, by extension, higher revenue per patient.