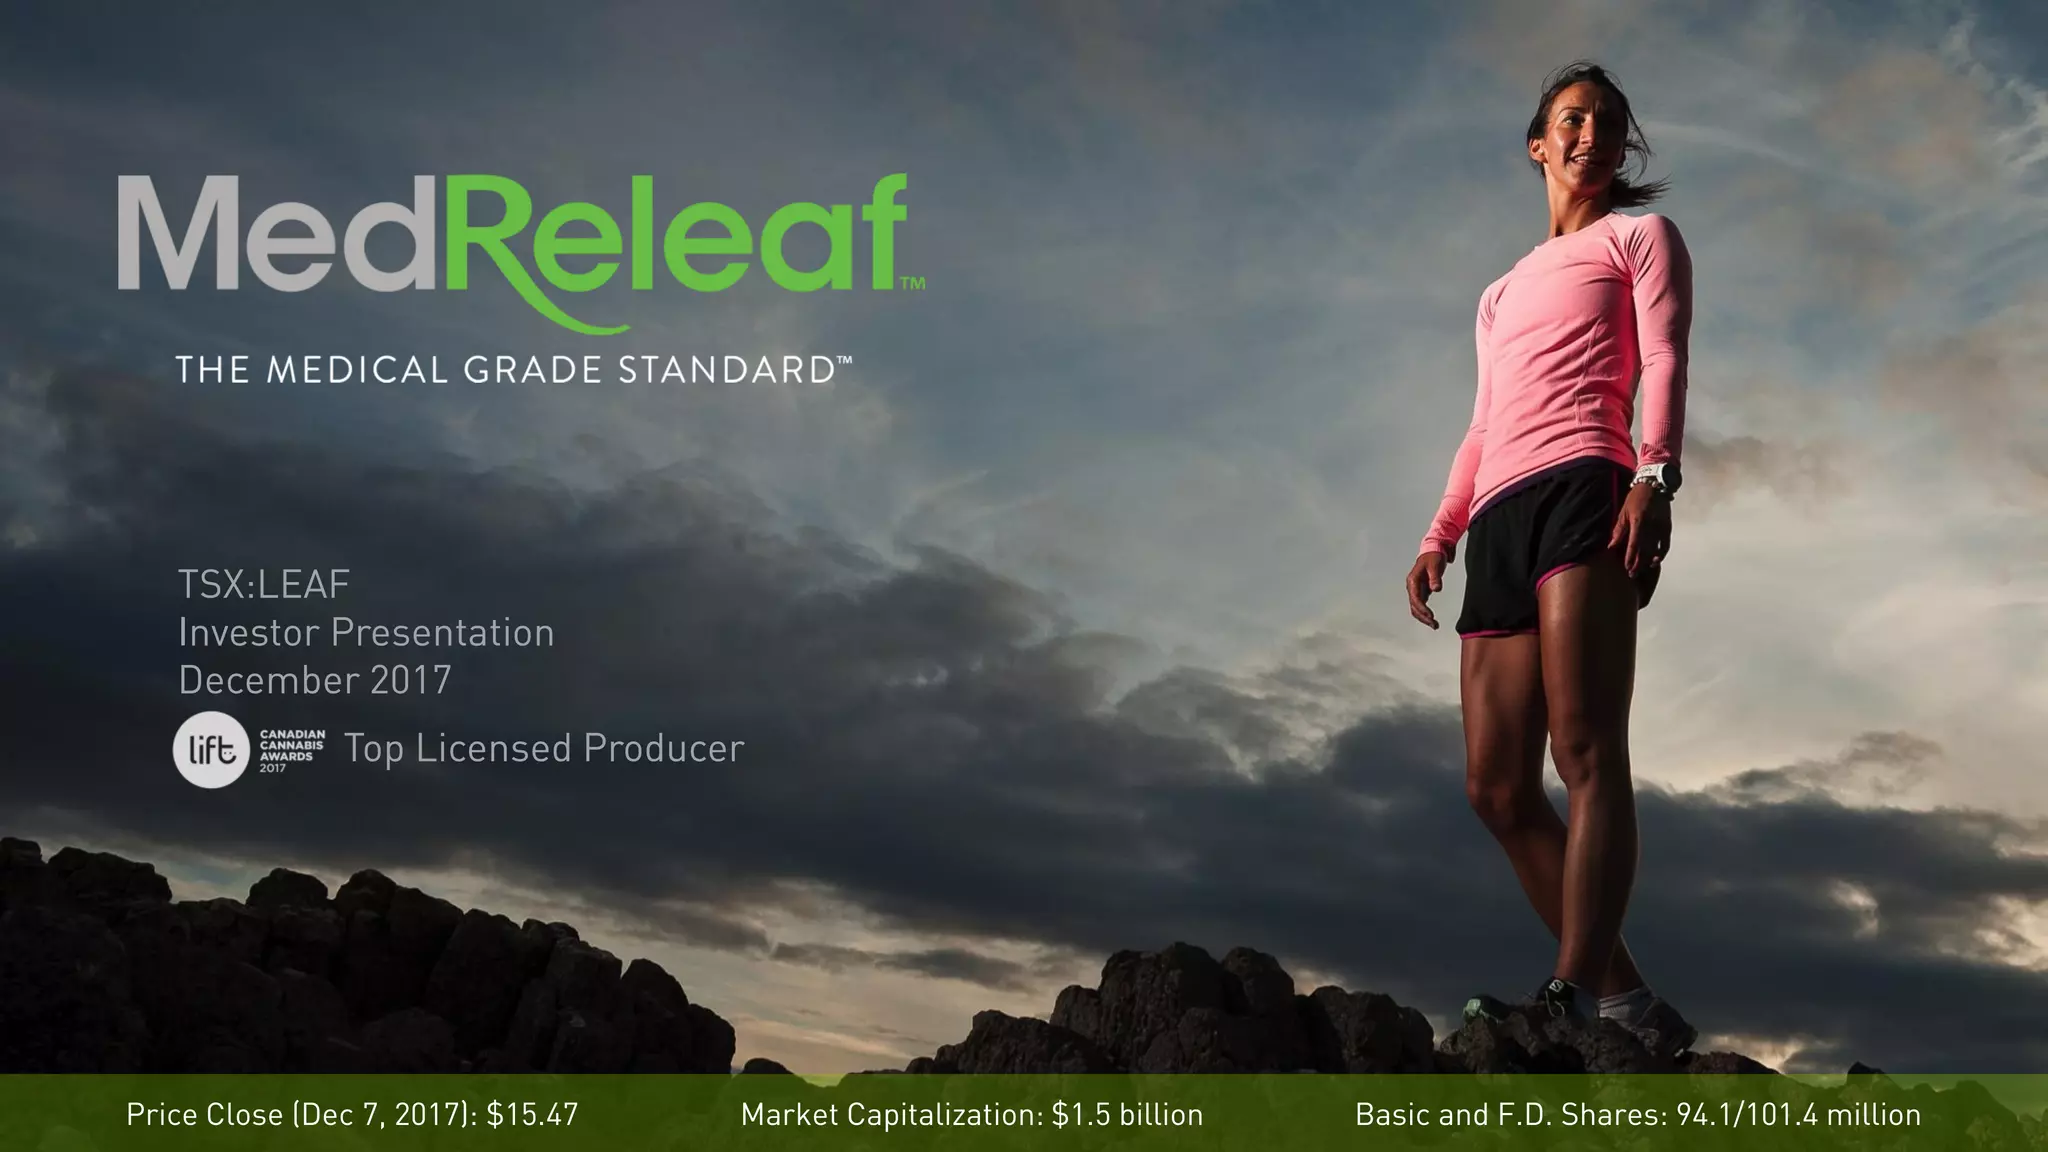
MedReleaf’s December 2017 investor presentation serves as a post-IPO update for a company then traded on the TSX under the ticker LEAF. The deck centers on three pillars: market dominance, superior patient outcomes, and financial discipline. At the time of the presentation, MedReleaf held an 18% share of the Canadian medical dried cannabis market despite the presence of 79 other licenses. The company differentiated itself through 'medical-grade' branding, reporting an average patient consumption rate of 1.35 grams per day—1.8x the national average. Financially, the deck highlights a shift tow…
Key takeaways
- MedReleaf reported a $1.5 billion market capitalization with a share price of $15.47 as of December 7, 2017 (Slide 1).
- The company captured 18% of the Canadian medical dried cannabis market share for the twelve months ending June 2017 (Slide 4).
- MedReleaf patients consume 1.35 grams per day, which is 1.8x the national average of 0.75 grams (Slide 7).
- Adjusted EBITDA reached $13.9 million in fiscal year 2017, though it showed a decrease in the first half of 2018 to $2.6 million (Slide 7).
- The product portfolio includes over 20 dried products, 6 oils, 4 capsules, and 1 topical cream (Slide 16).
- Extracts as a percentage of total sales grew significantly from 3% in Q3 F17 to 18% in Q2 F18 (Slide 19).
- The management team collectively owns 7.8% of the company based on 101.4 million fully diluted shares (Slide 22).
- The company emphasizes clinical rigor, noting that products are third-party tested for over 300 pesticides and contaminants (Slide 13).
Slide-by-Slide Analysis
Slide 1: Title and Market Snapshot
The cover slide establishes MedReleaf as 'The Medical Grade Standard.' It includes critical public market data as of December 7, 2017: a price close of $15.47 , a market capitalization of $1.5 billion , and a share count of 94.1 million basic (101.4 million fully diluted) . The imagery of an athlete suggests a focus on wellness and high-performance recovery, distancing the brand from recreational stereotypes. The inclusion of the 'Lift Canadian Cannabis Awards 2017' logo provides immediate third-party validation.
Slide 4: Market Share and Positioning
This slide uses a donut chart and a grid of icons to visualize MedReleaf's dominance. Despite there being 79 licenses in the market, MedReleaf claims 18% of the Canadian medical dried cannabis market share by volume for the period ending June 2017. The left-hand panel lists five core pillars: Quality assurance, Patient-centric approach, Analytically-driven operations, Ongoing innovation, and Producing premium cannabis. This slide effectively communicates that while the market is crowded, the company is a top-tier incumbent.
Slide 7: Profitability and Consumption Metrics
MedReleaf highlights its financial health with a bar chart showing Strong Adj. EBITDA Generation . The company grew from $4.6 million in F2016 to $13.9 million in F2017. However, the H1F18 figure of $2.6 million shows a significant drop compared to H1F17's $8.1 million , which is not explicitly explained on the slide. The right side of the slide introduces a 'stickiness' metric: MedReleaf patients consume 1.35 grams per day , which is 1.8x the national average of 0.75 grams. This suggests higher patient loyalty or more severe medical needs within their user base.
Slide 10: Business Overview Transition
This is a visual transition slide featuring a large-scale indoor cultivation facility. It reinforces the industrial scale of the operation, showing rows of cannabis plants under high-intensity lighting. It serves to separate the high-level financial summary from the operational details that follow.
Slide 13: Patient Centricity
This slide focuses on the 'Patient Centric' pillar. It lists three key areas: Patient Safety (third-party testing for 300+ pesticides), Product Development (1,000s of patient surveys), and Delivery (same-day shipping and GTA delivery). The slide claims an 89% customer satisfaction rate. The background image shows a staff member in a call-center environment, emphasizing the service-heavy nature of medical cannabis compared to retail.
Slide 16: Product Portfolio
The portfolio slide categorizes MedReleaf's offerings into four areas: Proprietary Genetics (Tikun Olam lines), Product Lines (20+ dried, 6 oil, 4 capsule, 1 topical), Awards (numerous 1st place finishes from 2014-2017), and Packaging . The visual layout uses green 'leaf' shapes to organize information, highlighting the breadth of their SKU count. This slide is intended to show that the company is not a one-product wonder but a diversified manufacturer.
Slide 19: Extract Growth
This slide focuses on the transition from flower to higher-margin extracts. It highlights that MedReleaf was the first licensed producer in Canada with an oil-capsule and topical cream. The bar chart shows that extracts grew from 3% of sales in Q3 F17 to 18% of sales in Q2 F18. This is a critical 'margin expansion' story for investors, as processed products typically command higher prices and better brand protection than raw flower.
Slide 22: Management Team
The final slide in this selection profiles six key executives. The team is heavy on institutional experience: Neil Closner (CEO) and Angelo Fefekos (VP Clinical Affairs) both come from Mount Sinai Hospital; Igor Gimelshtein (CFO) comes from private equity; Donald Courtney (COO) has CPG experience at Pepsi and Mars. A footer note states that Management owns 7.8% of the company, which indicates 'skin in the game' for a public company of this size.
What MedReleaf Does Well
MedReleaf excels at using comparative metrics to prove superiority. Instead of just stating they have many patients, they highlight that their patients consume 1.8x more than the national average. This implies a higher Lifetime Value (LTV) per customer. They also do an excellent job of clinical positioning . By emphasizing third-party testing for 300+ pesticides and their roots in hospital administration (Mount Sinai), they build a 'moat' of trust that is difficult for recreational-first brands to replicate.
The deck is also very effective at showing momentum in product mix . The jump from 3% to 18% in extract sales (Slide 19) tells a clear story of a company successfully evolving its business model toward higher-value products. This is exactly the kind of data public market analysts look for to justify a $1.5 billion valuation.
What is Missing from the Deck
As a public company presentation, the deck is naturally light on competitive threats . While it mentions 79 other licenses, it does not name competitors like Canopy Growth or Aurora Cannabis, nor does it address how it will maintain its 18% market share as those giants scale. There is also a lack of unit economics . While EBITDA is mentioned, the deck does not disclose the 'cost to produce per gram,' which was a primary metric for cannabis investors in 2017.
Furthermore, the decline in H1 2018 EBITDA (Slide 7) is presented without context. A proactive teardown of why profitability dipped—whether due to facility expansion or price compression—would have been beneficial for transparency. Finally, the deck does not address the upcoming legalization of recreational cannabis in Canada (which occurred in 2018), a massive market shift that was the primary topic of conversation in the industry at the time.
Founder Takeaways: What to Copy
Use Industry Benchmarks: Don't just show your numbers; show them relative to the national average. MedReleaf’s 1.8x consumption metric is the most memorable stat in the deck. · Validate with Awards: If you have won industry awards, dedicate a slide to them. It provides instant credibility and suggests your product quality is objectively superior to competitors. · Highlight Management Ownership: For later-stage companies, stating that management owns a significant percentage (7.8% in this case) reassures investors that the leadership's interests are aligned with shareholders. · Focus on Margin Expansion: If you are moving from a commodity product to a value-added product, show the percentage growth of that new category. Slide 19 is a masterclass in showing a successful pivot. · Professionalize the Aesthetic: The use of high-quality photography (the athlete on Slide 1, the lab environment on Slide 13) helps move the brand away from 'pot culture' and toward 'healthcare,' which was essential for their $1.5B valuation.
Frequently asked questions
- What was MedReleaf's market position at the time of this deck?
- MedReleaf was a leader in the Canadian medical cannabis space. According to slide 4, they held an 18% market share of total volume sold for the year ending June 2017. They were one of 79 license holders at the time, indicating significant consolidation of market power among the top producers. Their branding focused heavily on being the 'Medical Grade Standard.'
- How did MedReleaf differentiate its product from competitors?
- Differentiation was built on clinical quality and variety. Slide 13 highlights third-party testing for 300+ contaminants and a patient-centric approach that includes same-day delivery in the Greater Toronto Area (GTA). Slide 16 showcases a large portfolio of 20+ dried products and proprietary genetics through Tikun Olam, which helped them win multiple 'Top Licensed Producer' awards.
- What do the financial metrics reveal about their growth strategy?
- The strategy shifted toward high-margin, value-added products. Slide 19 shows that extracts (oils and capsules) grew from 3% to 18% of total sales in less than a year. While Adjusted EBITDA was $13.9 million in 2017, the H1 2018 figure of $2.6 million suggests increased spending on expansion or infrastructure during that period (Slide 7).
- Who were the key members of the management team?
- The team was led by CEO Neil Closner, who brought 20 years of healthcare and startup experience, including a role at Mount Sinai Hospital. Other key figures included CFO Igor Gimelshtein (ex-Birch Hill Equity Partners) and COO Donald Courtney (ex-Mars and Pepsi Canada). This mix of healthcare, finance, and CPG experience was designed to signal institutional-grade leadership (Slide 22).
- What is missing from this presentation compared to a typical startup deck?
- Because this is an investor presentation for a publicly traded company (TSX:LEAF), it lacks a 'Problem' slide or a 'Seed/Series A Ask.' It does not define a gap in the market because the company was already operational at scale. It also omits detailed future projections, likely due to regulatory restrictions on forward-looking statements for public entities.