Mentimeter’s 2014 pitch deck is a radical departure from traditional storytelling, opting for a hyper-compressed, metric-first approach. In just four slides, the company establishes a viral growth loop, demonstrates global enterprise adoption, defines a massive total addressable market, and proves a highly efficient 10x LTV to CAC ratio. By omitting the team, product features, and competition, Mentimeter forces the investor to focus on one undeniable fact: the business model is working. This deck serves as a template for startups with exceptional traction who want to signal confidence and eff…
Key takeaways
- Slide 1 establishes a viral loop between 'Presenters' and 'Voters' with 50,000 Daily Active Users.
- The company reports $420,000 in Annual Recurring Revenue (ARR) on Slide 2.
- Growth is stated as 14% Month-over-Month (MoM) as of the 2014 deck creation (Slide 2).
- Global validation is shown through logos like the Bill & Melinda Gates Foundation, Unilever, and Toyota (Slide 2).
- The deck identifies a target market of 500+ million presenters and events (Slide 3).
- Slide 3 segments the market into Events, Conferences, Education, Business Meetings, and Workshops.
- Unit economics are highly efficient with an LTV of $1,500 against a CAC of $150 (Slide 4).
- The deck completely omits a team slide, problem statement, and specific funding ask.
The 4-Slide Traction Teaser
The Mentimeter pitch deck from 2014 is an exercise in extreme brevity. While most founders struggle to condense their vision into 12 slides, Mentimeter managed to summarize a high-growth SaaS business in just four. This is not a comprehensive narrative; it is a data-driven punch to the face. The deck ignores the traditional 'Problem/Solution' framework and instead focuses on the 'Machine'—showing how users enter the system, how much they pay, and how fast the revenue is growing.
Slide 1: The Viral Engine
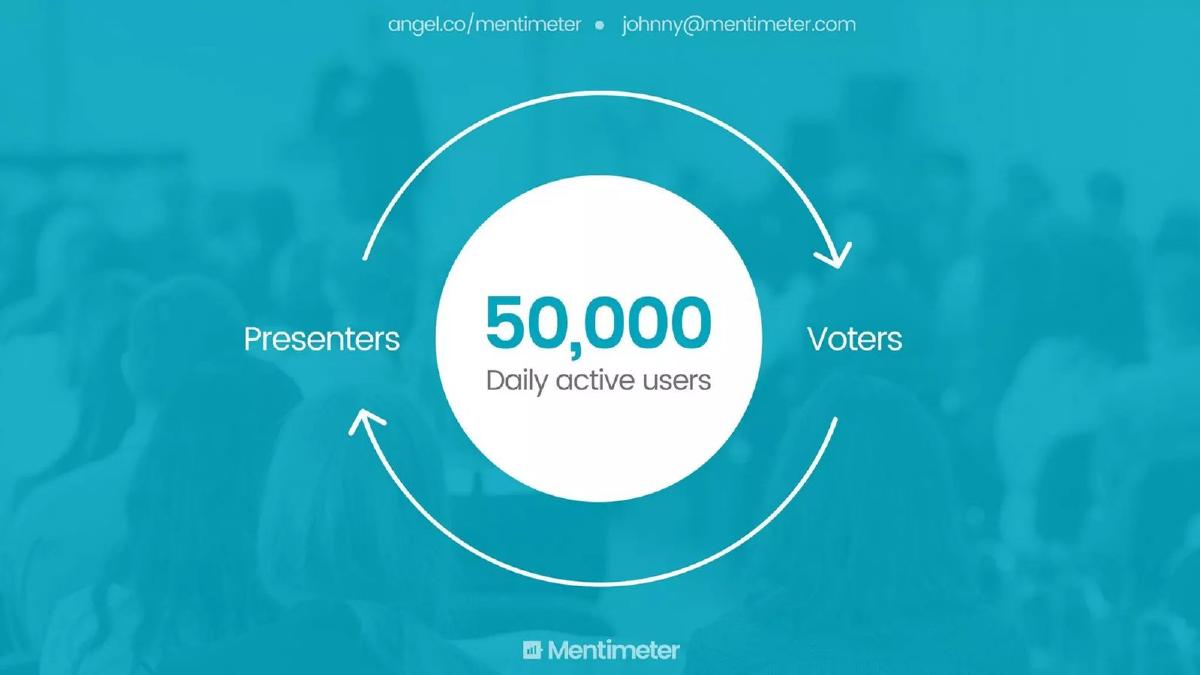
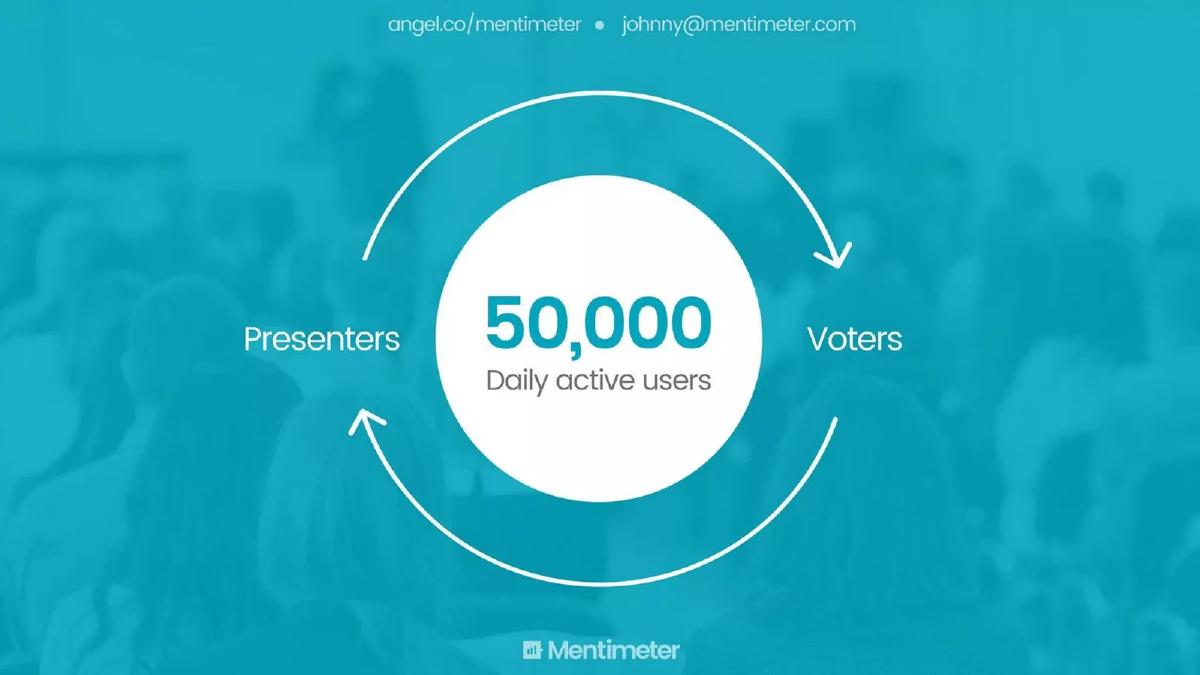
The first slide functions as both a title slide and a business model overview. It features the Mentimeter logo at the bottom and contact information (johnny@mentimeter.com and an AngelList link) at the top. The center of the slide is dominated by a white circle stating 50,000 Daily active users . Surrounding this circle is a diagram of a circular loop with two labels: Presenters and Voters .
This slide is critical because it explains the company's low customer acquisition cost (CAC) without using a single word of marketing jargon. It illustrates a product-led growth (PLG) model where presenters bring voters into the ecosystem, and those voters eventually become presenters. By leading with 50,000 DAUs, Mentimeter immediately establishes that they have achieved significant scale and product-market fit.
Slide 2: Revenue and Global Validation
Slide 2 shifts from user engagement to financial performance. The headline is a bold statement of traction: $420,000 ARR with a 14% growth MoM . In the world of early-stage startups, 14% month-over-month growth is the 'gold standard' that compounds into massive annual gains. This figure tells investors that the company is not just large, but accelerating.
The background of the slide features a dark world map with lines pointing to specific geographic locations, anchored by high-profile logos. These include the Bill & Melinda Gates Foundation (USA), Unilever (South America), Imperial College London (Europe), Toyota (Africa/Global), and Deloitte (Australia). By showing logos across five continents, Mentimeter proves that their solution is not a local niche product but a global enterprise tool. The diversity of the sectors—non-profit, consumer goods, education, automotive, and professional services—demonstrates the versatility of the platform.
Slide 3: Market Segmentation
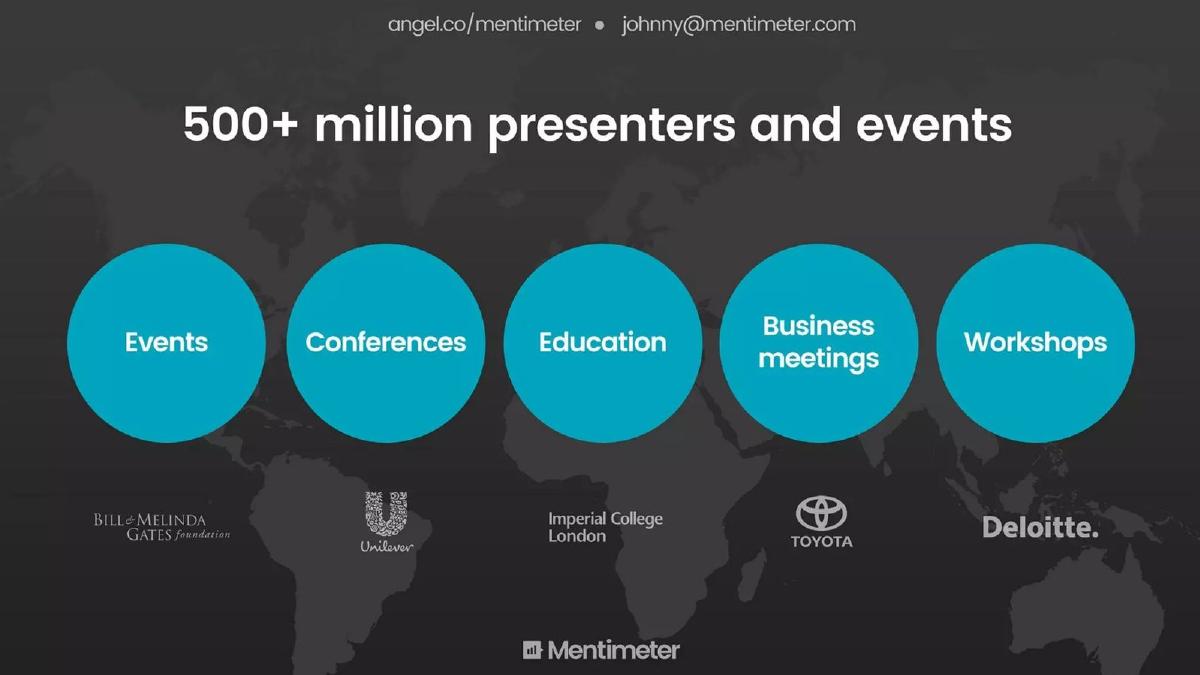
The third slide addresses the Total Addressable Market (TAM). The headline claims 500+ million presenters and events . Below this, five teal circles categorize the primary use cases for the software: Events , Conferences , Education , Business meetings , and Workshops . The global logos from the previous slide are repeated at the bottom to maintain the sense of credibility.
This slide serves to answer the investor question: 'How big can this get?' By identifying 'Business meetings' and 'Education' as core segments, Mentimeter moves beyond the limited 'event tech' space and into the much larger 'productivity and collaboration' space. The 500 million figure is a top-down estimate, but when paired with the 14% MoM growth from the previous slide, it becomes a believable target.
Slide 4: The Unit Economics
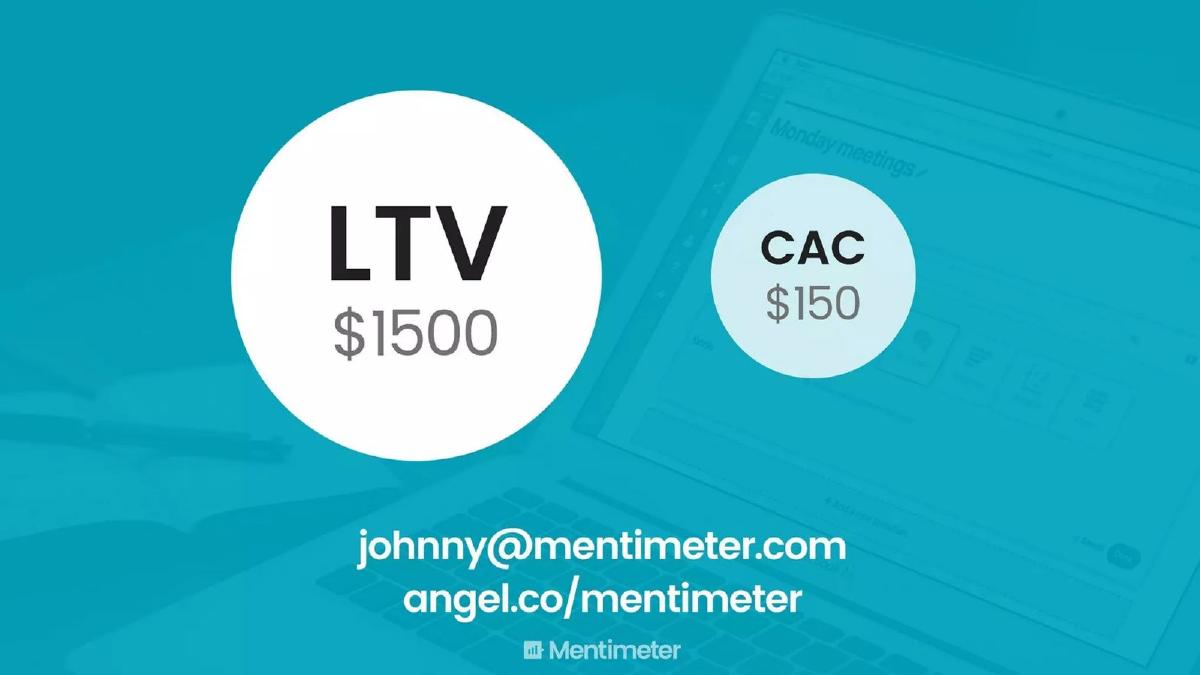
The final slide is perhaps the most important for a Series-stage investor. It presents two circles against a background image of a laptop running the Mentimeter software. The larger circle contains LTV $1500 (Lifetime Value), and the smaller circle contains CAC $150 (Customer Acquisition Cost). The contact information is repeated clearly in the center.
A 10x LTV/CAC ratio is extraordinary. In SaaS, anything above 3x is generally considered venture-scale. By showing that they can acquire a customer for $150 and generate $1,500 in value from them, Mentimeter is making a clear argument for capital infusion. They are essentially telling investors: 'If you give us $1, we can turn it into $10.' This is the ultimate 'closing' slide for a traction-heavy deck.
What Works in the Mentimeter Deck
The 10:1 Ratio: Highlighting the LTV/CAC ratio so prominently is a bold move that speaks directly to the math of venture capital. It removes the 'guesswork' from the investment thesis. · Global Social Proof: Using a world map to display logos like Deloitte and Unilever proves that the product has 'legs' across different cultures and corporate structures. · The Viral Loop Diagram: Slide 1 explains the entire marketing strategy in one simple graphic. It shows that the product grows itself, which justifies the low CAC. · Extreme Focus: By only including four slides, the founders ensure that the investor remembers the three most important things: high growth, global blue-chip customers, and incredible unit economics.
What is Missing from the Mentimeter Deck
The Team: There is no mention of the founders' backgrounds, previous exits, or technical expertise. While the metrics are strong, investors usually want to know who is steering the ship. · The Problem Statement: The deck assumes the investor already understands that presentations are boring and need interactivity. It skips the 'Why' and goes straight to the 'How Much.' · Product Features: There are no screenshots of the actual interface (other than a blurred background on Slide 4) or a list of features like 'live polling' or 'Q&A.' · The Ask: The deck does not state how much money they are looking to raise or what they plan to do with the funds (e.g., hiring, R&D, sales expansion). · Competition: There is no mention of incumbents like PowerPoint or competitors like Slido. The deck acts as if Mentimeter exists in a vacuum.
What a Founder Should Copy
The 'Metric-First' Approach: If your traction is your strongest asset, put it on every slide. Mentimeter doesn't hide their ARR in a small font; they make it the headline. · Visualizing the Growth Engine: Instead of saying 'we have viral growth,' draw the loop. Show how a user moves through your system. · Logo Geographic Mapping: If you have international customers, use a map. It visually communicates 'scale' much faster than a list of names. · The Teaser Format: Use this 4-slide style as a 'hook' to get a meeting. You don't need to tell the whole story in the first email; you just need to provide enough data to make it impossible for an investor to say no.
Frequently asked questions
- Why is the Mentimeter deck only four slides long?
- This is likely a 'teaser deck' or a high-level traction update rather than a full institutional pitch. By focusing only on the most impressive metrics—like the 10x LTV/CAC ratio and 14% MoM growth—Mentimeter creates a sense of inevitability. It is designed to secure a first meeting by proving the business model works, leaving the product details and team background for the actual conversation.
- What is the 'viral loop' mentioned on the first slide?
- The first slide shows a circular arrow connecting 'Presenters' to 'Voters.' This illustrates Mentimeter's core growth engine: every time a presenter uses the tool, they expose it to dozens or hundreds of 'voters' (the audience). Those voters then become potential presenters themselves. With 50,000 daily active users cited, this loop is the primary driver of their low $150 CAC.
- How does Mentimeter demonstrate market size without a TAM/SAM/SOM slide?
- On Slide 3, they simply state '500+ million presenters and events.' Instead of complex financial modeling, they use a broad, top-down number to indicate that their audience engagement tool is applicable to almost any professional or educational gathering. They further categorize this into five distinct verticals: Events, Conferences, Education, Business meetings, and Workshops.
- Is the lack of a team slide a mistake?
- In a standard seed or Series A deck, a team slide is mandatory. However, for a company already generating $420,000 ARR with 14% monthly growth, the 'proof' is in the performance. While unusual, omitting the team in a teaser deck shifts the focus entirely to the scalability of the software. It suggests the product is a 'machine' that works regardless of the specific individuals behind it.
- What do the unit economics on Slide 4 tell an investor?
- The 10:1 LTV to CAC ratio ($1,500 LTV / $150 CAC) is the 'hero metric' of the deck. For SaaS companies, a 3:1 ratio is considered good. A 10:1 ratio indicates an incredibly efficient acquisition model—likely driven by the viral loop shown on Slide 1—and suggests that if the company raises more capital, they can aggressively scale their marketing spend with high returns.