The Supermetrics Series B deck is a study in quantitative dominance. While many startups pitch on potential, Supermetrics pitched on realized efficiency, boasting a Rule of 40 score of 150+ and a 35% profit margin at a €21M ARR scale. The deck follows a traditional narrative arc—problem, solution, traction—but differentiates itself through social proof, citing 14,000+ paying customers and status as the #1 app in Google's marketplaces. By positioning themselves as a 'connector' rather than another platform to master, they addressed the common pain point of SaaS fatigue. The deck successfully t…
Key takeaways
- The company reported €21M ARR and a 35% profit margin on slide 8.
- Supermetrics achieved a Rule of 40 score of 150+, a rare metric for Series B startups, as shown on slide 9.
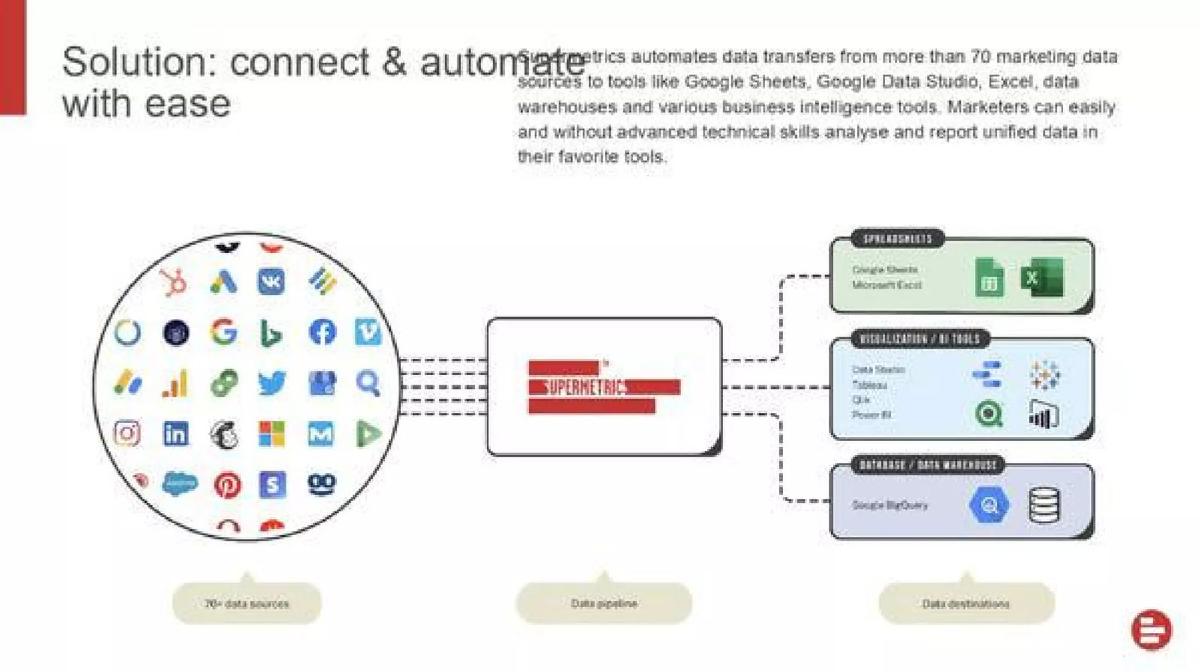
- The platform supports over 70 marketing data sources, connecting them to destinations like Google Sheets, Excel, and BigQuery (slide 4).
- Traction is evidenced by 14,000+ paying customers and over €28bn in ad spend processed (slide 8).
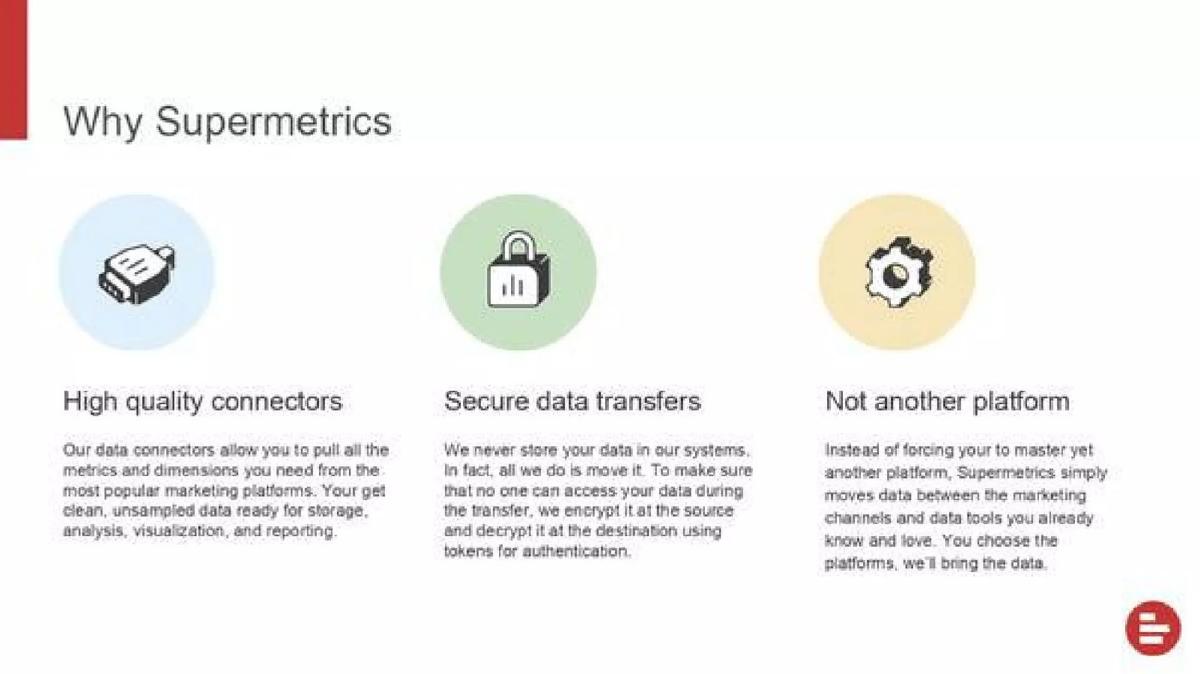
- The deck emphasizes a 'no-storage' model, stating they never store user data in their systems for security (slide 5).
- Product-led growth is highlighted by their status as the #1 app in Google's marketplaces by ratings and reviews (slide 12).
- The future roadmap focuses on expanding into data warehousing to help marketers manage larger historical datasets (slide 13).
- The leadership team includes former executives from Nokia, Meltwater, and MySQL (slide 14).
Introduction: The Efficiency Play
Supermetrics represents a rare breed of startup that reached significant scale with high capital efficiency. Founded in 2013, the company waited until it had reached massive milestones before seeking a Series B. This teardown examines the 14-slide deck used to raise $43.5 million, focusing on how they leveraged their 'Rule of 40' performance to attract top-tier investors.
Slide 1: Title and High-Level Metrics
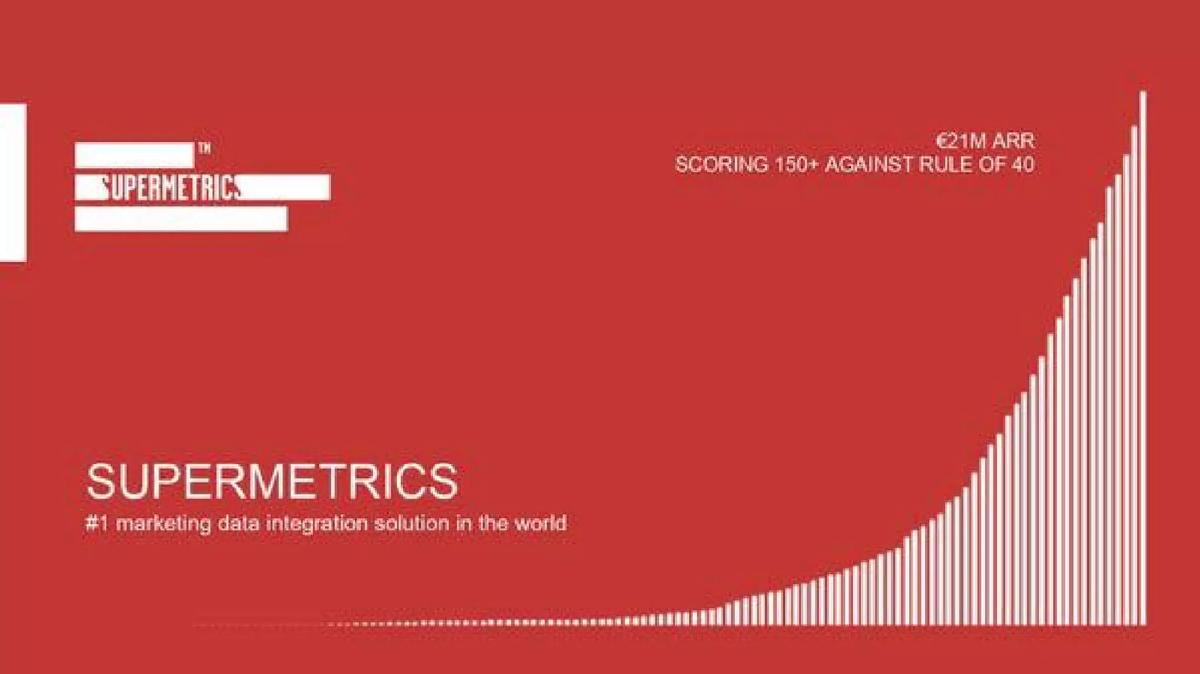
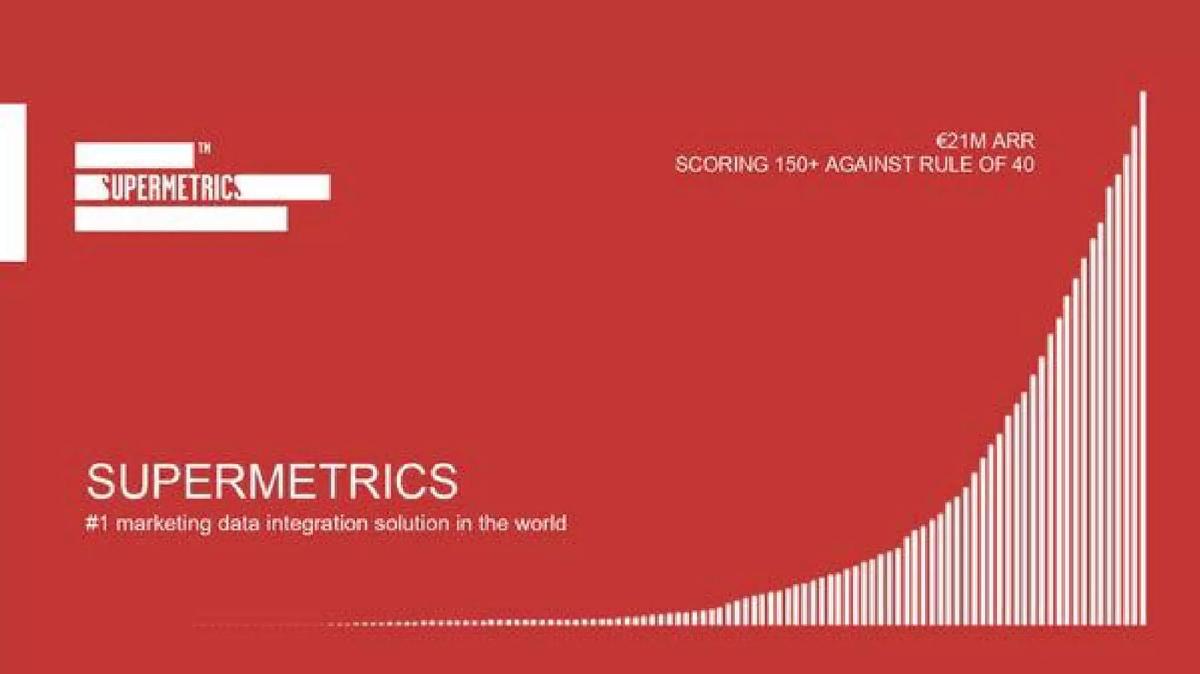
The cover slide does more than just state the company name. It immediately presents three critical data points: the company is the '#1 marketing data integration solution in the world,' it has reached '€21M ARR,' and it is 'scoring 150+ against Rule of 40.' The background features a bar chart showing exponential growth, setting a tone of undeniable momentum. By putting the ARR and Rule of 40 score on the first slide, Supermetrics signals that this is a performance-based pitch rather than a speculative one.
Slides 2-3: The Problem of Data Silos
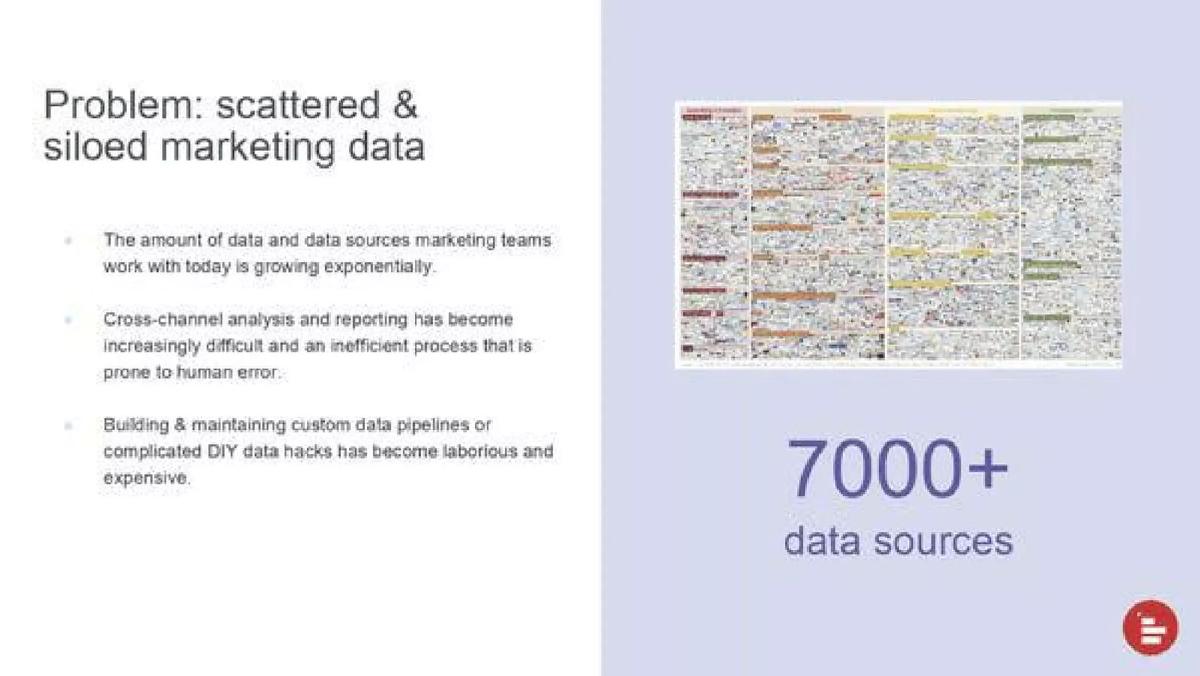
Slide 2 introduces the mission: 'Helping businesses grow with data.' It uses 3D character illustrations to humanize the technical product. Slide 3 defines the problem as 'scattered & siloed marketing data.' It notes that the number of data sources is growing exponentially and that building custom pipelines is 'laborious and expensive.' A graphic on the right mentions '7000+ data sources,' illustrating the chaos marketers face when trying to consolidate reporting.
Slides 4-6: The Solution and Value Proposition
Slide 4 provides a clear architectural diagram of the product. It shows 70+ data sources (Facebook, Google, LinkedIn, etc.) flowing through the Supermetrics 'Data pipeline' into three main destinations: Spreadsheets, Visualization/BI tools, and Databases/Data Warehouses. The text emphasizes that no 'advanced technical skills' are required. Slide 5, 'Why Supermetrics,' highlights three pillars: high-quality connectors, secure data transfers (emphasizing they do not store data), and the fact that they are 'not another platform,' but rather a tool that works within the user's existing workflow. Slide 6 reinforces the 'citizen data scientist' angle, claiming to put the power of data at everyone's fingertips.
Slides 7-8: Social Proof and Hard Traction
Slide 7 features four detailed testimonials from directors and managers at companies like Nestlé and VanMoof. Slide 8 is the 'money slide,' presenting five key metrics in circles: 2.2x YoY Growth, 14,000+ Paying customers, €28bn+ Ad Spend Processed, €21M ARR, and a 35% Profit margin. The combination of high growth (2.2x) and high profit (35%) is what leads to the 150+ Rule of 40 score mentioned earlier.
Slides 9-10: Growth Timeline and Product Portfolio
Slide 9 provides a historical chart of MRR from 2011 to 2020. It marks key milestones: the Excel launch, incorporation in 2013, the first employee in 2015, the Google Sheets launch, the OpenOcean investment in 2017, and the expansion to Atlanta and Vilnius. The chart shows a distinct 'hockey stick' curve starting around 2017. Slide 10 breaks down the product line into 'Spreadsheets & dashboards' (Google Sheets, Data Studio, Excel) and 'Data warehouses & business intelligence tools' (API, BigQuery).
Slides 11-12: Market Leadership
Slide 11 displays a 'wall of logos' including global brands like Dyson, L'Oréal, Canon, and Pfizer. Slide 12 cements their status as the 'recognized category leader,' showing 5-star ratings across G2, TrustRadius, and Capterra. It specifically notes they are the '#1 app in Google's marketplaces by ratings, reviews and number of users.'
Slides 13-14: Future Vision and Team
Slide 13, 'Next: Bringing data warehousing to marketers,' explains their roadmap. They aim to move beyond simple connectors into helping teams manage large historical datasets and break down final data silos. This justifies the need for Series B funding to build out more complex infrastructure. The final slide, 'Leadership team,' lists five executives. It highlights Mikael Thuneberg (CEO) as having built the tool to 'solve his own problem' and lists impressive 'Ex-' pedigrees for the rest of the team, including Nokia, MySQL, and Meltwater.
What Works in This Deck
Quantitative Dominance: The deck leads with ARR and the Rule of 40. For a Series B, investors are looking for a proven machine, and Supermetrics provides the numbers to prove their engine is both fast and efficient. Clear Architecture: The diagram on slide 4 makes a complex technical process (ETL) look simple and intuitive. Product-Led Growth Evidence: By citing their #1 ranking in the Google marketplace, they prove they have a low-cost acquisition channel that doesn't rely solely on expensive outbound sales. Security as a Feature: Explicitly stating they do not store data (slide 5) addresses a major enterprise procurement hurdle early in the deck.
What is Missing
The Ask: There is no slide detailing how much they are raising or how they intend to allocate the specific dollar amounts. Competitive Landscape: The deck assumes leadership but does not mention competitors like Fivetran or Funnel.io. Unit Economics: While they mention profit margin and ARR, they omit specific CAC (Customer Acquisition Cost) and LTV (Lifetime Value) figures, which are standard for Series B SaaS decks. Market Size (TAM): There is no slide addressing the total addressable market, perhaps because the €21M ARR and 14,000 customers already imply a massive opportunity.
What a Founder Should Copy
The Rule of 40 Highlight: If your business is profitable and growing, calculate your Rule of 40 score and put it front and center. It is the gold standard for SaaS health. The 'Not Another Platform' Positioning: Many founders try to build a 'destination' platform. Supermetrics wins by being a 'utility' that lives where the user already works. Copy this framing if your tool integrates with existing workflows. Milestone Mapping: The growth chart on slide 9 is excellent because it correlates revenue growth with specific product launches and hires, showing a clear cause-and-effect relationship between strategy and results.
Frequently asked questions
- What is the 'Rule of 40' mentioned in the deck?
- The Rule of 40 is a SaaS health metric stating that a company's combined growth rate and profit margin should exceed 40%. Supermetrics claimed a score of 150+ on slide 9, which indicates an exceptionally high-performing business that is growing rapidly while remaining highly profitable, a combination that is very attractive to Series B investors.
- How does Supermetrics handle data security?
- According to slide 5, Supermetrics utilizes a pass-through model. They state they 'never store your data in our systems' and instead move it directly from the source to the destination. They use encryption at the source and decryption at the destination using tokens for authentication, which reduces the security risk associated with third-party data storage.
- Who are the primary customers for Supermetrics?
- The deck targets marketing teams and 'citizen data scientists.' Slide 11 showcases a diverse enterprise client list including Nestlé, L'Oréal, Dyson, Warner Bros, and Pfizer. With 14,000+ paying customers, the company serves both large-scale enterprises and smaller data-driven businesses that use spreadsheets for reporting.
- What is the company's growth strategy according to the deck?
- The strategy is two-fold: maintaining dominance in the spreadsheet and dashboard connector market while expanding into data warehousing. Slide 13 explains that they are investing heavily in making data warehouses accessible to marketers, allowing them to break down final data silos and analyze larger historical datasets without technical friction.
- Does the deck include a financial ask or valuation?
- No, the 14-slide deck does not include a slide detailing the specific amount of capital being raised or the valuation sought. It focuses entirely on the business's performance, product capabilities, and market position. This is common in later-stage decks where the 'Ask' is often handled in private discussions or a separate term sheet.