The FlashRatings pitch deck is a study in minimalism, using just 11 slides to outline a massive market opportunity in the retail trading sector. By highlighting that only 10% of professional analyst research reaches retail investors, the company positions itself as a necessary bridge between Wall Street and Main Street. The deck showcases impressive early traction, including $200K ARR and 90k Monthly Active Users (MAUs) with a 40% month-over-month growth rate. While the deck excels at establishing the 'why now' and the team's pedigree, it is notably silent on the specific business model, unit…
Key takeaways
- The company identifies a target market of 60 million U.S. stock pickers on Slide 2.
- FlashRatings claims that while there are over 500 professional analysts, only 10% of their research reaches retail investors (Slide 5).
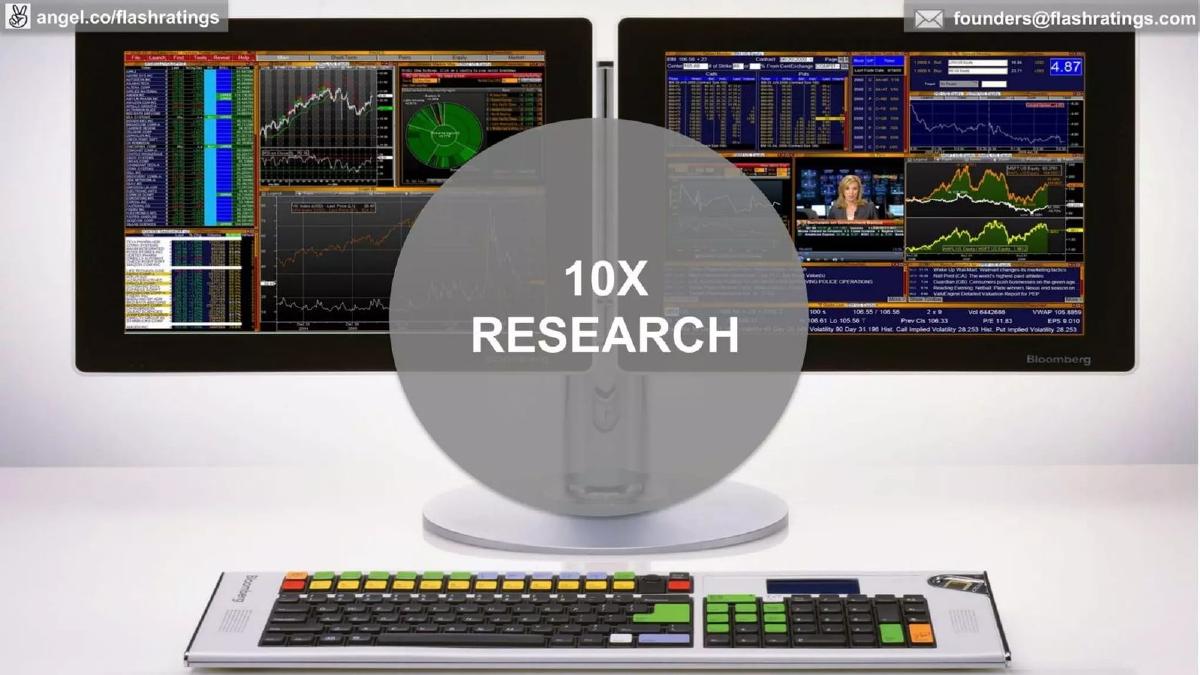
- The product aims to provide '10X Research' capabilities compared to traditional methods (Slide 6).
- The platform includes a 'Keeping Score' feature to track analyst accuracy (Slide 7).
- Traction is a high point, with the deck reporting $200K ARR and 90k MAUs on Slide 9.
- The company reports a 40% Month-over-Month (MoM) growth rate as of the deck's creation (Slide 9).
- The global opportunity is estimated at 400 million stock pickers today, growing to 1 billion in 10 years (Slide 10).
- The founding team features backgrounds from Columbia University, Stanford, Rocket Internet, and Skadden (Slide 11).
Introduction: The Democratization of Financial Data
FlashRatings emerged in 2014 during a period of rapid growth for retail brokerage platforms. This 11-slide deck is designed to convince investors that the 'retailization' of the stock market is a permanent trend and that these new investors require institutional-grade tools. The deck is characterized by extremely sparse text, large background images, and a focus on high-level market statistics.
The Market Opportunity (Slides 1-3)
Slide 1: Title Slide The deck opens with a lifestyle shot of a user holding a smartphone while relaxing outdoors. The tagline is "Empowering Retail Investors." The screen mockup shows analyst ratings for Apple (AAPL) from FBN Securities and Morgan Stanley, immediately establishing the product's core function: delivering professional stock ratings to mobile devices.
Slide 2: U.S. Stock Pickers The company identifies its primary market as 60 million U.S. stock pickers. The visual is a crowded stadium, emphasizing the sheer volume of individuals participating in the market. This is a classic Top-Down market sizing approach.
Slide 3: The Gambling Comparison Using the same "60M" figure and "U.S. stock pickers" header, the background shifts to a roulette wheel. This implies that without proper data, retail stock picking is akin to gambling. It sets the stage for FlashRatings to be the solution that turns 'gamblers' into 'investors.'
The Information Gap (Slides 4-5)
Slide 4: Professional Analysts The deck notes there are "500+ professional analysts." The background is a wide shot of the New York City skyline, symbolizing the institutional 'ivory tower' of Wall Street where this data currently resides.
Slide 5: The 10% Reach This is the 'Problem' slide. It states that "Only 10% reaches retail investors." By using a pie chart overlay on the NYC skyline, the founders highlight a massive inefficiency: 90% of professional financial intelligence is inaccessible to the 60 million people identified in Slide 2.
The Solution and Product (Slides 6-8)
Slide 6: 10X Research The background shows a Bloomberg Terminal, the industry standard for institutional research which costs tens of thousands of dollars per year. The text "10X RESEARCH" suggests that FlashRatings provides a significant leap in capability for the retail user, potentially offering a 'Bloomberg-lite' experience for a fraction of the cost.
Slide 7: Keeping Score One of the unique selling points mentioned is "KEEPING SCORE." In the world of financial analysts, accountability is often lacking. This slide suggests that FlashRatings tracks the performance of the analysts themselves, allowing users to see who is actually accurate and who is not.
Slide 8: Product Integration This slide brings the previous themes together: "10X RESEARCH," "EASY TO UNDERSTAND," and "KEEPING SCORE." A mobile mockup shows an Alibaba (BABA) stock page with an 18-analyst consensus, a 94% positive rating, and a median price target of $107. It demonstrates how complex data is distilled into a simple, actionable interface.
Traction and Scale (Slides 9-10)
Slide 9: Growing Fast This is the most important slide for a Seed round. FlashRatings displays three key metrics:
$200K ARR: Proving that users (or partners) are willing to pay for the service. · 90k MAUs: Showing significant top-of-funnel engagement. · 40% MoM: Indicating rapid month-over-month growth.
The background chart shows a revenue line crossing the $15k monthly mark in April, having started near zero in August of the previous year.
Slide 10: Global Ambition The deck pivots from the U.S. market to the global stage. It claims there are 400 million stock pickers today, with a projection of 1 billion in 10 years. This slide is intended to show the 'Exit Potential'—that this isn't just a niche tool, but a platform for a global demographic shift in how wealth is managed.
The Team (Slide 11)
Slide 11: Founders The final slide introduces the two founders, Justus and Puja. Rather than listing long resumes, the slide uses logos to convey authority:
Justus: Columbia University and Rocket Internet. Rocket Internet is known for aggressive execution and scaling, which balances the academic pedigree. · Puja: Stanford University and Skadden. The Skadden logo (a top-tier law firm) suggests a high level of professional rigor and perhaps a background in regulatory or corporate structures.
What Works in This Deck
1. Clarity of Vision: The deck is incredibly easy to follow. It identifies a large group of people (60M), a massive data gap (90% hidden), and a simple solution (mobile-first ratings).
2. Strong Traction: For a Seed stage company in 2014, $200K ARR and 90k MAUs are very strong numbers. The 40% MoM growth rate provides the 'FOMO' (Fear Of Missing Out) that investors look for.
3. Visual Storytelling: By contrasting the Bloomberg Terminal with a simple mobile app, the founders visually communicate the 'disruption' without needing paragraphs of text.
What Is Missing
1. The Business Model: While the deck mentions $200K ARR, it doesn't explain where that money comes from. Is it a B2C subscription? Is it B2B data licensing to brokerages? Is it an affiliate model? This is a significant omission.
2. Competitive Landscape: By 2014, companies like TipRanks and Estimize were already operating in this space. The deck doesn't explain why FlashRatings is better or different from these existing players.
3. The Ask: There is no slide stating how much money the company is raising, what the valuation cap is, or how the funds will be used. While sometimes omitted for legal reasons in public versions of decks, it is a crucial piece of the fundraising narrative.
What a Founder Should Copy
1. The 'Rule of Three' for Product: Slide 8 effectively uses three simple pillars (Research, Keeping Score, Easy to Understand) to define the product. Founders should avoid listing 20 features and focus on the 3 that matter.
2. High-Impact Traction Visuals: Slide 9 is a masterclass in presenting growth. Using large circles for the most impressive numbers ($200K ARR, 90k MAUs) makes them impossible to miss, even during a quick flip-through.
3. Pedigree by Association: If you have attended a top-tier school or worked at a famous firm, use the logos. The team slide (Slide 11) uses minimal text because the logos do the heavy lifting of establishing credibility.
Frequently asked questions
- What is the core problem FlashRatings is trying to solve?
- FlashRatings addresses the information asymmetry in the stock market. According to Slide 5, only 10% of professional analyst research currently reaches retail investors. The deck argues that the remaining 90% is locked behind expensive institutional terminals like Bloomberg, leaving 60 million U.S. stock pickers (Slide 2) with inferior data.
- How much revenue was the company making at the time of this deck?
- According to Slide 9, the company had reached an Annual Recurring Revenue (ARR) of $200,000. The same slide shows a growth trajectory starting from August, with a specific milestone of $15k monthly revenue noted around April.
- What are the key features of the FlashRatings product?
- The deck highlights three main value propositions: '10X Research' (Slide 6), 'Keeping Score' (Slide 7), and being 'Easy to Understand' (Slide 8). Visually, the product appears to be a mobile-optimized web platform that aggregates analyst upgrades, downgrades, and price targets into a clean, social-media-style feed.
- Who are the founders and what is their background?
- The founders are Justus and Puja. Justus brings experience from Columbia University and Rocket Internet, a well-known startup incubator. Puja has a background from Stanford University and Skadden, one of the world's most prestigious law firms. This combination suggests a mix of operational scaling and high-level professional services experience.
- What is missing from the FlashRatings pitch deck?
- The deck is missing several critical components: a clear 'Ask' (how much money they are raising), a detailed business model (how exactly they charge users), a competitive analysis (how they differ from TipRanks or Yahoo Finance), and unit economics (Customer Acquisition Cost vs. Lifetime Value).