The FlockData deck, presented at a Startup Pitch Night, positions the company as an open-source information management and data integration platform. Spanning 25 slides (with 9 provided for review), the presentation focuses heavily on technical architecture rather than traditional business metrics. The core value proposition centers on a 'multi-model' approach, integrating Graph, Search, and Document data structures through a single HTTP RESTful API. While the deck provides clear visual representations of data versioning and recommendation engine logic, it notably lacks standard fundraising c…
Key takeaways
- The company defines its core mission as 'Turning Data Into Information' through open-source management (Slide 1).
- FlockData advocates for a 'multi-model' approach as the essential key to handling modern and future data requirements (Slide 2).
- Technical integration is achieved via an HTTP RESTful API that feeds into Graph, Search, and Document models (Slide 3).
- The platform provides a unified access point for both storage and retrieval, simplifying the data stack for developers (Slide 4).
- A 'Versions of Data' feature allows users to perform 'What Difference Analysis' on JSON-based data changes (Slide 5).
- The deck highlights the utility of recommendation engines for up-selling, cross-selling, and conversion in e-commerce (Slide 7).
- Graph databases are explicitly cited as the foundational technology for high-performance recommendation systems (Slide 8).
- Data profiling tools are included to help users 'locate hot spots' and identify co-occurrence patterns for maximum impact (Slide 9).
Introduction: The Technical Product Pitch
The FlockData overview, sourced from a Startup Pitch Night, is a highly technical presentation that prioritizes architectural philosophy over business metrics. Spanning 25 slides in its full version, the nine slides analyzed here suggest a company deeply rooted in the open-source data infrastructure space. The deck's primary objective appears to be educating the audience on the necessity of 'multi-model' data management—a concept that was gaining significant traction in the mid-2010s as companies struggled with the limitations of traditional relational databases.
Slide 1: Title and Value Proposition
The opening slide introduces FlockData with the tagline 'Turning Data Into Information.' It explicitly identifies the product as 'Open-source information management and data integration.' The copyright footer indicates a timeframe of 2013-2015. The logo features a stylized bird composed of data points, reinforcing the 'Flock' branding. The three core pillars of the service are listed as 'COLLECT | CONNECT | COMPARE,' establishing a clear workflow for potential users.
Slide 2: The Multi-Model Thesis
Slide 2 serves as a transition or 'vision' slide. It contains a single sentence: 'Multi-model is the key to modern and future data.' This indicates that FlockData is positioning itself against 'single-model' databases (like standard SQL or pure Document stores). The company is betting that the future of data involves using the right tool for the right task within a single ecosystem.
Slide 3: High-Level Architecture
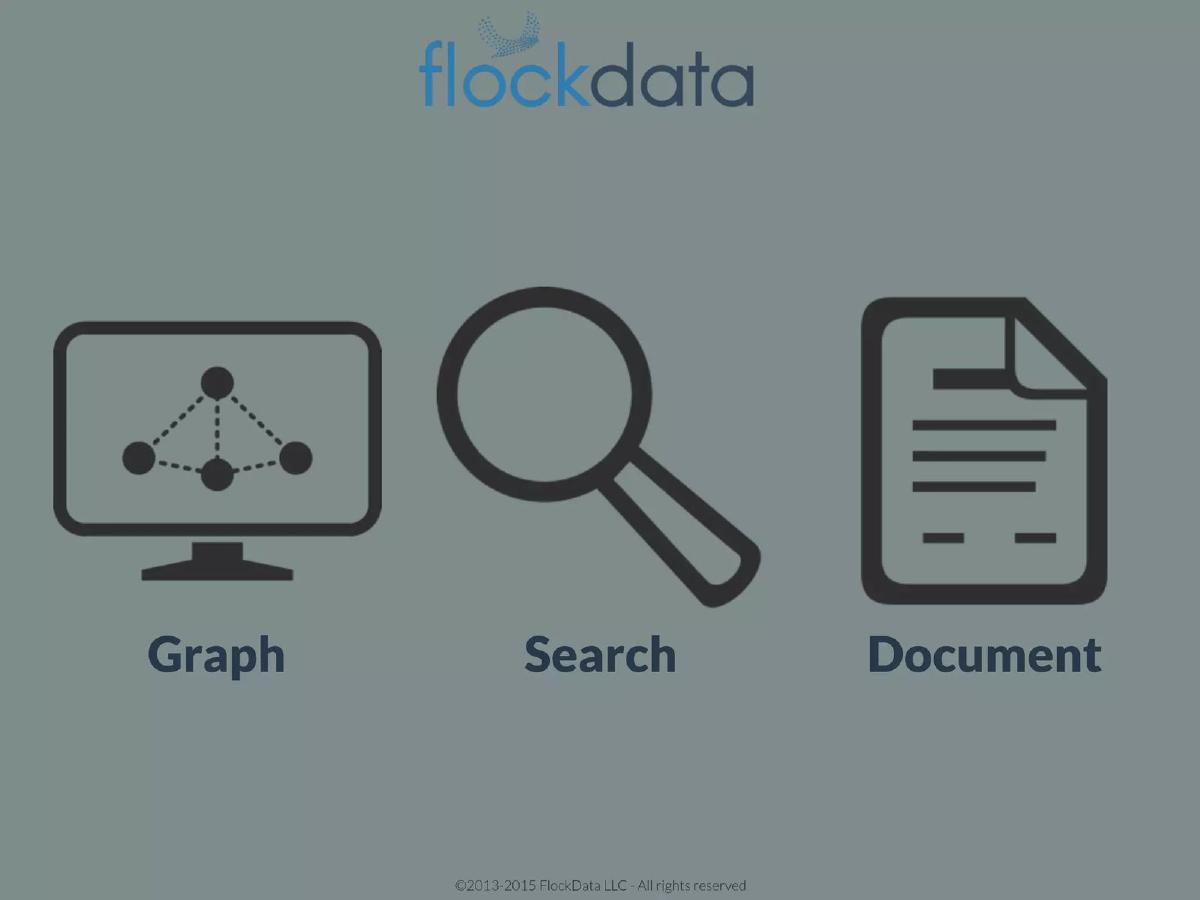
This slide provides the technical 'how.' It shows a flow chart where 'Any data source(s)' are integrated via an 'HTTP RESTful API.' This data is then processed through three distinct engines: Graph , Search , and Document . Below these engines are icons representing various outputs, including analytics dashboards, design tools, and organizational hierarchies. This slide is crucial because it defines FlockData not just as a database, but as a middleware layer that simplifies complex data routing.
Slide 4: The Unified Access Point
Reinforcing the previous slide, Slide 4 states that FlockData 'provides a single, unified multi-model access point for both data storage and information retrieval.' The emphasis here is on 'unified.' For a developer, this means they don't have to write separate code to store a document and link it in a graph; the platform handles the synchronization across models.
Slide 5: Data Versioning and Delta Analysis
Slide 5, titled 'Versions of Data,' moves into specific product features. It shows a screenshot of a user interface performing a 'What Difference Analysis.' The UI highlights changes in JSON data, such as a payment flag changing from 'Y' to 'N' or a date update. This suggests that FlockData includes built-in auditing and version control, which is a significant pain point in large-scale data integration projects.
Slide 6: The Recommendation Engine Pivot
Slide 6 acts as a section header for the 'Recommendation Engine.' The branding here includes a footer mentioning 'AuditBucket Pty Ltd & Entiviti LLC,' suggesting that FlockData may be a product born out of a partnership or a pivot from a previous entity called AuditBucket. The slide is minimalist, focusing the audience's attention on a specific use case for their multi-model technology.
Slide 7: E-commerce Use Cases
To ground the technical talk in business reality, Slide 7 asks, 'Why build a recommendation engine?' It uses an Amazon-style product page for 'Lashing Straps' to illustrate four key business drivers: Original search , Bought together (up-sell) , Also bought (up-sell) , Targeted ads (cross-sell) , and Also viewed (conversion) . This slide effectively communicates the 'why' behind the 'how,' showing that FlockData’s tech leads directly to increased revenue for retailers.
Slide 8: Validation via Case Study
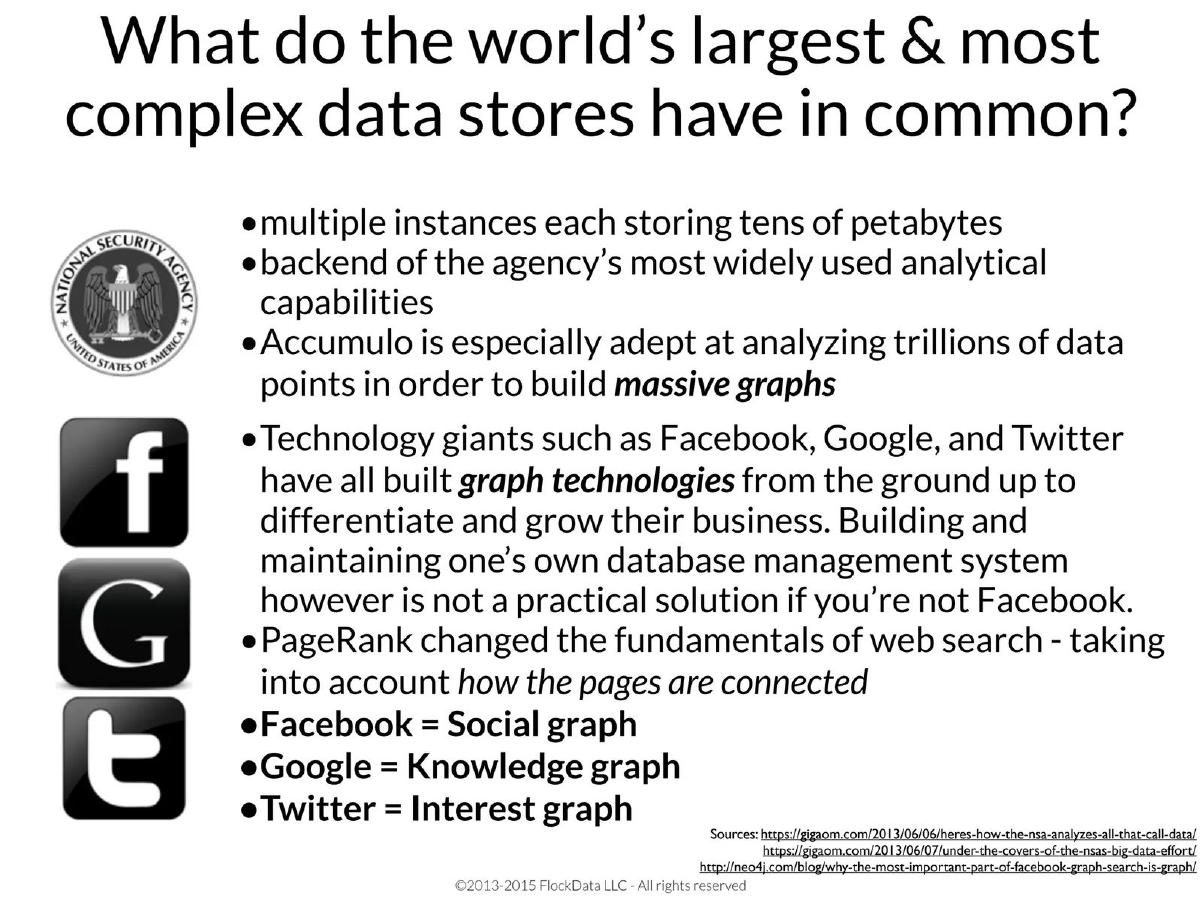
Slide 8 uses a third-party success story to validate FlockData's reliance on graph technology. It features a Neo4j case study titled 'Walmart uses Neo4j to give customers best web experience through relevant and personal recommendations.' By citing Walmart's $470 billion in annual revenue and their use of graph databases, FlockData is attempting to prove that their technical approach is 'enterprise-grade' and validated by the world's largest retailers.
Slide 9: Data Profiling and Hot Spots
The final slide in this set, 'Quick findings: Locate hot spots,' showcases the platform's analytical capabilities. It displays a circular chord diagram and a matrix chart. The text explains that 'FlockData data profiling during data load is used to drive reporting.' It specifically mentions that sorting data categories by 'co-occurrence' shows organizations where to focus for 'maximum impact.' This moves the product beyond simple storage and into the realm of actionable business intelligence.
What Works in the FlockData Deck
The deck excels at explaining a complex technical concept—multi-model data integration—through clear, simple diagrams. Slide 3 is particularly effective at showing the input-process-output flow of the platform. By using a RESTful API as the entry point, they signal to developers that the barrier to entry is low. Furthermore, the inclusion of Slide 7 (the Amazon example) is a smart move; it takes an abstract database concept and ties it to concrete business outcomes like 'up-sell' and 'conversion.' This helps non-technical investors understand the value proposition.
What is Missing from the FlockData Deck
As a 'Pitch Night' deck, this presentation is remarkably light on the 'business' of the startup. The most glaring omission is the Team Slide . In early-stage technical startups, the pedigree of the engineers and founders is often the most important factor for investors. There is also no Market Size (TAM/SAM/SOM) slide, which is standard for a fundraising pitch. We don't know how big the 'multi-model' market is or what share FlockData hopes to capture. Additionally, there is no Business Model slide. Since the product is described as 'open-source,' the deck should explain how they plan to make money—whether through a 'core-plus' model, managed hosting, or professional services. Finally, there is no Ask . We don't know how much money they are raising or what the milestones for that capital would be.
Founder's Takeaway: Technical vs. Business Balance
Founders should look at the FlockData deck as a masterclass in product explanation but a cautionary tale in investment storytelling . If you are presenting at a technical conference, this deck is excellent. However, for a pitch night where the goal is to secure a follow-up meeting with a VC, you must bridge the gap between 'how it works' and 'how it scales.' The use of the Walmart/Neo4j case study is a clever way to borrow authority, but it doesn't replace the need for FlockData's own traction metrics. If you have an open-source product, your deck must address the community growth, GitHub stars, or early pilot programs to prove that people actually want to use the 'unified access point' you've built.
Frequently asked questions
- What is the primary problem FlockData aims to solve?
- Based on the slides, FlockData addresses the fragmentation of modern data. By providing a 'single, unified multi-model access point' (Slide 4), it attempts to bridge the gap between different data storage types—specifically Graph, Search, and Document models—which usually require separate integrations and management tools.
- How does FlockData handle data integration?
- The platform utilizes an HTTP RESTful API to ingest data from 'any data source(s)' (Slide 3). This architectural choice suggests a focus on developer ease-of-use and compatibility with existing web-based infrastructures, allowing data to be funneled into three distinct processing models simultaneously.
- What specific features are highlighted for data analysis?
- The deck showcases a 'Versions of Data' interface (Slide 5) that tracks changes (deltas) in data fields like 'ACC_PAYMENT_FLAG' and 'TOTAL_ALLOCATED_AMOUNT.' It also features a data profiling tool (Slide 9) that uses matrix charts to show co-occurrence, helping organizations identify where to focus their efforts.
- Does the deck provide evidence of market demand?
- The deck uses a third-party case study rather than its own customer data to validate the market. Slide 8 features a Neo4j case study involving Walmart to prove that graph databases are the industry standard for web experiences and personal recommendations, implying FlockData's relevance by association.
- What is missing from this pitch deck that an investor would need?
- This is a product-centric deck. It lacks a 'Team' slide to verify founder expertise, a 'Market' slide to show the Total Addressable Market (TAM), a 'Business Model' slide explaining how they monetize open-source software, and a 'Traction' slide showing current user growth or revenue.