The Cedar Fair (NYSE: FUN) investor presentation from May 2016 serves as a masterclass in presenting a mature, asset-heavy business to public market investors. The deck focuses heavily on historical performance, citing six consecutive years of record results with 2015 revenue reaching $1,236 million and Adjusted EBITDA hitting $459 million. A key differentiator in this deck is the emphasis on tangible assets; the company highlights over 4,000 acres of owned real estate, including 1,300 acres of undeveloped land. By framing growth through the lens of 'FunForward 2.0'—which includes digital tec…
Key takeaways
- Total revenue grew consistently from $973 million in 2010 to $1,236 million in 2015 (Slide 5).
- Adjusted EBITDA saw a similar upward trajectory, rising from $359 million in 2010 to $459 million in 2015 (Slide 5).
- The company boasts a 17% compound annual total return to investors since its 1987 IPO (Slide 9).
- Cedar Fair manages a diverse portfolio where Cedar Point and Knott's Berry Farm are the largest contributors to revenue and EBITDA (Slide 5).
- Growth strategy 'FunForward 2.0' focuses on digital technology, including a CRM platform now in its fourth year (Slide 17).
- The company identifies over 1,300 acres of undeveloped land adjacent to its parks for potential hotel and retail development (Slide 21).
- A 2016 distribution of $3.30 per unit represented a yield of approximately 5.6% at the time of the presentation (Slide 25).
- The deck provides a granular breakdown of real estate holdings, showing that most park land is owned rather than leased (Slide 29).
Introduction and Market Positioning
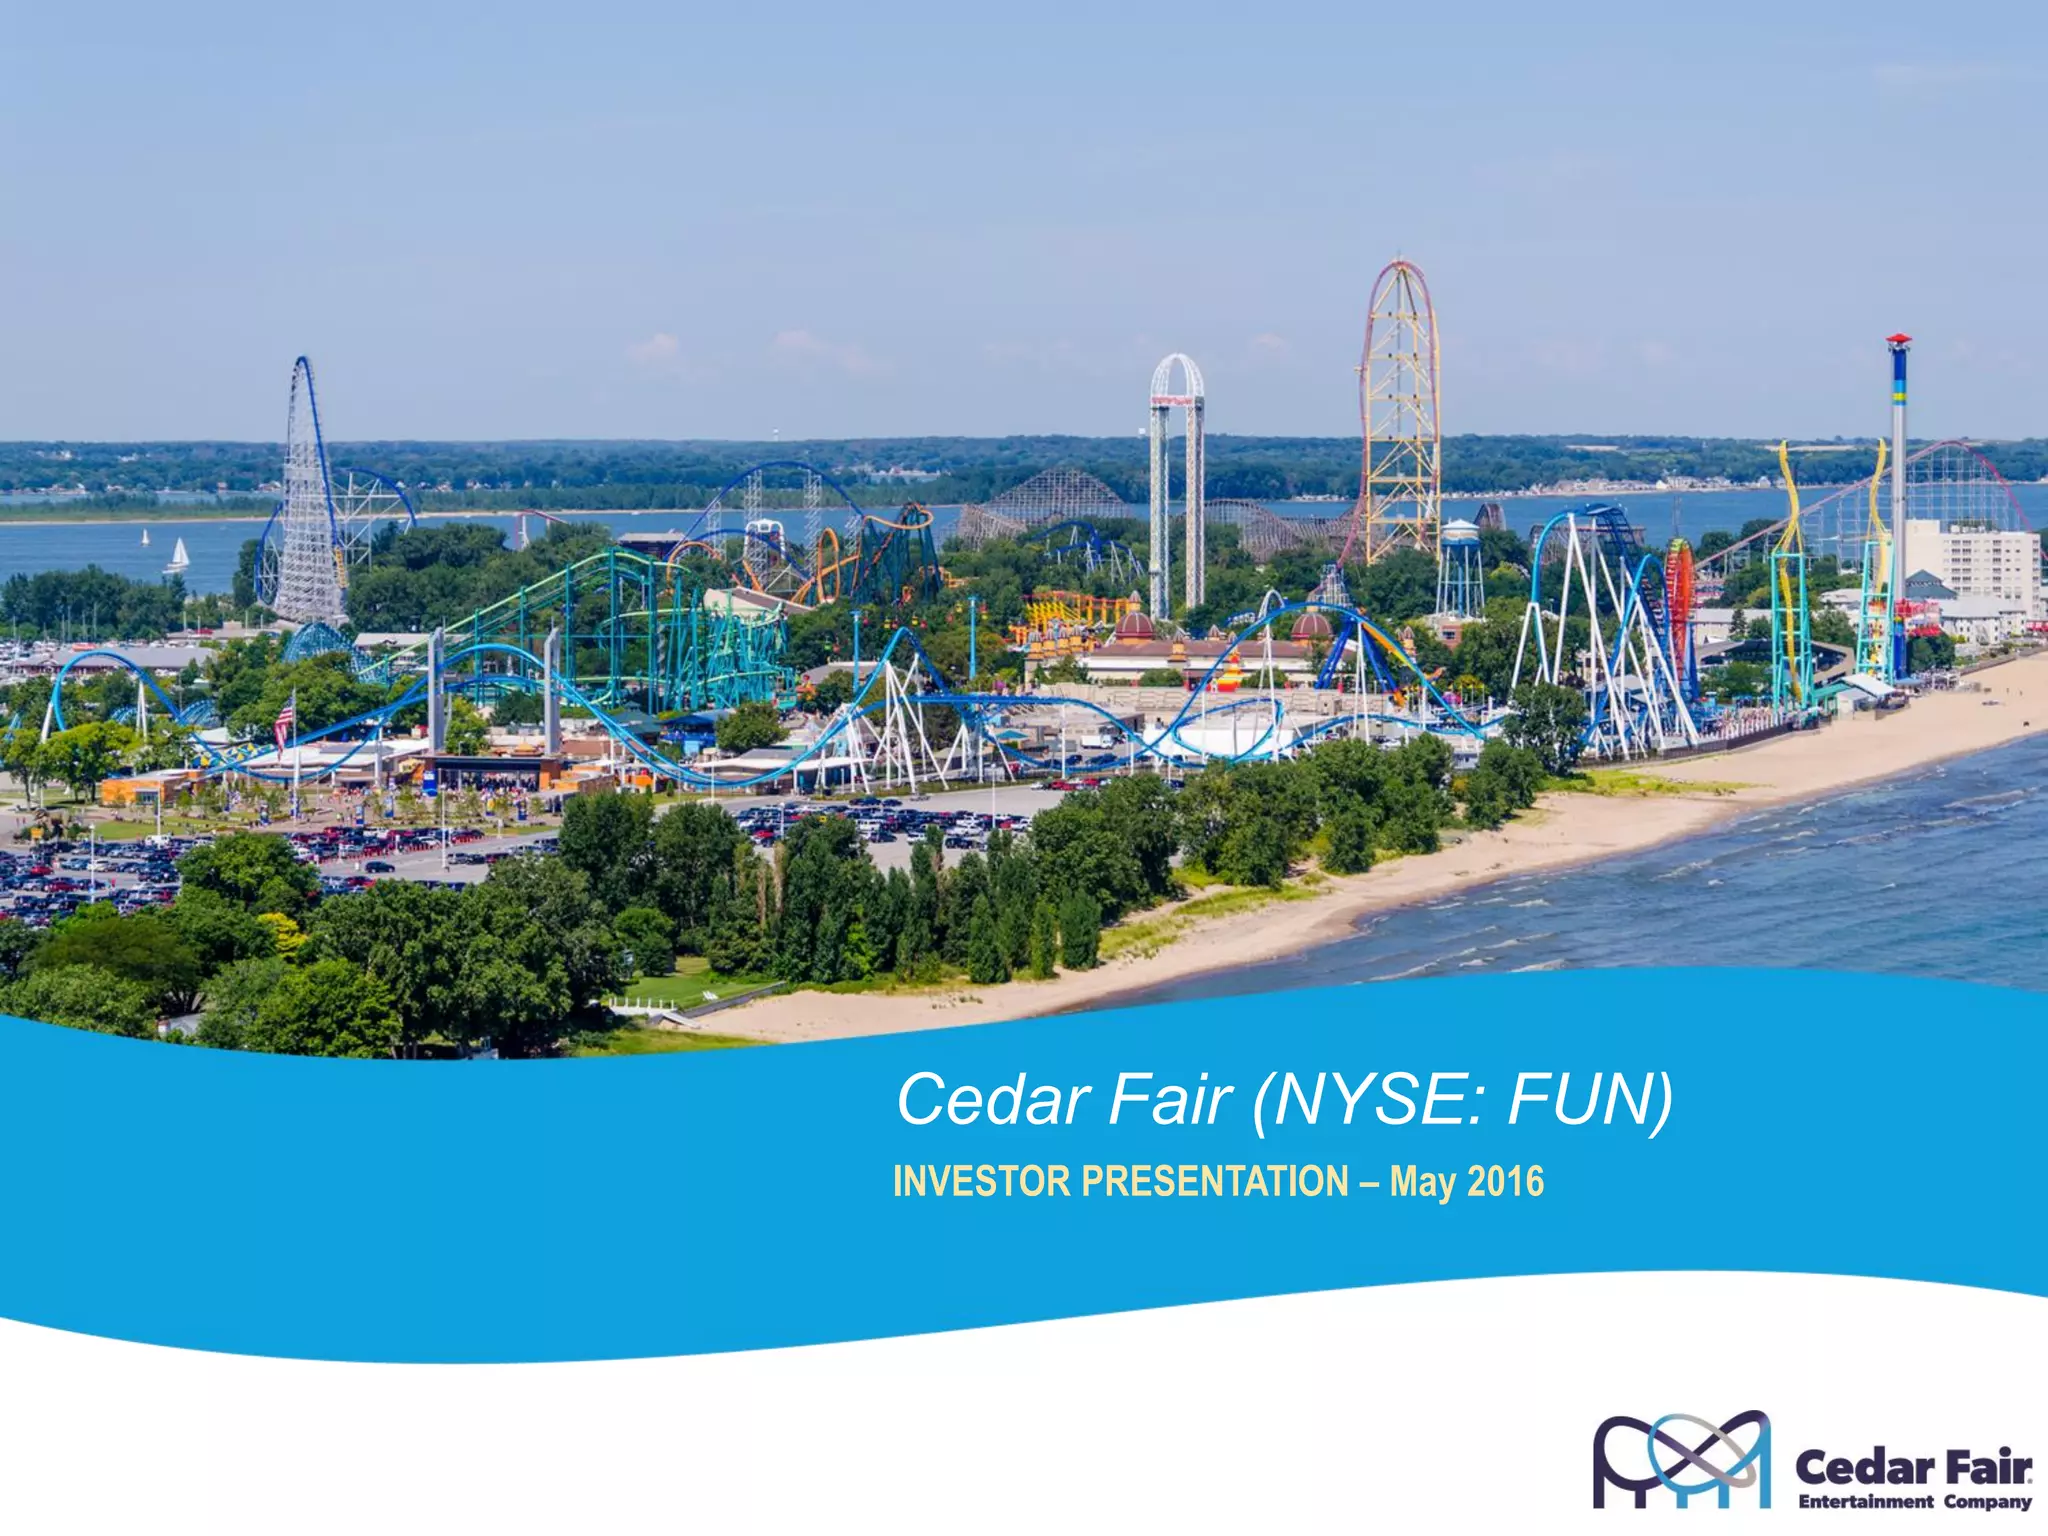
The Cedar Fair (NYSE: FUN) Investor Presentation from May 2016 is a comprehensive look at a major player in the regional amusement park industry. Unlike startup decks that focus on disruption and theoretical markets, this presentation is rooted in decades of operational history and tangible assets. The cover slide (Slide 1) immediately establishes the scale of the business with a panoramic view of Cedar Point, one of their flagship properties, and clearly identifies the company's ticker symbol, signaling its status as a publicly traded entity.
Slide 5: Financial Performance and Portfolio Composition
Slide 5, titled 'Our Sixth Consecutive Year of Record Results,' is the core of the company's financial validation. It features two primary line graphs showing a steady climb in both Total Revenue and Adjusted EBITDA from 2010 to 2015. Revenue grew from $973 million to $1,236 million, while Adjusted EBITDA rose from $359 million to $459 million. The use of line graphs here effectively demonstrates momentum and stability.
Below the growth charts, the slide uses pie charts to break down 2015 Revenue and Adjusted EBITDA by park. This is a critical transparency measure. It shows that while the company has a broad portfolio including Dorney Park, Carowinds, and California's Great America, the 'heavy hitters' are Cedar Point, Knott's Berry Farm, Canada's Wonderland, and Kings Island. This helps investors understand where the concentration of value lies within the 11-park system.
Slide 9: The Investment Thesis
Under the heading 'Why Invest in FUN?', Slide 9 provides a bulleted list of the company's value propositions. This slide is designed to de-risk the investment. Key points include a history of success through multiple economic cycles and the fact that revenues increased in 19 of the past 20 years. For a yield-focused investor, the mention of $2.1 billion in total distributions over 30 years and a 17% compound annual total return since the 1987 IPO are the most compelling metrics.
The slide also addresses financial health by stating there are 'No near-term financing or covenant concerns.' In the context of capital-intensive industries like amusement parks, this assurance of liquidity and debt management is essential for maintaining investor confidence.
Slide 13: Improving the Guest Experience
Moving into the 'FunForward 2.0' section, Slide 13 focuses on the guest experience. The company argues that its ability to drive pricing is directly tied to the quality of the experience. The strategy involves building 'highly marketable new rides and attractions built to scale' and expanding special event offerings. The goal is to extend the 'length-of-stay,' which naturally leads to higher guest spending levels. This slide connects the emotional aspect of the business (the 'Best Day' experience) to the cold logic of per-capita spending.
Slide 17: Digital Innovation and Data
Slide 17, 'Embracing Digital Technology,' shows how a traditional brick-and-mortar business attempts to modernize. The slide highlights the use of a CRM platform that, at the time of the deck, was in its fourth year. By leveraging historical guest data, Cedar Fair aims to improve capital efficiencies. The mention of 'FUNpix' and free park-wide Wi-Fi indicates a shift toward social media integration, recognizing that guest-generated content is a powerful, low-cost marketing tool.
Slide 21: Real Estate and Land Development
One of the most unique aspects of the Cedar Fair deck is its focus on land. Slide 21 highlights 'Developing Land Adjacent to Parks.' The company identifies more than 1,300 acres of undeveloped land. The strategy here is diversification: moving beyond just rides into hotels, cabins, and amateur youth sports facilities. This 'complementary commercial development' in retail and dining is presented as a way to drive incremental attendance without necessarily needing to build a new multi-million dollar roller coaster.
Slide 25: Cash Flow Allocation
Slide 25, 'Investment of Excess Cash Flow,' is a clear roadmap for how the company handles its profits. It uses a flow chart to show that excess cash is funneled into four areas: Investment in Growth, Distribution Increase, Unit Buyback, and Debt Repayment. The call-out box highlights a $3.30 per unit distribution for 2016, representing a 5.6% yield. This slide is a direct appeal to 'income investors' who prioritize steady, predictable payouts over high-risk capital appreciation.
Slide 29: Detailed Asset Breakdown
The Appendix (Slide 29) provides a granular table of 'Significant Real Estate Holdings.' It lists every major park, its location, the date it opened, the date it was acquired by Cedar Fair, and the acreage (both developed and developable). This level of detail is rare in startup decks but vital for a REIT-like entity or an asset-heavy corporation. It proves that the company owns the vast majority of its land (with the exception of Great America, which is noted as leased), providing a massive 'margin of safety' in the form of real estate value.
What Cedar Fair Does Well
The deck is exceptionally strong at demonstrating consistency and longevity . By showing 20-year revenue trends and 30-year distribution histories, they move the conversation away from quarterly volatility and toward long-term value. The visual representation of the park portfolio (Slide 5) and the detailed land audit (Slide 29) provide a sense of scale that words alone could not achieve. Furthermore, the 'FunForward 2.0' branding gives the impression of a forward-thinking management team that isn't just resting on its laurels but is actively seeking new ways to monetize its existing footprint through technology and land development.
What is Missing from the Deck
While the deck is thorough regarding financials and assets, it is notably light on competitive analysis . There is no mention of Six Flags, Disney, or Universal, nor how Cedar Fair's market share or per-capita spending compares to these industry peers. Additionally, while the deck mentions 'no near-term financing concerns,' it lacks a detailed debt maturity profile , which is usually a standard inclusion for companies with significant leverage. Finally, there is no team slide in the provided selection; for a multi-billion dollar entity, investors usually want to see the track record of the executive leadership team responsible for the 'FunForward' strategy.
Lessons for Founders
Founders can learn several key lessons from this presentation, even if they aren't running a billion-dollar amusement park empire:
Asset-Backing Matters: If your company has significant physical assets or intellectual property, quantify it. Cedar Fair's 4,000 acres of land is a powerful 'moat' that they highlight repeatedly. · Connect Strategy to Metrics: The deck doesn't just say they want to improve the guest experience; it explains that doing so allows them to 'drive pricing' and 'extend length-of-stay' (Slide 13). Every strategic initiative should have a corresponding financial outcome. · Use Historical Data to Prove Resilience: If you have survived a market downturn, say so. Cedar Fair's mention of success through 'multiple economic cycles' (Slide 9) is a major trust-builder. · Clear Capital Allocation: Investors want to know what happens to the money once the company is profitable. Slide 25's simple four-box model for excess cash flow is a perfect example of clear communication regarding corporate governance.
Frequently asked questions
- What is the primary financial focus of the Cedar Fair deck?
- The deck focuses on consistent growth and investor yield. It highlights six consecutive years of record revenue and EBITDA (Slide 5) and a 17% compound annual total return since 1987 (Slide 9). The 'Investment of Excess Cash Flow' slide (Slide 25) explicitly links business growth to distribution increases, making it clear that the company is managed for unitholder returns.
- How does Cedar Fair plan to use its undeveloped land?
- According to Slide 21, the company owns more than 1,300 acres of undeveloped land adjacent to its parks. The strategy involves developing this land into hotels, cabins, amateur youth sports facilities, and complementary commercial spaces like retail and dining to drive incremental attendance and extend guest stays.
- What role does technology play in their growth strategy?
- Slide 17 outlines the 'Embracing Digital Technology' pillar of their FunForward 2.0 strategy. This includes the FUNpix photo-sharing platform, new mobile apps, free park-wide Wi-Fi, and the utilization of four years of historical guest data from their CRM platform to enhance socialization and capital efficiencies.
- Which parks are the most significant to Cedar Fair's bottom line?
- Slide 5 provides a visual breakdown of revenue and EBITDA by park. While specific percentages aren't listed, the pie charts show that Cedar Point and Knott's Berry Farm are the two largest contributors, followed by Canada's Wonderland and Kings Island.
- What is the company's historical performance regarding distributions?
- Slide 9 states that Cedar Fair has paid $2.1 billion in total distributions to unitholders over a 30-year period. Slide 25 reinforces this by showing a 2016 distribution of $3.30 per unit, which provided a 5.6% yield, and commits to future distribution growth in line with business growth.