Rippling’s Series B deck is a high-conviction document that prioritizes business model integrity over visual flair. Raising $145M in 2020, the company used a 15-slide deck to argue that the future of SaaS isn't best-of-breed point solutions, but a 'compound' platform where HR, IT, and Finance share a single employee record. The deck is split into two distinct halves: a high-level strategic overview and a dense, template-based deep dive into SaaS metrics. By showing how revenue is distributed across multiple products and providing granular cohort retention data, Rippling demonstrated a level o…
Key takeaways
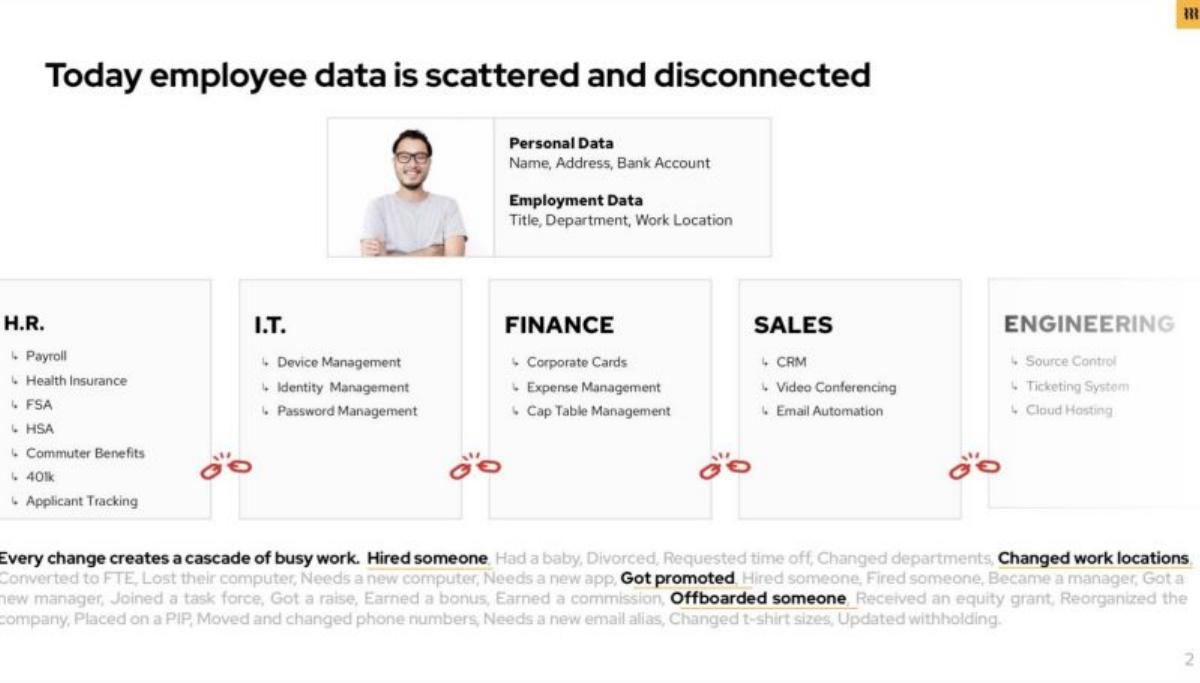
- The deck introduces the 'Compound Startup' thesis by showing how employee data is currently scattered across HR, IT, Finance, Sales, and Engineering (Slide 2).
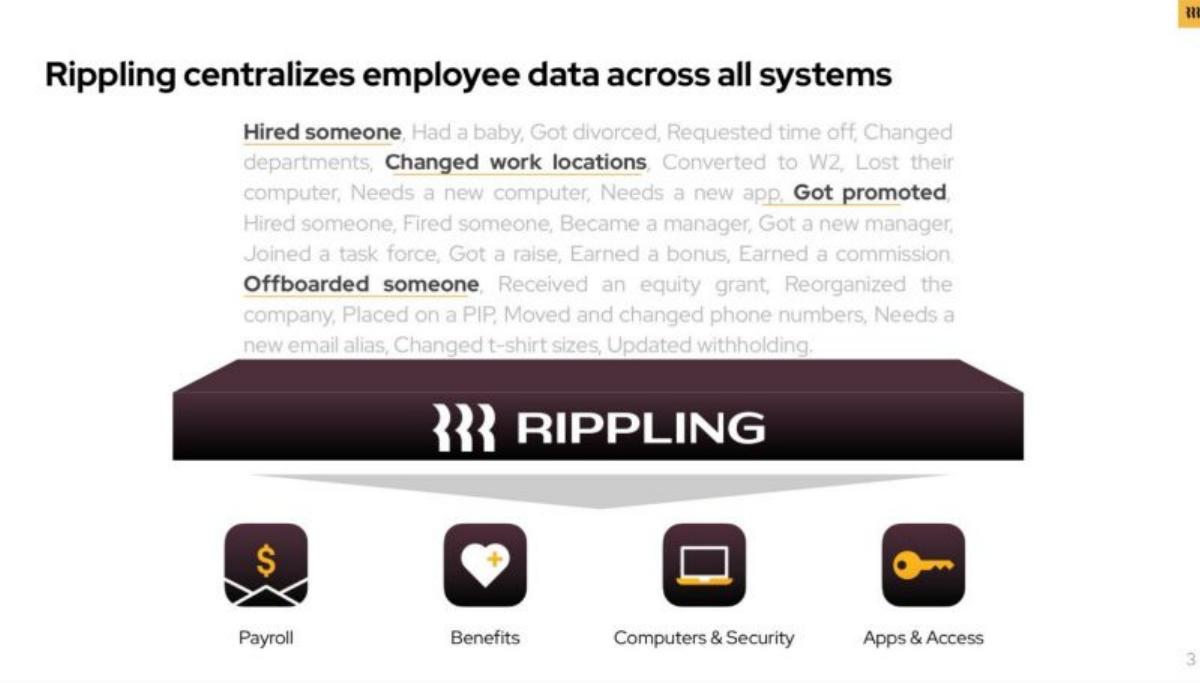
- Rippling visualizes its platform as a central layer that automates administrative tasks like hiring, promotions, and offboarding across four key pillars: Payroll, Benefits, Computers & Security, and Apps & Access (Slide 3).
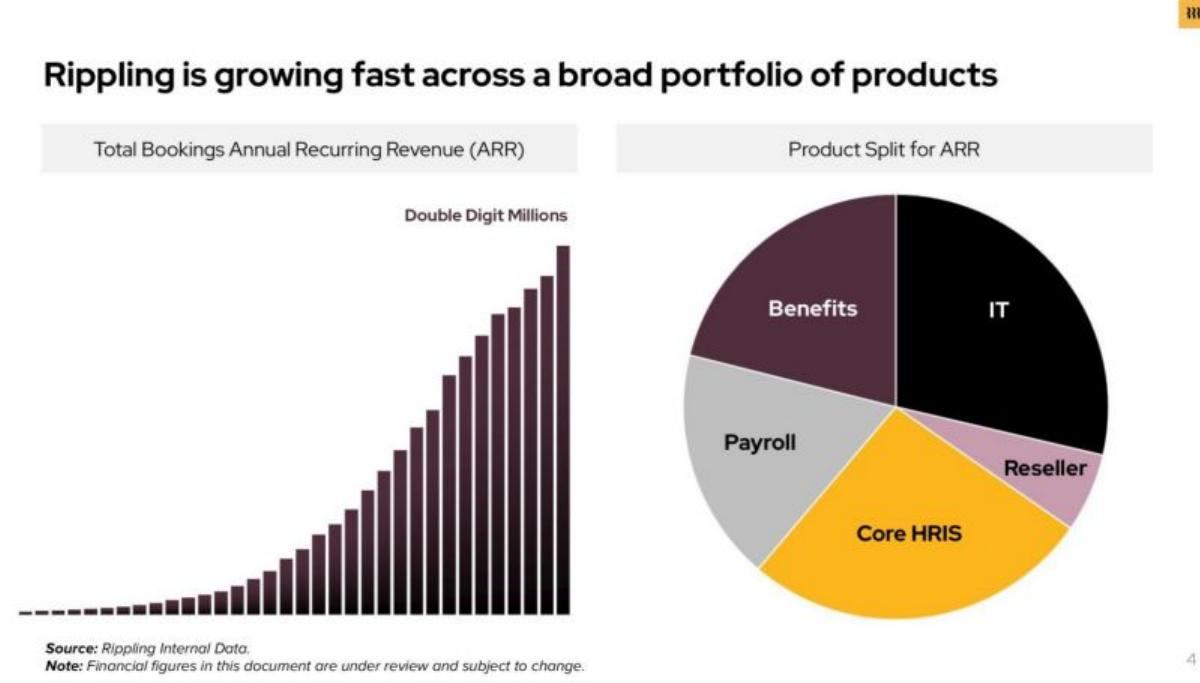
- The company reports its ARR growth as reaching 'Double Digit Millions' with a diversified product split including IT, Benefits, Payroll, and Core HRIS (Slide 4).
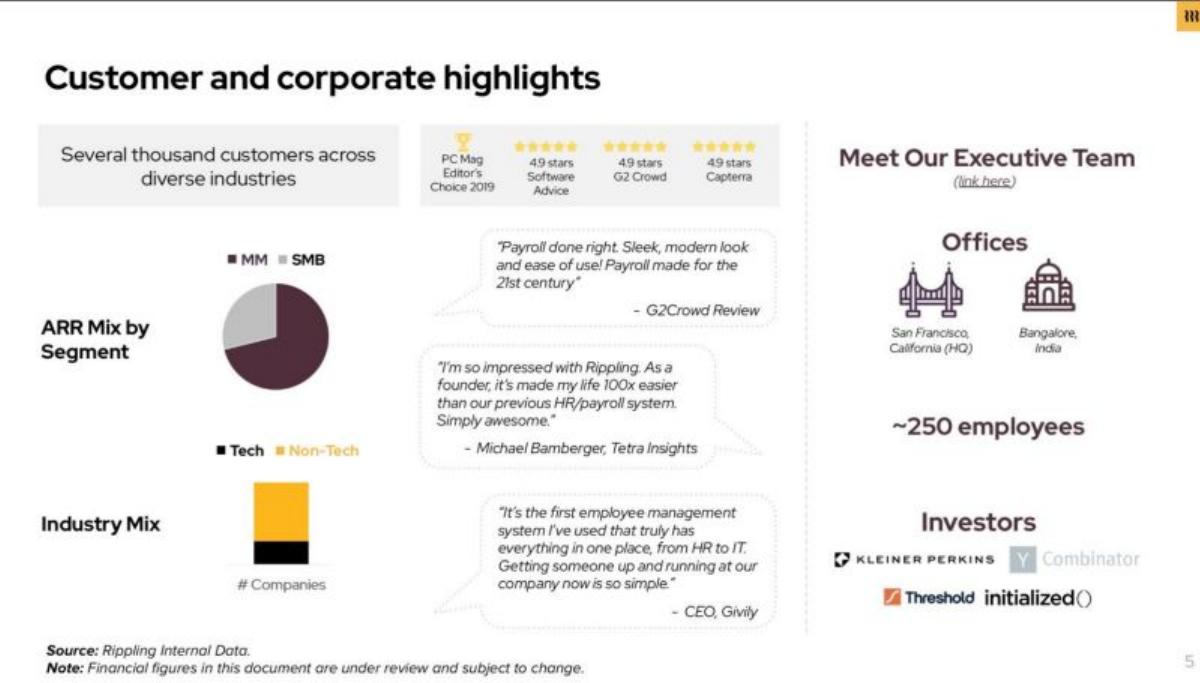
- Rippling highlights a significant presence in the mid-market (MM) segment and a customer base that is majority 'Non-Tech,' proving broad market appeal (Slide 5).
- The second half of the deck uses an 'Acme Company' template to present actual performance trends, including a 120% Net Dollar Retention and 85% Gross Margin (Slide 7).
- A unique 'Month Zero Cash-on-Cash Payback' metric is introduced to argue that sales reps pay for themselves within one month, allowing for burn-neutral expansion (Slide 10).
- The deck provides an exhaustive Net Dollar Retention cohort table, showing how older cohorts (e.g., June 2018) expand to 128% retention over 12 months (Slide 14).
- There is no traditional 'Competition' slide or 'The Ask' slide included in this version of the deck, focusing entirely on the internal engine of growth.
The Strategy of the Compound Startup
Rippling’s Series B deck is a foundational document for what CEO Parker Conrad calls the 'Compound Startup.' While most venture advice suggests startups should 'do one thing and do it well,' Rippling’s deck argues the exact opposite. By Slide 4, they are already showing a revenue stream split across five distinct product categories. This teardown examines how they convinced investors that a broad, multi-product approach was not only viable but superior to the point-solution model.
Slides 1-3: The Disconnected Data Problem
Slide 1 is a simple title card: '1. Rippling Overview.' It sets a professional, understated tone that persists throughout the deck.
Slide 2 identifies the core friction in the modern enterprise. Titled 'Today employee data is scattered and disconnected,' it uses a visual of a single employee whose data is fractured across H.R., I.T., Finance, Sales, and Engineering. The slide lists specific administrative burdens—Payroll, Device Management, Corporate Cards, CRM, and Cloud Hosting—and notes that every change (hiring, promotion, or offboarding) creates a 'cascade of busy work.' This is a sophisticated way of framing the problem; it’s not that payroll is hard, it’s that updating payroll, and then 401k, and then Gmail, and then Slack, is a systemic inefficiency.
Slide 3 presents the solution: 'Rippling centralizes employee data across all systems.' The visual shows the 'cascade' of administrative events being funneled through the Rippling platform, which then pushes updates to four pillars: Payroll, Benefits, Computers & Security, and Apps & Access. This slide is the 'aha' moment of the deck, positioning Rippling as the middleware of the modern office.
Slides 4-5: Traction and Market Validation
Slide 4 focuses on growth. The chart for 'Total Bookings Annual Recurring Revenue (ARR)' shows a steep upward curve, labeled 'Double Digit Millions.' More importantly, the 'Product Split for ARR' pie chart demonstrates that their revenue isn't just coming from one 'hero' product. IT, Benefits, Payroll, and Core HRIS all represent significant portions of the pie. This validates the compound startup thesis: customers are actually buying the whole suite, not just one piece.
Slide 5 provides 'Customer and corporate highlights.' It notes 'Several thousand customers across diverse industries.' Two charts are particularly telling: the ARR Mix by Segment shows a dominant 'MM' (Mid-Market) share compared to 'SMB,' and the Industry Mix shows a surprisingly large 'Non-Tech' orange block. This proves Rippling isn't just a tool for Silicon Valley startups; it has found traction in the broader economy. The slide also lists their 250-person headcount and offices in San Francisco and Bangalore.
Slides 6-9: The SaaS Metric Engine
Slide 6 marks a transition into '2. SaaS Metrics (Template only).' The company uses an 'Acme Company' placeholder, but the metrics shown are clearly intended to represent the health of the Rippling business model.
Slide 7 summarizes 'Key Stats.' It shows a $2.0M June 2020 Total Bookings ARR (illustrative), 3.0x 12-month growth, a Magic Number of 1.0, Net Dollar Retention of 120%, and a Gross Margin of 85%. These are 'best-in-class' SaaS benchmarks. The 85% gross margin is particularly high for a company that handles payroll and benefits, which often involve lower-margin services.
Slide 8 breaks down 'Monthly Net New ARR by Bookings Type.' This bar chart distinguishes between New Logo Sales, Expansion/Contraction, Cross Sell, Logo Churn, and Product Churn. The visual shows that expansion and cross-sell (the yellow and light grey bars) are significant contributors to growth, which is the primary benefit of a multi-product platform.
Slide 9 provides a granular look at 'Total Bookings ARR by Revenue Type and Category.' It lists 17 different products across 4 categories. Category 1 (the largest) shows 240% YoY growth. This level of transparency—even in a template—shows that the company manages its business by tracking the individual performance of nearly 20 different revenue lines.
Slides 10-12: Efficiency and Payback
Slide 10 introduces the 'Month Zero Cash-on-Cash Payback.' This is a critical slide for a Series B. It argues that the sales team is so efficient that the cash brought in from new deals (including upfront annual payments) covers the entire cost of the sales department (salary, commissions, and severance) in the very first month. A ratio of 1.0x means the sales team is 'burn neutral.' This is a powerful argument for raising $145M; if the sales team pays for itself, the capital can be used for R&D and aggressive market capture rather than just subsidizing a sales force.
Slide 11 shows the 'Quick Ratio,' which stays consistently between 8 and 10. The note defines this as (New Logo Sales + Expansion) / (Contraction + Logo Churn + Product Churn). In the SaaS industry, any ratio above 4 is considered elite. Rippling is signaling that for every dollar they lose to churn, they are adding 8 to 10 dollars in new revenue.
Slide 12 tracks the 'Magic Number' over two years, staying consistently between 1.0 and 1.2. The Magic Number measures sales efficiency (new ARR divided by the previous quarter's S&M spend). A 1.0 means that for every $1 spent on marketing, the company generates $1 of recurring revenue. This consistency suggests a highly predictable and scalable growth engine.
Slides 13-14: The Retention Deep Dive
Slide 13 shows 'Net Dollar Retention Rate of Customers Acquired 12+ Months Ago.' While the chart shows a slight downward trend from 160% in June 2019 to 125% in June 2020, a 125% NDR is still exceptional. It means that even if Rippling stopped acquiring new customers, their existing customer base would grow by 25% every year through expansion and cross-selling.
Slide 14 is the most dense slide in the deck: 'Net Dollar Retention by Cohort Month.' This is a 'layer cake' or 'heat map' table showing every monthly cohort from June 2018 to June 2020. It tracks how much each cohort spends in the months following their signup. The green shading indicates expansion. Almost every cell in the table is above 100%, with many reaching 120-128% by month 12. This table is the ultimate proof of product-market fit and the success of the cross-sell strategy.
What Rippling Does Well
The Rippling deck is a masterclass in financial transparency . By Series B, investors are no longer buying a dream; they are buying a machine. Rippling provides the exact blueprints of that machine. They don't just say they are growing; they show the breakdown of that growth by product, by category, and by cohort.
Another strength is the redefinition of the category . They don't compare themselves to Gusto or Zenefits. Instead, they position themselves as an 'Employee Management System' that spans HR and IT. This allows them to claim a much larger Total Addressable Market (TAM) than a simple payroll provider.
What is Missing from the Deck
Despite raising $145M, the deck has several notable omissions:
No Competition Slide: There is no mention of incumbents like ADP or Workday, nor modern competitors like Gusto. The deck assumes the 'disconnected data' problem is so obvious that the competition is 'the status quo' rather than other software. · No Detailed Team Bios: While the executive team is mentioned, there are no headshots or detailed backgrounds. This is likely because the founding team had significant prior exits and reputations. · No 'The Ask' Slide: The deck does not specify how much they are raising or how they will spend the money. This is common in highly competitive 'hot' rounds where the terms are negotiated based on the strength of the metrics rather than a specific request from the founder. · No Market Size (TAM) Slide: There is no 'trillion-dollar market' slide. The deck relies on the 'Product Split' and 'Industry Mix' to imply a massive market.
What Other Founders Should Copy
The Cohort Table: If you have 12+ months of data, a cohort retention table (Slide 14) is the single most convincing piece of evidence you can provide to a Series B investor. It proves that your product is 'sticky.' · Non-Standard Efficiency Metrics: Rippling’s 'Month Zero Payback' (Slide 10) is a brilliant way to frame sales efficiency. Founders should look for unique ways to show that their growth is capital-efficient. · The 'Systemic' Problem: Instead of saying 'Payroll is hard,' Rippling says 'Disconnected data makes everything hard.' Framing your problem as a systemic failure rather than a single pain point can justify a much broader product vision. · Metric Templates: If you are worried about your deck leaking, use the 'Acme Company' approach (Slide 6). It allows you to show investors exactly how you think and what you track, while keeping the real numbers for the private data room.
Frequently asked questions
- Why does the deck use 'Acme Company' for its metrics?
- On Slide 6, Rippling explicitly states that the following slides include 'illustrative numbers only, not actuals.' However, in the context of a Series B raise of this size, these templates are used to show the *shape* and *quality* of their data. It allows the founders to present the exact metrics they track—like Magic Number and Quick Ratio—without publicly disclosing sensitive competitive revenue figures in a leaked deck, while presumably sharing the real numbers in a secure data room.
- What is the 'Compound Startup' strategy shown here?
- Most SaaS startups focus on doing one thing well (e.g., just payroll). Rippling’s deck (Slides 2-4) argues that because employee data is the 'source of truth' for many departments, a single platform should handle everything from device management (IT) to 401k (HR). This strategy is visible in the 'Product Split for ARR' on Slide 4, which shows revenue coming from five different product categories simultaneously.
- How does Rippling prove its sales efficiency?
- On Slide 10, they introduce a 'non-standard metric' called Month Zero Cash-on-Cash Payback. They calculate this by comparing total sales headcount expenses against the 'cash in' brought in by that team in the same month. By maintaining a ratio near 1.0x, they prove to investors that they can hire more sales reps without increasing their net burn, as the reps generate enough upfront cash to cover their own costs immediately.
- What does the 'Quick Ratio' on Slide 11 signify?
- The Quick Ratio measures SaaS growth efficiency by comparing new and expansion revenue against churn and contraction. Rippling shows a consistent Quick Ratio between 8 and 10. In the SaaS world, a Quick Ratio above 4 is generally considered excellent, so these figures (even if illustrative) signal a highly efficient growth engine with very low churn relative to new bookings.
- Is there a team slide in the Rippling Series B deck?
- Slide 5 contains a small section titled 'Meet Our Executive Team' with a link to more details. It also mentions they have approximately 250 employees and lists high-profile investors like Kleiner Perkins, Y Combinator, Threshold, and Initialized. However, it does not feature the traditional 'founder bios' slide, likely because the CEO, Parker Conrad (formerly of Zenefits), was already well-known to the venture community.