Voi’s 14-slide deck is a masterclass in operational validation for a capital-intensive industry. Rather than focusing on the novelty of e-scooters, the deck centers on 'revenue quality'—specifically the transition from free-market competition to protected and exclusive municipal licenses. By late 2020, Voi claimed a 49% share of the licensed European market, dwarfing its nearest peer at 18%. The financial data is unusually transparent for a growth-stage deck, showcasing a 45% contribution margin in its top city and a payback period as short as 64 days for its V3X fleet. While the deck lacks a…
Key takeaways
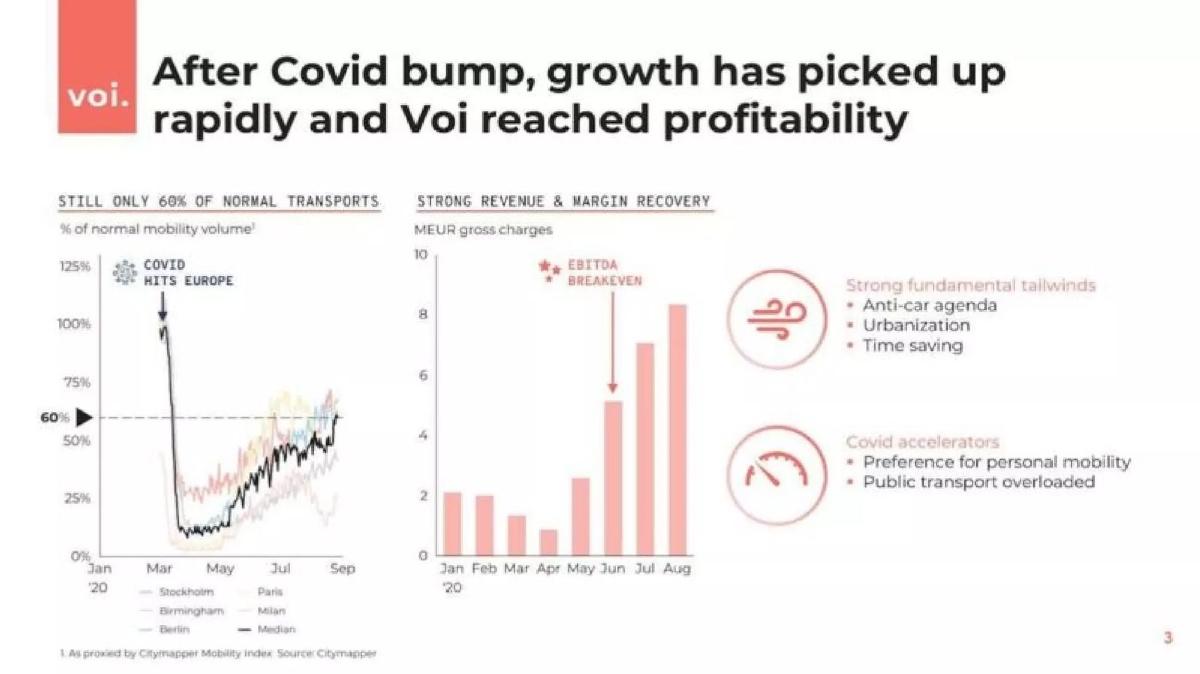
- Voi achieved EBITDA breakeven in June 2020 following a significant recovery from the initial Covid-19 impact (Slide 3).
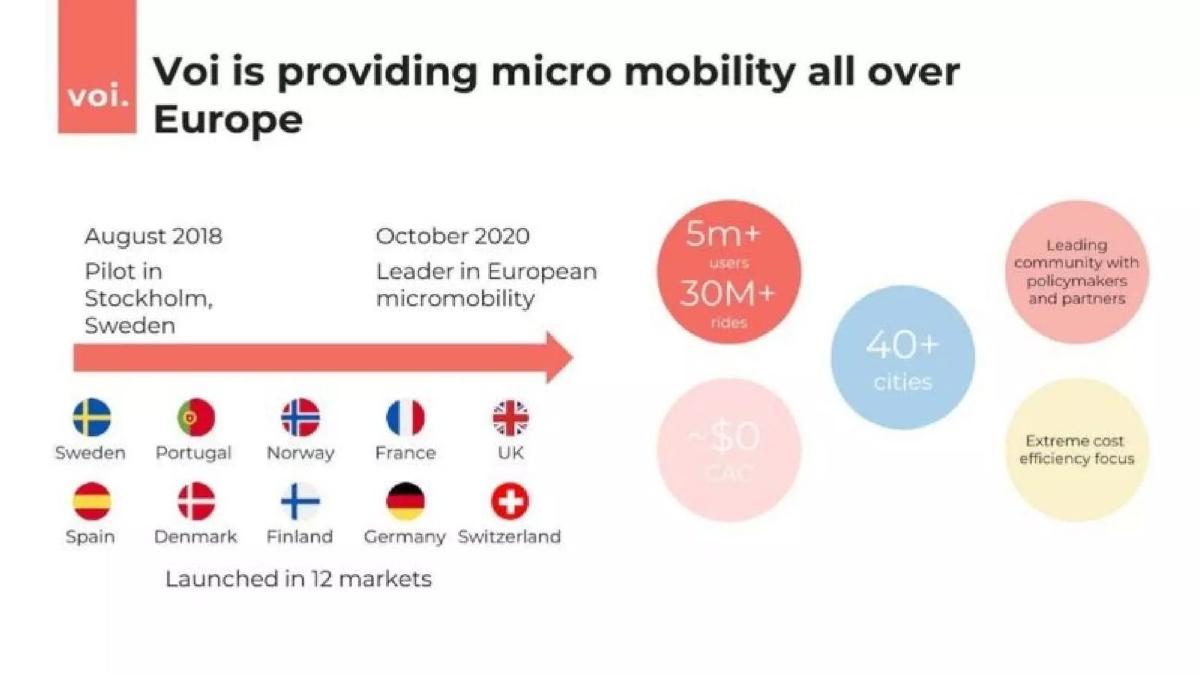
- The company claims a ~0 dollar Customer Acquisition Cost (CAC), relying on organic demand and city presence (Slide 2).
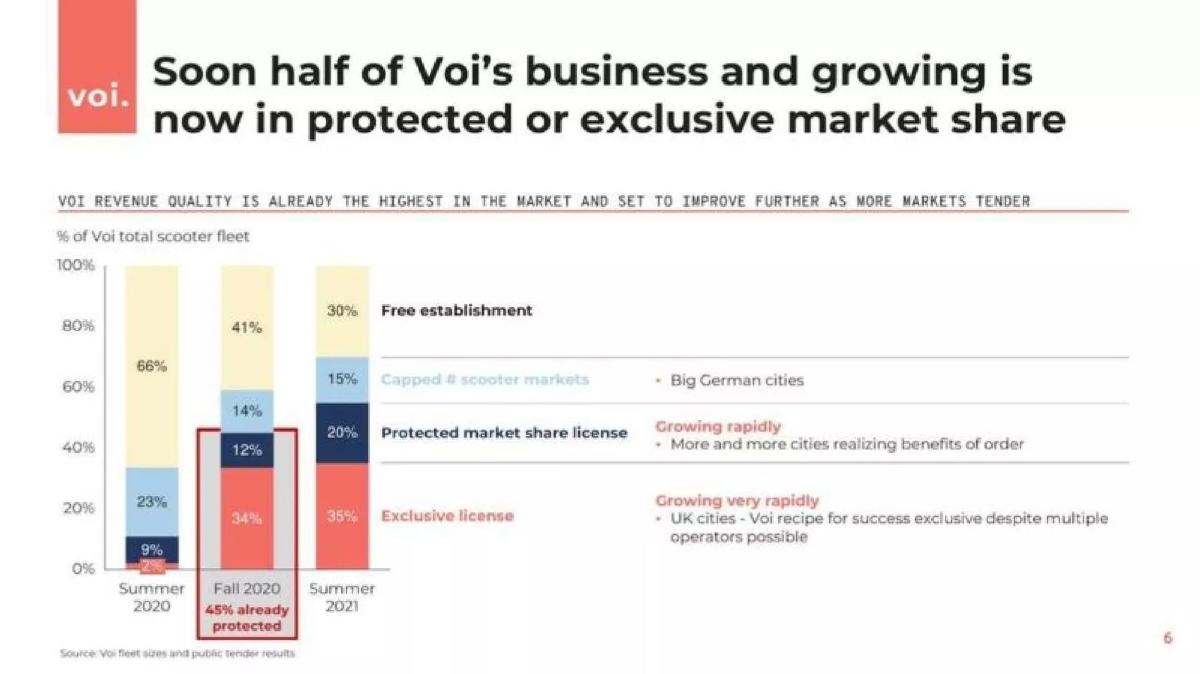
- A strategic shift toward 'protected' revenue is evident, with 45% of the fleet operating under capped or exclusive licenses by Fall 2020 (Slide 6).
- Voi asserts a dominant 49% market share of all licensed scooters in Europe, significantly ahead of its four closest peers (Slide 7).
- Hardware efficiency has improved 8x from the first generation, resulting in a 5-6 year scooter lifetime (Slide 8).
- In its most efficient market (City 1), Voi reports a gross revenue of 16.8 EUR per scooter day and a 45% margin (Slide 13).
- The payback period for the V3X fleet generation ranges from 64 to 193 days depending on the city (Slide 13).
- The deck highlights a 'clean track record' and higher localization as reasons for winning 80% of license outcomes for European players (Slide 7).
Executive Summary: The Shift to Mature Micro-Mobility
Voi Technology’s pitch deck represents a turning point in the micro-mobility narrative. In the early years of the industry, decks focused on the sheer speed of expansion and the 'land grab' of city streets. This deck, dated around late 2020, focuses instead on revenue quality and operational sustainability . By emphasizing their success in winning municipal tenders and achieving rapid hardware payback, Voi positions itself as a mature infrastructure partner rather than a high-risk tech experiment.
Slides 1-2: The Scale of the European Leader
Slide 1 is a standard title slide featuring European street imagery, setting the geographic focus immediately. Slide 2 serves as a high-level traction summary. It notes the company's journey from a pilot in Stockholm in August 2018 to being the 'Leader in European micromobility' by October 2020. The metrics are impressive: 5m+ users , 30M+ rides , and presence in 40+ cities across 12 markets including the UK, France, Germany, and Spain. A standout claim on this slide is the '~$0 CAC' (Customer Acquisition Cost), suggesting that the physical presence of scooters on the street acts as the primary marketing engine, eliminating the need for expensive digital ad spend.
Slide 3: The Covid-19 Recovery and Profitability
Slide 3 addresses the 'elephant in the room': the global pandemic. A chart titled 'Still only 60% of normal transports' shows a precipitous drop in mobility volume in March 2020, followed by a steady recovery. Crucially, the adjacent bar chart shows that despite the volume dip, Voi reached EBITDA breakeven in June 2020 . This is a vital signal to investors that the company can manage costs during downturns. The slide attributes this recovery to 'Covid accelerators' like a preference for personal mobility and 'fundamental tailwinds' like the anti-car agenda and urbanization.
Slide 4: Sustainability as a Competitive Advantage
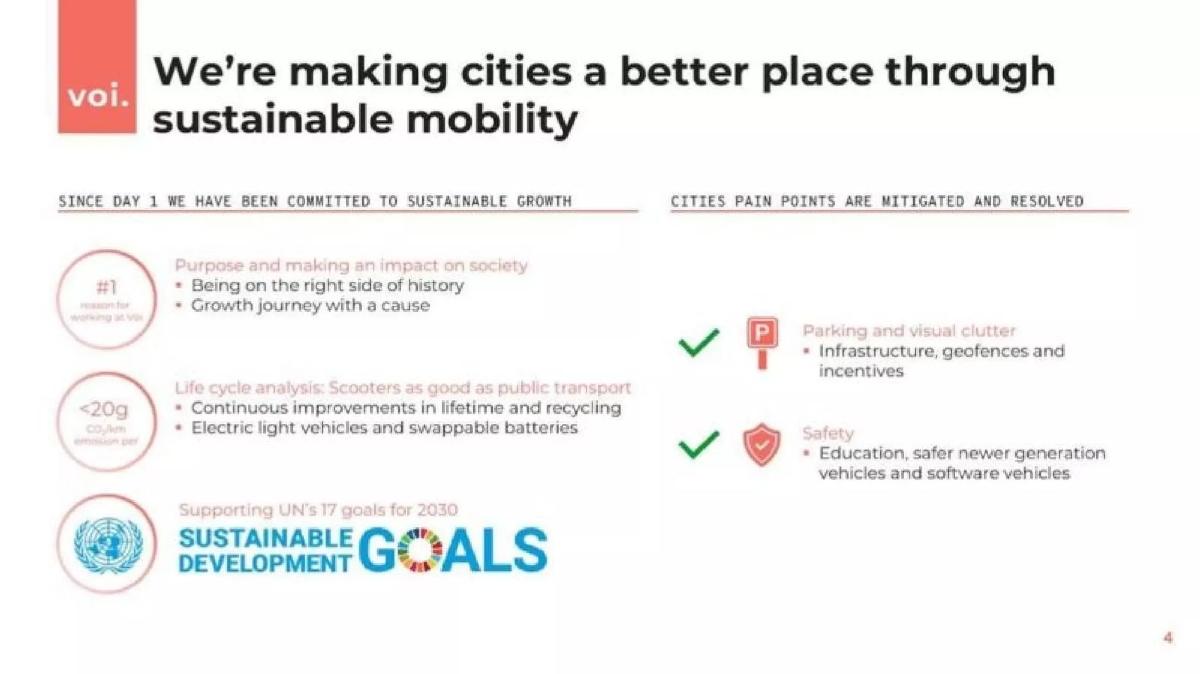
On Slide 4, Voi connects its mission to the UN’s Sustainable Development Goals. They claim a life cycle analysis showing <20g CO2/km emission , which they state is 'as good as public transport.' They also address city pain points directly, mentioning geofencing to solve 'parking and visual clutter' and safety education to mitigate accidents. This slide serves as the bridge to their regulatory strategy: by being the 'most sustainable' player, they become the preferred partner for city governments.
Slides 5-7: The Regulatory Moat
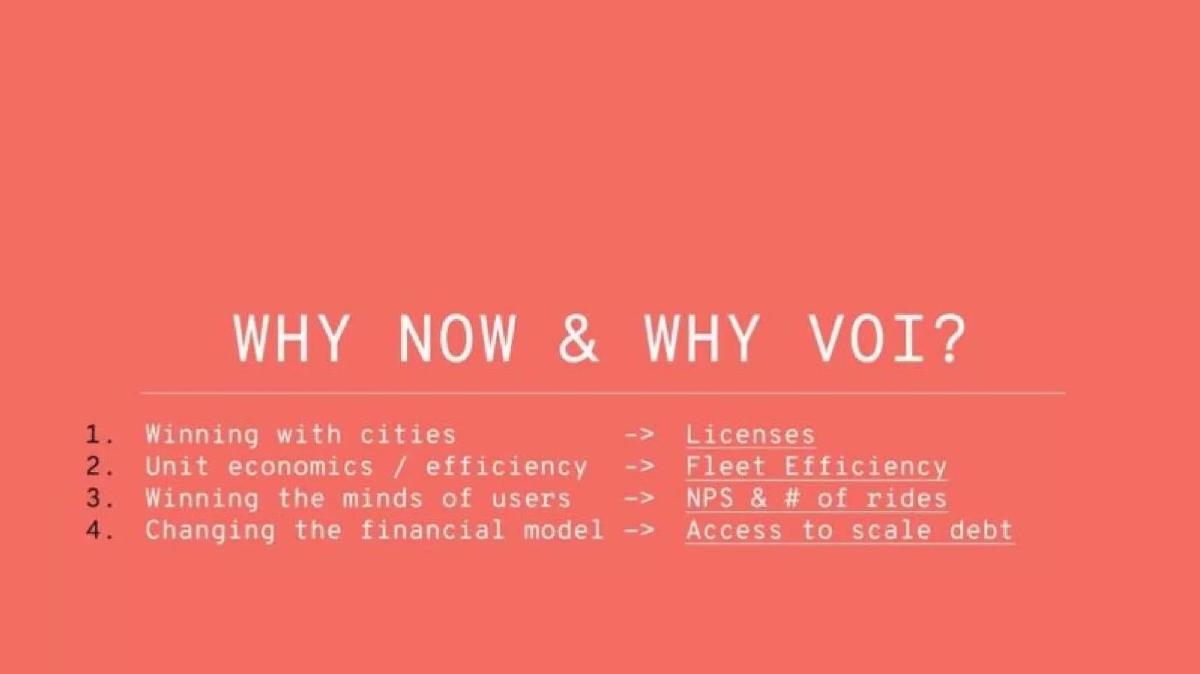
Slide 5 introduces the 'Why Now & Why Voi?' framework, highlighting four pillars: winning with cities (licenses), unit economics (fleet efficiency), winning minds (NPS), and changing the financial model (access to scale debt). Slide 6 is perhaps the most important in the deck. It shows the transition of their fleet from 'Free establishment' (open competition) to 'Protected' and 'Exclusive' licenses . In Summer 2020, only a small fraction of their business was protected; by Fall 2020, 45% was protected , with a projection for further growth. Slide 7 reinforces this by showing Voi holds 49% of all licensed market share in Europe , while their closest competitor ('Peer 1') holds only 18%. This data makes a compelling case that Voi is winning the 'license war' that defines the current state of the industry.
Slides 8-9: Proving the 'Trusted Partner' Status
Slide 8 details the 'Voi recipe' for winning tenders. It lists specific technological solutions: <1 meter location accuracy , a 'no broken scooters' policy, and a 5-6 year scooter lifetime (which they claim is an 8x improvement from their first generation). Slide 9 provides social proof through testimonials from Heads of Transport in Marseille, Hamburg, and Birmingham. The Birmingham quote is particularly strong, noting that Voi is the 'Exclusive licensed operator' for 10,000 scooters, the largest market in Europe awarded to a single operator.
Slides 10-11: Market Dominance and Efficiency
Slide 10 uses a scorecard format to show Voi is #1 in Market Position and #1 in Tender Wins across the Nordics and UK/Ireland, and #1-2 in Germany, Switzerland, and Italy. Only in France do they rank lower (#4). Slide 11 focuses on 'Rides per ready scooter day,' using external 3rd party data to show Voi consistently outperforms Peer 1 and Peer 2 in cities like Oslo, Stockholm, and Copenhagen. In Oslo, Voi achieves 5 rides per day , nearly double that of its closest competitor. They attribute this to 'internal models based on data science' for fleet placement.
Slides 12-13: The Financial Engine
Slide 12 displays a 'sanitized' list of markets showing positive free cash flow. The top-performing city shows a 73% Market EBITDA margin (pre-HQ cost, pre-capex). Slide 13 provides the most granular unit economics seen in public decks of this era. It breaks down revenue and costs for five different cities. In 'City 1,' a V3X scooter generates 16.8 EUR per day . After subtracting contra revenues, charging, logistics, and repairs, the 'Scooter free cash flow' is 9.3 EUR. After depreciation and overhead, the contribution margin is 45%. This leads to a payback period of just 64 days . Even in the least efficient city shown ('City 5'), the payback period is 193 days, which is still well within the 5-6 year lifespan of the hardware.
Slide 14: The Vision
The final slide is a wordless graphic depicting the 'Evolution of Man,' ending with a person on an e-scooter. It’s a lighthearted but clear statement: micro-mobility is the inevitable next step in human transportation.
What Works in the Voi Pitch Deck
1. Transparency of Unit Economics: Slide 13 is the star of the deck. By breaking down the exact EUR-per-day costs of charging, repairs, and depreciation, Voi proves that their business model is not just a 'growth at all costs' play, but a sustainable financial engine. The 64-day payback period is a powerful metric for investors concerned about the capital intensity of hardware.
2. The 'Regulatory Moat' Narrative: The deck successfully shifts the focus from 'how many scooters do we have' to 'how many exclusive licenses do we own.' Slide 6 and 7 clearly demonstrate that Voi is winning the battle for protected market share, which is a much more defensible position than competing in an open, unregulated market.
3. Addressing the Pandemic Head-On: Rather than hiding the impact of Covid-19, Slide 3 uses it to demonstrate resilience. Showing that they reached EBITDA breakeven during a period of reduced volume proves that the management team has tight control over the company's cost structure.
What is Missing from the Voi Pitch Deck
1. A Team Slide: While the catalogue listing mentions founders Douglas Stark, Filip Lindvall, and Fredrik Hjelm, the deck itself contains no information about the leadership team. In a growth-stage raise, investors want to see the bench strength of the executive team, especially in operations and government relations.
2. The 'Ask' and Use of Funds: The deck ends abruptly with a vision graphic. There is no slide detailing how much money Voi is looking to raise, what valuation they are targeting, or specifically how the new capital will be deployed (e.g., R&D for new vehicles vs. market expansion).
3. Competitive Landscape Detail: While 'Peer 1' through 'Peer 4' are mentioned in charts, there is no qualitative analysis of how Voi’s technology or service differs from specific competitors like Lime, Bird, or Tier. A 'feature comparison' or 'strategic positioning' matrix is missing.
Founder's Playbook: What to Copy
Use 'Revenue Quality' to Define Success: If you are in a crowded market, don't just show total revenue. Show that your revenue is defensible . Voi’s breakdown of 'Exclusive' vs. 'Free establishment' revenue (Slide 6) is a brilliant way to show that their growth is not just fast, but 'high quality.'
Prove the Payback: For any business involving physical assets, the 'Days to Payback' metric is the most important number in the deck. Copy the layout of Slide 13 to show investors exactly how a single unit of your product pays for itself and then generates profit.
Leverage External Validation: Voi uses 'External 3rd Party Data' (Slide 11) and direct quotes from government officials (Slide 9). This is far more persuasive than a founder claiming their own product is the best. If you have third-party benchmarks or testimonials from high-stakes stakeholders, give them their own slides.
Focus on the 'Why Now': Voi links their growth to broader societal shifts—urbanization and the 'anti-car agenda' (Slide 3). Connecting your startup to unstoppable macro trends makes your success seem inevitable rather than lucky. Keep the Design Clean: The deck uses a consistent color palette (Voi red) and clear, uncluttered charts. Even complex financial data on Slide 13 is presented in a readable, professional table. High-growth founders should prioritize this level of visual clarity to ensure their metrics are the focus, not the design.
Frequently asked questions
- How does Voi differentiate itself from competitors like Bird or Lime?
- Voi differentiates itself through a 'regulatory moat' strategy. Slide 7 shows they hold 49% of the licensed market share in Europe, while Slide 6 details their transition away from 'free establishment' markets toward exclusive and protected licenses. They argue that being a European player with a focus on sustainability and localization allows them to win 80% of municipal tenders over international rivals.
- What are the specific unit economics for Voi's scooters?
- According to Slide 13, Voi's V3X fleet generation generates between 7.7 and 16.8 EUR in gross revenue per scooter day. After accounting for charging, logistics, repairs, and overhead, the contribution margin ranges from 18% to 45%. This results in a hardware payback period of 64 to 193 days, which is remarkably fast for the transportation sector.
- How did the Covid-19 pandemic affect Voi's business?
- Slide 3 illustrates that mobility volume dropped to nearly 10% of normal levels in March 2020. However, the company used the recovery period to reach EBITDA breakeven by June 2020. They cite 'Covid accelerators' such as a preference for personal mobility and overloaded public transport as tailwinds that helped them recover to 60% of normal volume by September 2020.
- What is Voi's approach to sustainability?
- Sustainability is positioned as a core business driver rather than just PR. Slide 4 claims emissions are less than 20g CO2/km, making scooters as efficient as public transport. Slide 8 highlights a 5-6 year scooter lifetime and the use of swappable batteries to reduce the carbon footprint of operations, which directly helps them win municipal licenses.
- What is missing from this pitch deck?
- The deck is notably missing a Team slide, which is unusual for a growth-stage company, though the founders are well-known in the European ecosystem. It also lacks a specific 'Ask' slide detailing how much capital is being raised and the intended use of funds. Finally, there is no detailed roadmap for future product categories beyond a brief mention of e-bikes and e-mopeds.