Vulcan Materials Company (VMC) presents a compelling case for market leadership in the aggregates sector, focusing on the essential nature of their assets and a de-risked financial profile. The deck, dated August 12, 2013, centers on three pillars: strategic positioning in high-growth markets, a massive 15-billion-ton reserve base, and expanding unit profitability. By showcasing a 27% increase in unit profitability over peak-year volumes and a long-term price growth CAGR that consistently outperforms the industry (6.4% vs 5.3% from 2002-2012), Vulcan demonstrates strong pricing power. The pre…
Key takeaways
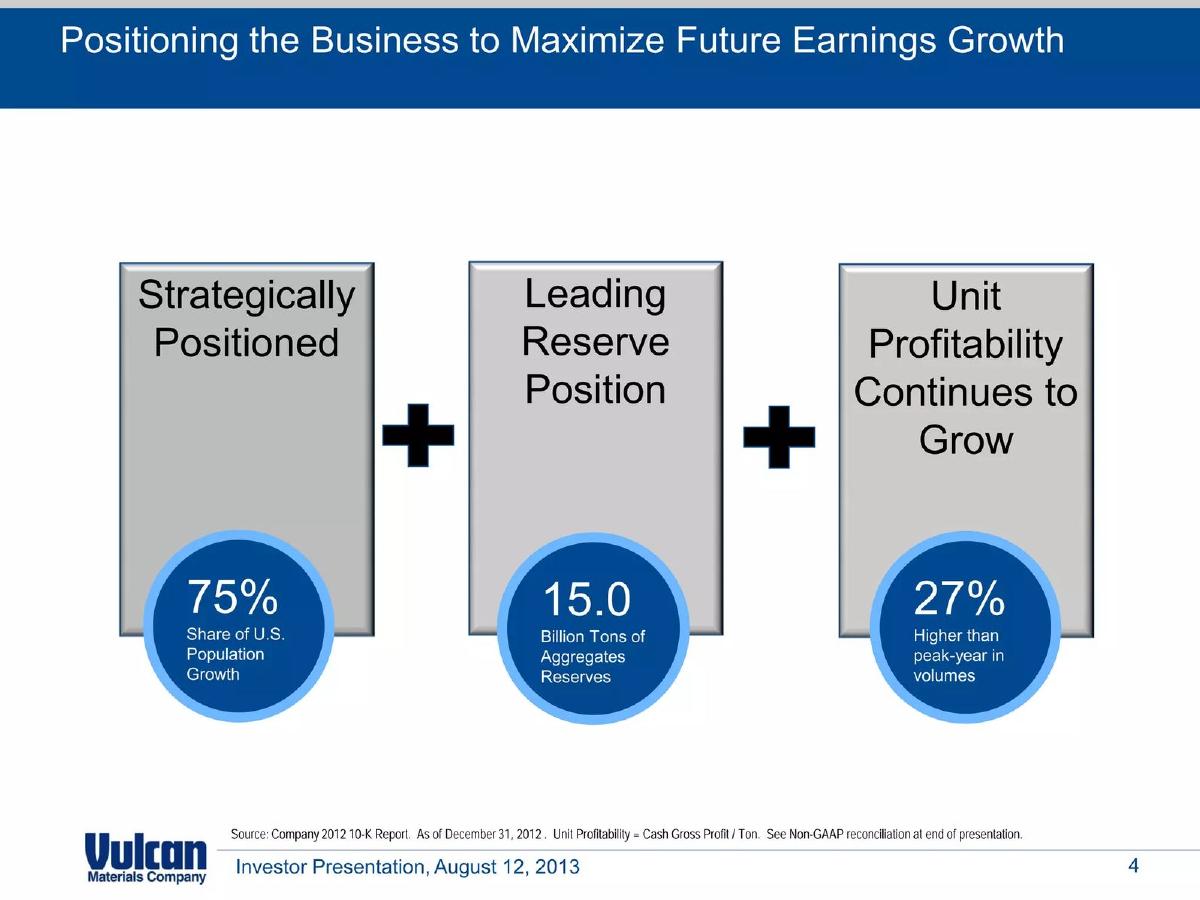
- Vulcan claims a 75% share of U.S. population growth in the markets they serve, positioning them for long-term demand (Slide 4).
- The company controls 15.0 billion tons of aggregates reserves, creating a significant barrier to entry for new competitors (Slide 4).
- Unit profitability was 27% higher in 2012 than in previous peak-volume years, demonstrating significant operating leverage (Slide 4).
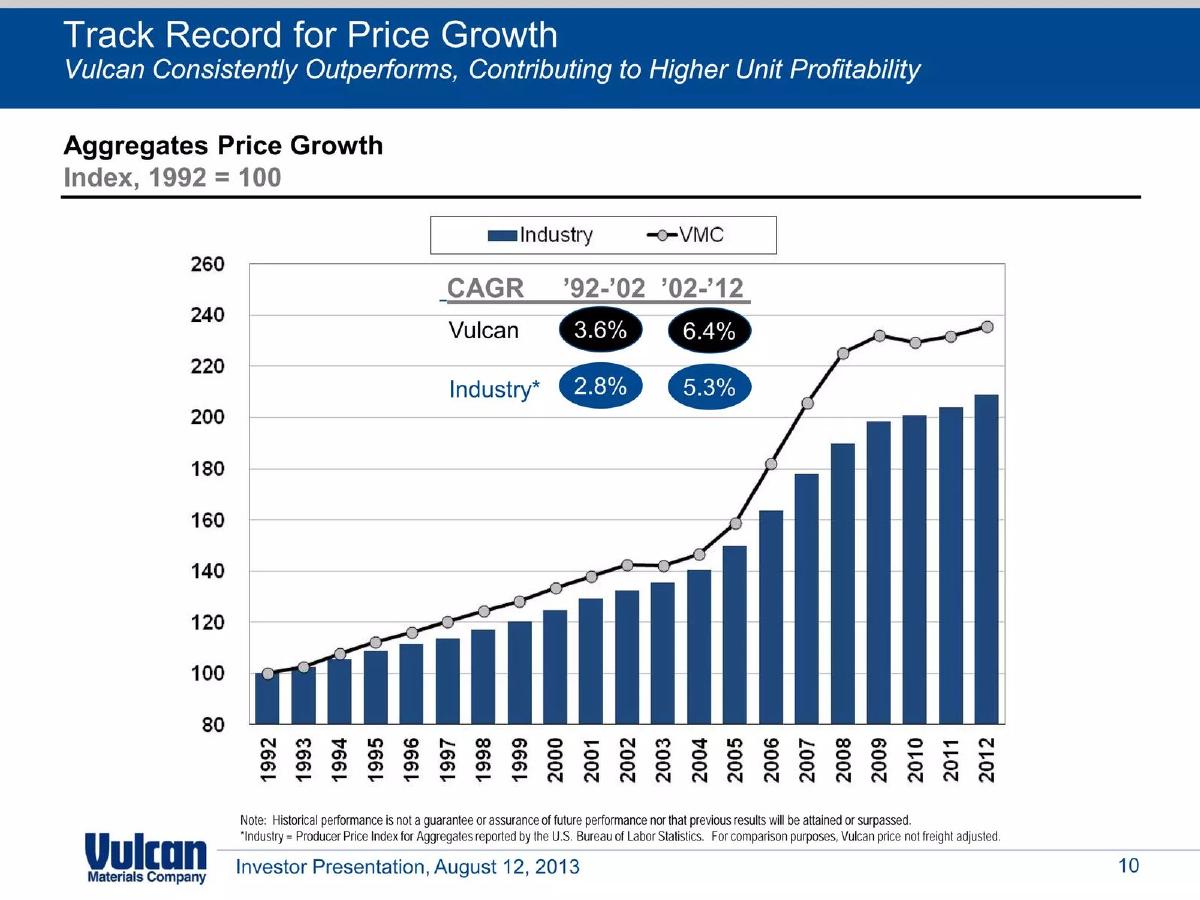
- Vulcan's price growth CAGR of 6.4% between 2002 and 2012 outperformed the industry average of 5.3% (Slide 10).
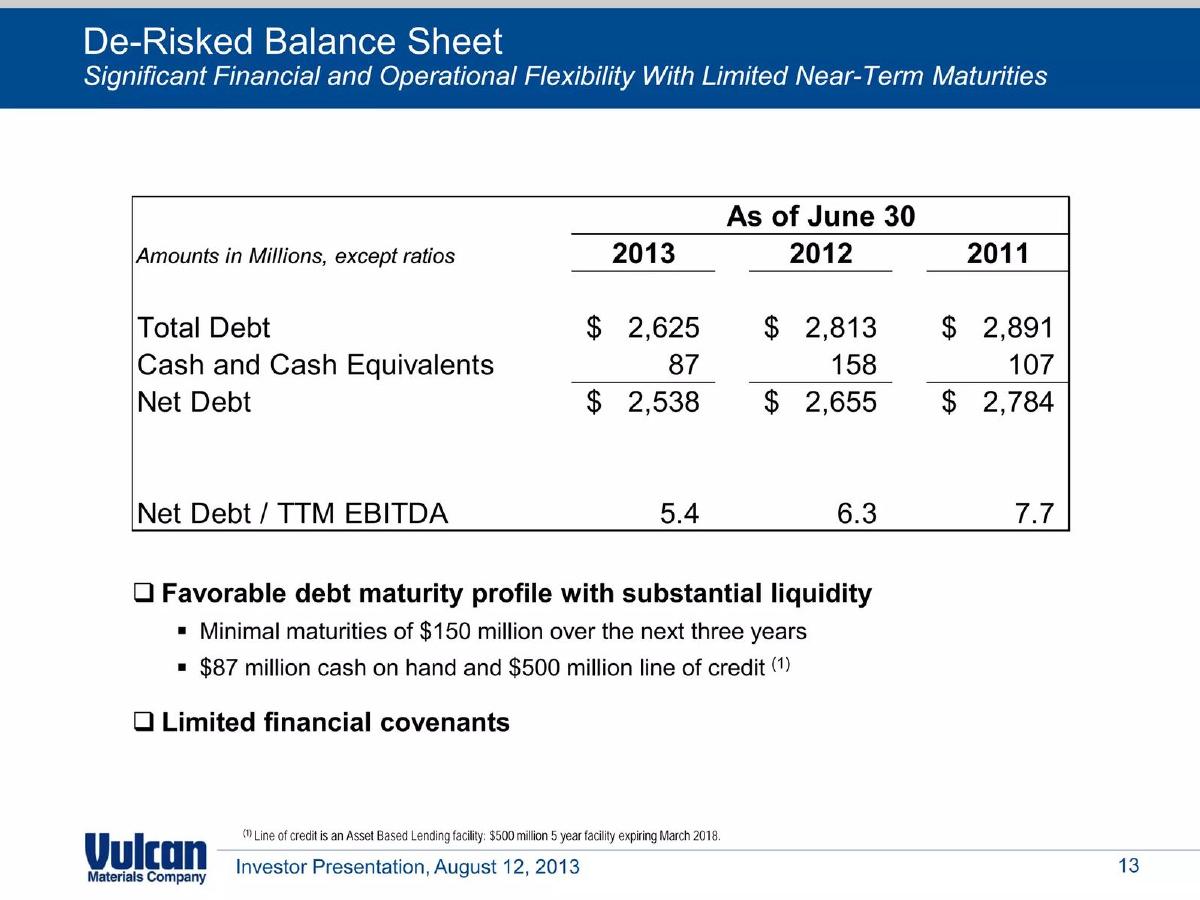
- The balance sheet was actively de-risked, with net debt decreasing from $2,784 million in 2011 to $2,538 million by mid-2013 (Slide 13).
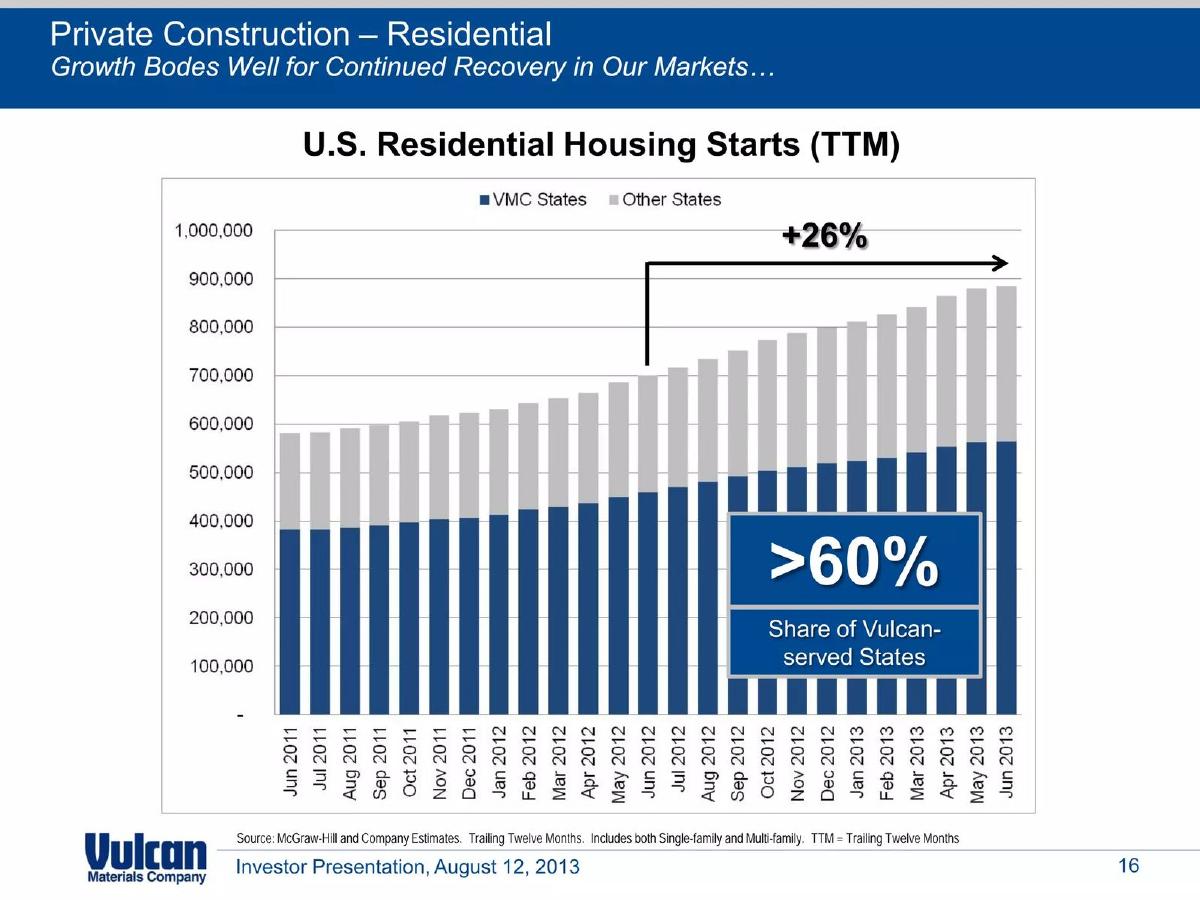
- The company serves states representing over 60% of U.S. residential housing starts as of June 2013 (Slide 16).
- Logistics costs vary wildly by mode, with ships costing less than $0.01 per ton mile compared to $0.15-$0.35 for trucks (Slide 25).
- The deck emphasizes a commitment to restoring a meaningful dividend as part of its value proposition (Slide 22).
Executive Summary: The Industrial Moat
The Vulcan Materials Company (VMC) investor presentation from August 2013 is a masterclass in articulating the value of hard assets and geographic dominance. In an era where many decks focus on software scalability, Vulcan reminds investors that physical scarcity and logistical efficiency are equally powerful drivers of shareholder value. The deck is structured to move the investor from the macro strength of the asset class to the micro efficiency of Vulcan's specific operations, concluding with a clear value proposition centered on market recovery and financial discipline.
Slide 1: Title and Strategy
The cover slide sets an immediate tone of stability and essentiality. The tagline, "Our strategy is based on our strength," followed by "Aggregates: Essential Material | Valuable Asset," positions the company not just as a supplier, but as a steward of a critical resource. The imagery of heavy machinery and industrial processing plants reinforces the capital-intensive nature of the business, which acts as a natural barrier to entry.
Slide 4: The Three Pillars of Growth
This slide serves as the executive summary for the entire investment thesis. It breaks down the company's value into three quantifiable metrics:
Strategically Positioned: 75% share of U.S. population growth. This suggests that Vulcan isn't just everywhere; they are where the people (and therefore the construction demand) are moving. · Leading Reserve Position: 15.0 Billion Tons of Aggregates Reserves. In a business where permitting new quarries is notoriously difficult, this volume represents decades of locked-in supply. · Unit Profitability: 27% higher than peak-year in volumes. This is a crucial metric for investors, as it demonstrates that the company has become more efficient over time, meaning a return to previous volume levels would result in significantly higher earnings than in the past.
Slide 7: Operating Leverage and Margin Expansion
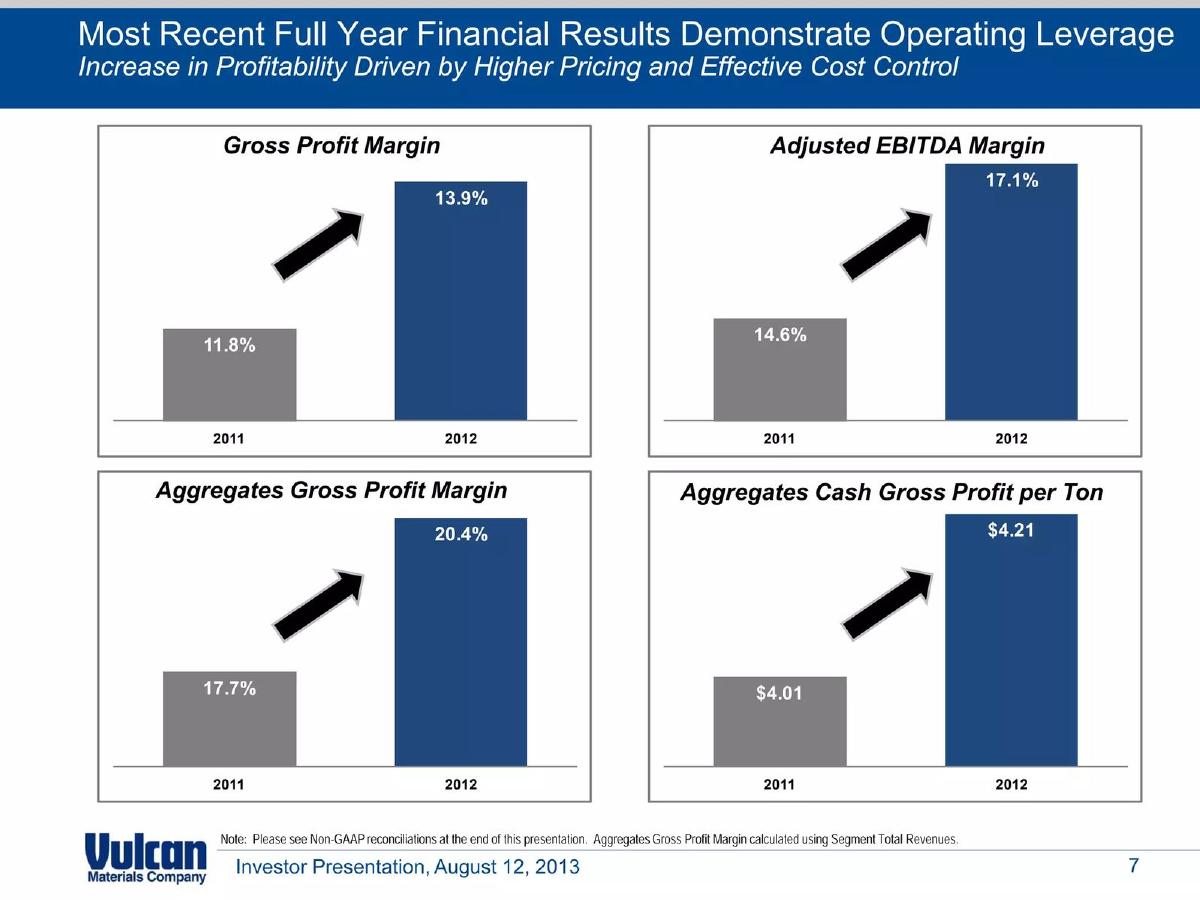
Vulcan uses Slide 7 to prove their ability to control costs and raise prices. They show a clear upward trend across four key financial metrics from 2011 to 2012:
Gross Profit Margin: Increased from 11.8% to 13.9%. · Adjusted EBITDA Margin: Increased from 14.6% to 17.1%. · Aggregates Gross Profit Margin: Increased from 17.7% to 20.4%. · Aggregates Cash Gross Profit per Ton: Increased from $4.01 to $4.21.
The headline explicitly attributes this to "Higher Pricing and Effective Cost Control," signaling to investors that management is focused on the bottom line, not just top-line growth.
Slide 10: The Pricing Power Proof Point
This is perhaps the most important slide for long-term investors. It shows an indexed price growth chart from 1992 to 2012. Vulcan consistently stays above the industry average. Specifically, from 2002 to 2012, Vulcan achieved a 6.4% CAGR compared to the industry's 5.3% . This 1.1% delta, compounded over a decade, represents a massive competitive advantage and validates their claim of having 'superior' quarry locations that command premium pricing.
Slide 13: Balance Sheet De-Risking
In 2013, the memory of the 2008 financial crisis was still fresh, and heavy industrial companies were often viewed through the lens of their debt loads. Vulcan addresses this head-on by showing a declining debt profile. Total debt dropped from $2,891 million in 2011 to $2,625 million in 2013. The most dramatic improvement is in the Net Debt / TTM EBITDA ratio , which fell from 7.7 to 5.4 . They also highlight a $500 million line of credit and minimal maturities ($150 million) over the next three years, painting a picture of financial stability.
Slide 16: Residential Market Recovery
Vulcan ties its fortunes to the U.S. housing recovery. The chart shows a 26% increase in U.S. Residential Housing Starts (TTM) from mid-2011 to mid-2013. Crucially, they note that they serve states representing >60% of these starts. This slide connects the macro economic recovery directly to Vulcan's order book.
Slide 19: Nonresidential Indicators
To bolster the case for private construction, Slide 19 introduces the Architectural Billing Index (ABI) . They note that the ABI remained above 50 (indicating an increase in activity) for 10 of the last 12 months. This provides a forward-looking indicator that the construction pipeline is healthy, moving beyond just residential housing into commercial and industrial projects.
Slide 22: The Value Proposition Recap
This slide summarizes the pitch into three buckets: Superior Aggregates Operations , Strong Operating Leverage , and a De-Risked Balance Sheet . It introduces a new, investor-friendly point: a "Commitment to restore a meaningful dividend." This is a classic signal of a maturing company that is confident in its cash flow generation.
Slide 25: The Logistics Moat (Appendix)
While labeled as an appendix, this slide is vital for understanding the business's structural protection. It maps out the cost per ton mile for different transport modes:
Truck: $0.15 - $0.35 (20-25 tons) · Rail: $0.04 - $0.12 (4-5 truckloads per car) · Barge: $0.02 - $0.03 (65 truckloads per barge) · Ship: Less than $0.01 (2,500 truckloads per ship)
By showing their "Comprehensive Distribution Network," Vulcan explains how they can move massive amounts of material from their quarries in the Gulf Coast and Mexico to high-demand markets in Florida and the Eastern Seaboard at a fraction of the cost a local, truck-dependent competitor would face.
Slide 28: Regional Density
The East Region Map shows the density of Vulcan's assets. The sheer number of Aggregates Facilities (blue circles) and Ready-Mix Plants (white triangles) across Georgia, South Carolina, North Carolina, and Virginia demonstrates their local market dominance. In the aggregates business, proximity to the job site is everything; this map shows that Vulcan has the 'dirt' exactly where the builders need it.
What Vulcan Materials Company Does Well
The deck excels at quantifying its competitive advantages. Instead of saying they have 'a lot of rocks,' they state they have 15 billion tons . Instead of saying they are 'efficient,' they show a 27% increase in unit profitability . The use of third-party indices like the ABI and the Producer Price Index for Aggregates adds a layer of objective credibility to their claims. Furthermore, the focus on logistics costs (Slide 25) provides a clear explanation of why their business model is difficult to disrupt.
What is Missing from the Deck
As an investor handout, the deck is comprehensive, but a few key areas are omitted in these selected slides:
Environmental and Regulatory Risks: There is no mention of the increasing difficulty of quarry permitting or environmental compliance costs, which are significant headwinds in this industry. · Competitive Landscape: While they compare themselves to the 'Industry' in pricing, they do not name specific competitors or discuss market share relative to other giants like Martin Marietta. · Technology and Innovation: The deck is very 'old school' industrial. There is no mention of how technology, automation, or data analytics are being used to optimize quarry operations or logistics. · Management Team: The provided slides do not include a team or leadership slide, which is standard for establishing the human element of the execution strategy.
Founder's Takeaway: Lessons in Asset-Based Pitching
Founders in capital-intensive or 'hard tech' industries can learn a great deal from Vulcan's approach. First, identify your 'scarcity' metric . For Vulcan, it's permitted reserves. For a startup, it might be a specific patent or a unique data set. Second, prove your pricing power . If you can show that you consistently outperform your industry's price growth, you prove that you have a 'must-have' product rather than a commodity. Finally, visualize your moat . Vulcan's logistics map (Slide 25) is a perfect example of showing, not just telling, why it is hard for a new player to enter their territory and compete on price.
Frequently asked questions
- What is Vulcan Materials Company's primary product?
- Based on the presentation, Vulcan's primary focus is 'Aggregates,' which they describe as an essential material and a valuable asset. Aggregates generally include crushed stone, sand, and gravel used in construction. The deck also mentions 'Ready-Mix Plants' in its regional maps, indicating downstream integration, but the core investment thesis is built on their 15-billion-ton aggregate reserve position.
- How does Vulcan demonstrate its competitive advantage in pricing?
- Vulcan uses a long-term historical chart (Slide 10) comparing their price growth to the broader industry from 1992 to 2012. They show that while the industry grew at a 5.3% CAGR in the latter decade, Vulcan achieved 6.4%. This 110-basis-point outperformance serves as evidence of their pricing power and the strategic value of their specific quarry locations.
- What role does logistics play in Vulcan's business model?
- Logistics is a critical moat. Slide 25 illustrates that moving aggregates by truck is expensive ($0.15-$0.35 per ton mile), while water transport via ship is extremely cheap (less than $0.01 per ton mile). By controlling a 'comprehensive distribution network' of rail, barge, and ship, Vulcan can transport materials from high-reserve areas to high-demand coastal markets where local reserves are limited.
- What was the company's financial health at the time of this presentation?
- The company was in a deleveraging phase. Slide 13 shows that Total Debt fell from $2,891 million in 2011 to $2,625 million in mid-2013. More importantly, their Net Debt to TTM EBITDA ratio improved significantly, dropping from 7.7x to 5.4x over the same period, which they describe as a 'De-Risked Balance Sheet' with 'substantial liquidity.'
- Which market segments drive demand for Vulcan's products?
- The deck highlights three main drivers: Private Residential construction (Slide 16), Private Nonresidential construction (Slide 19), and Public Infrastructure. They specifically cite a 'New multi-year Federal Highway Bill' as a key component of their value proposition on Slide 22, indicating that government spending on roads and bridges is a fundamental demand driver.