Novo Resources Corp.'s 2015 presentation is a highly technical geological briefing rather than a traditional startup pitch. Spanning 33 slides, the deck focuses on the Beatons Creek and Marble Bar areas within the Pilbara Gold Project. It prioritizes physical evidence—microscopic gold grain analysis, core samples, and site photos—to prove the presence of gravity-recoverable gold. While it excels at demonstrating the 'Selective Mining Concept' (using bulldozers instead of blasting), it lacks typical corporate finance metrics like a detailed budget, team bios, or a specific funding 'ask' within…
Key takeaways
- The company targets two primary areas: Beatons Creek and Marble Bar, both underlain by Fortescue Group rocks (Slide 5).
- A June 2014 study determined that ~98% of gold by weight occurs in grain sizes greater than 150 microns (Slide 9).
- Gravity Gold Recovery tests in late 2014 confirmed high potential recoveries of approximately 80% (Slide 9).
- The mining strategy utilizes a 'Selective Mining Concept' which requires no drilling or blasting; material is ripped and pushed by a bulldozer (Slide 21).
- The project identifies a Phase 2 Shallow Oxide Target Area containing an estimated 200-300 Koz Au (Slide 29).
- Deep sulfide target areas are estimated to lie over 70 meters below the surface with a potential of 3-5 Moz Au (Slide 29).
- The deck provides specific contact information for offices in Vancouver, Canada, and Longmont, USA (Slide 33).
- Visual evidence of gold is prioritized, including photos of gold grains next to a 1mm scale and a 2-dollar coin for size reference (Slides 9, 13, 25).
Introduction and Market Context
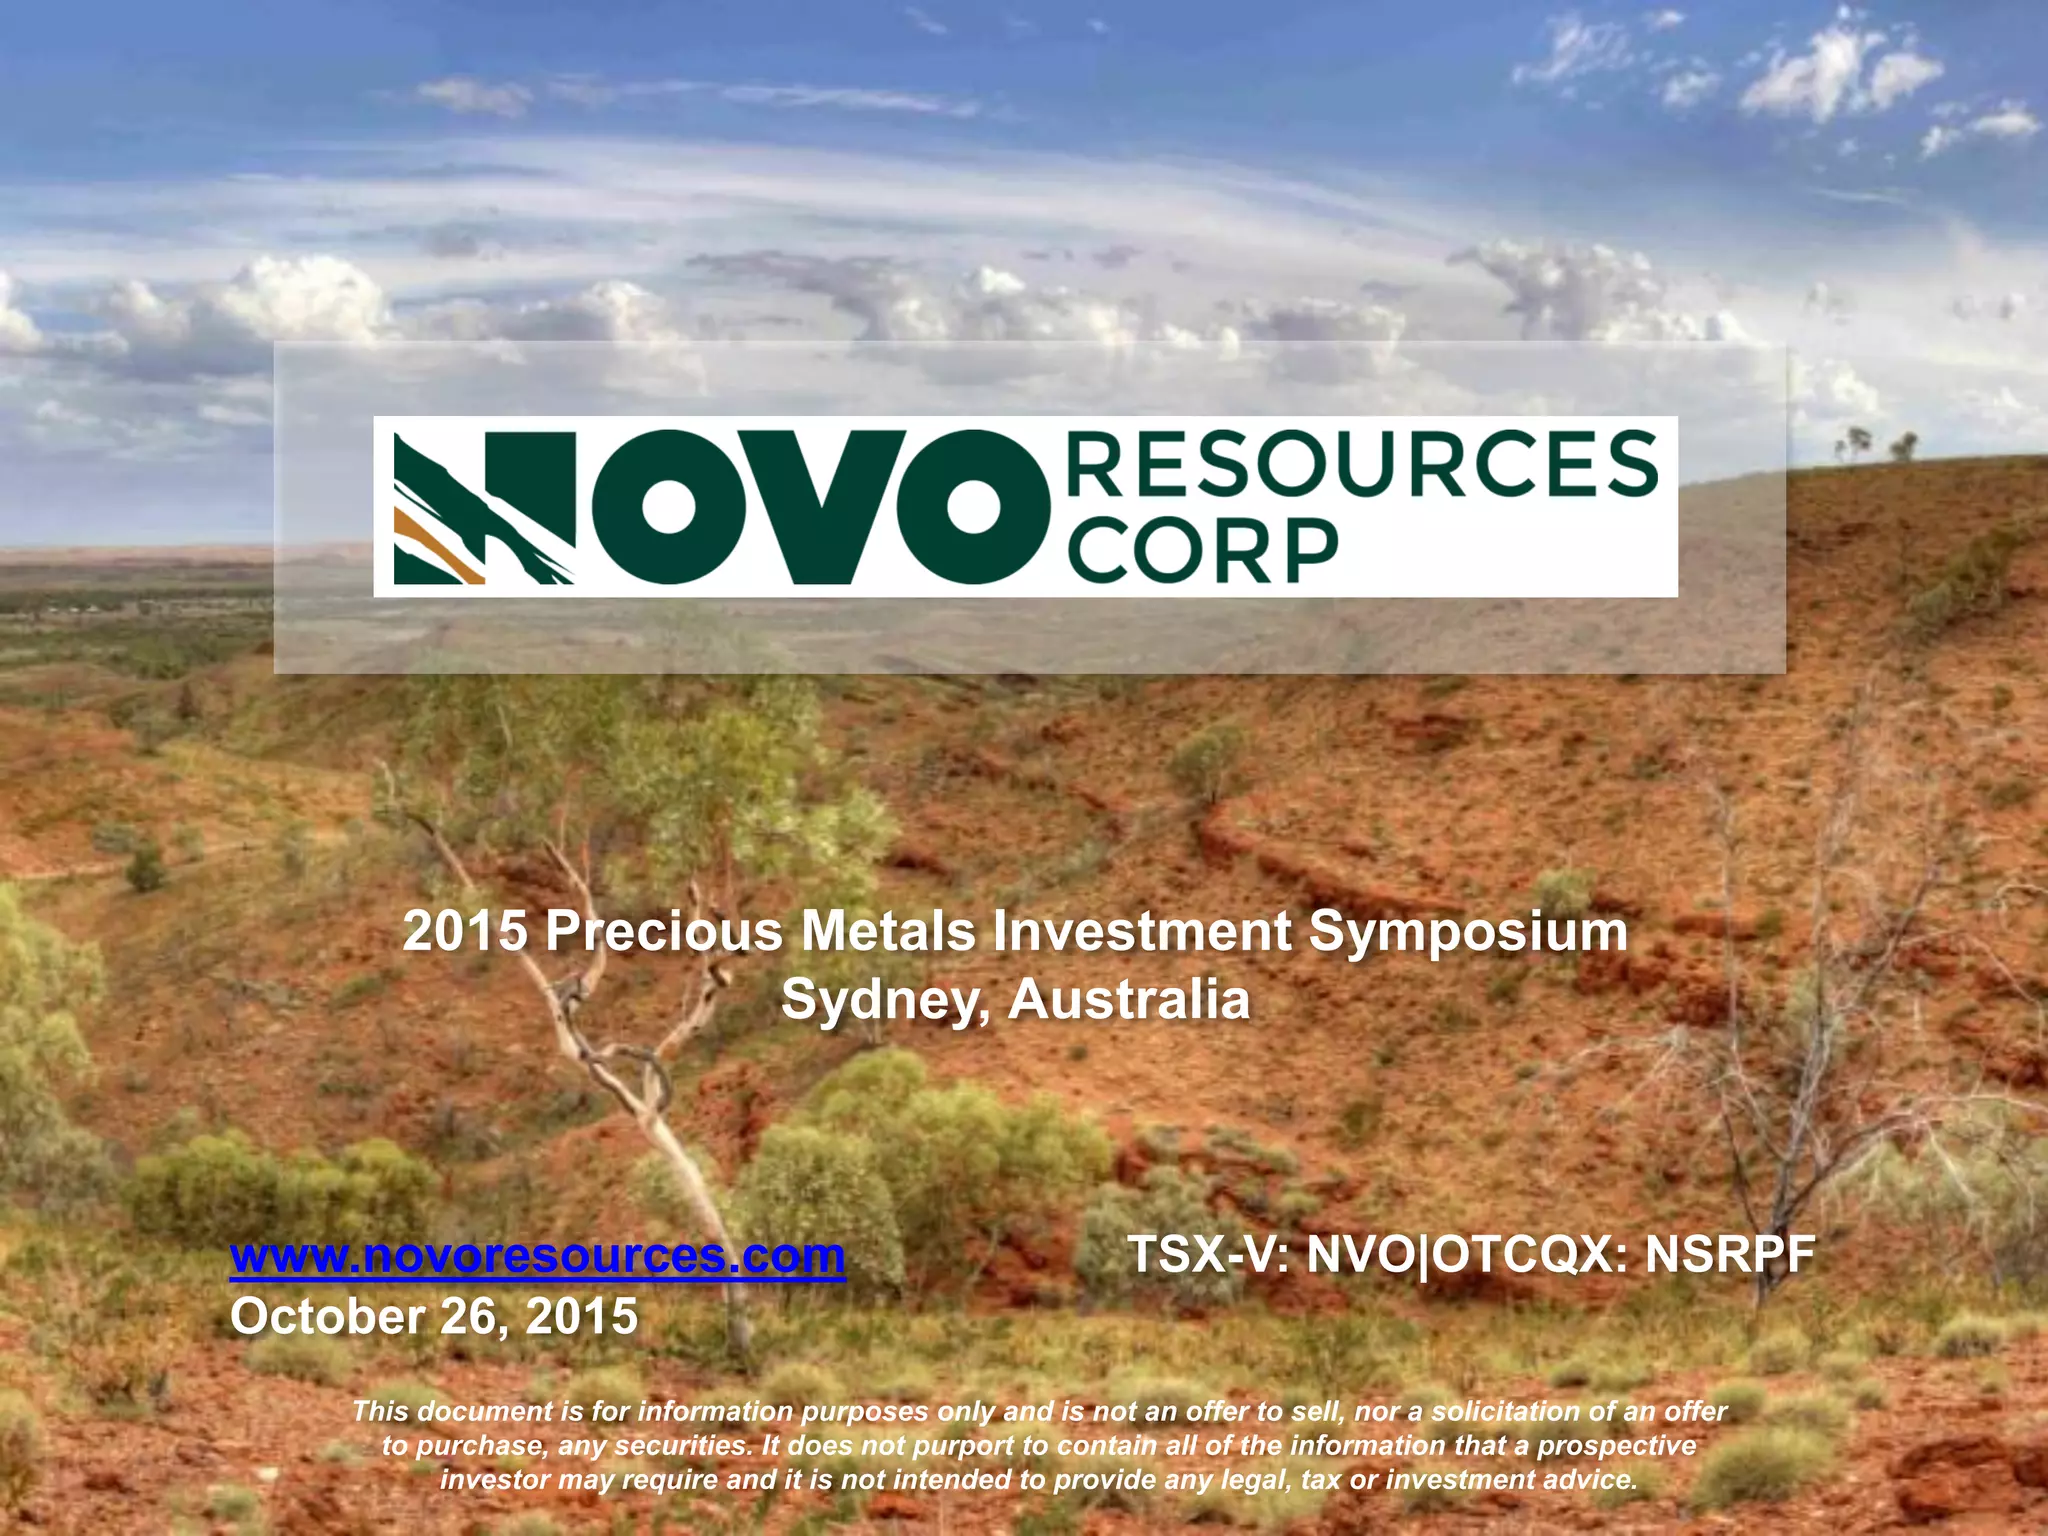
Novo Resources Corp. presented this deck at the 2015 Precious Metals Investment Symposium in Sydney, Australia. Unlike a software-as-a-service (SaaS) pitch that focuses on user acquisition and churn, this mining deck is a masterclass in geological validation. The company is listed on the TSX-V (NVO) and OTCQX (NSRPF), indicating it was already a public entity at the time of this presentation. The primary goal of the deck is to de-risk the technical aspects of their Pilbara Gold Project for institutional and sophisticated retail investors.
Slide 1: Title and Compliance
The cover slide establishes the setting: the 2015 Precious Metals Investment Symposium. It features a high-resolution photograph of the arid Australian outback, immediately grounding the project in its physical location. Crucially, it includes the ticker symbols for both the Canadian and US markets. A standard legal disclaimer at the bottom clarifies that the document is for information purposes only and not a direct solicitation for the purchase of securities.
Slide 5: The Pilbara Gold Project Geography
This slide provides the macro-geological context. It identifies two target areas: Beatons Creek and Marble Bar. The text notes that these areas are underlain by Fortescue Group rocks, which host multiple gold-bearing conglomerate occurrences. A detailed map of the Hamersley Basin shows the spatial relationship between these targets and regional landmarks like Port Hedland and Newman. An inset map of Western Australia highlights the Pilbara region's location relative to Perth and Kalgoorlie, emphasizing the scale of the 50km survey area.
Slide 9: Technical Validation of Gold Recovery
Slide 9 is perhaps the most critical for technical investors. It addresses 'Recognition of Gravity Recoverable Gold.' The company cites a June 2014 deportment study showing that ~98% of gold by weight is found in grain sizes larger than 150 microns. This is significant because larger grain sizes typically simplify the extraction process. The slide also mentions that GRG (Gravity Recoverable Gold) tests confirmed ~80% potential recovery. The visual evidence includes microscopic imagery of gold grains against a 1mm scale, providing tangible proof of the study's findings.
Slide 13: Physical Evidence and Core Samples
Continuing the theme of physical proof, Slide 13 shows the 'Occurrence of Gold in Conglomerates.' It features a photograph of a hand holding a piece of matrix from a boulder lag-type conglomerate, with arrows pointing to oxidized pyrite clasts. A secondary image shows a drill core (labeled D13-2) with fresh pyrite clasts. An inset photo titled 'Example of gold recovered from crushed matrix material' shows a collection of gold flakes in a pan next to a one-dollar coin for scale. This slide aims to bridge the gap between geological theory and physical reality.
Slide 17: The Oxide Reef Model
Using Leapfrog software, this slide presents a 3D visualization of the 'Oxide Reef Model.' The green highlighted areas represent the gold-bearing reefs within the topography of the site. The view is 'Looking down and northwest.' This type of modeling is essential for mining investors to visualize the volume and orientation of the ore body, which directly impacts the feasibility and cost of extraction.
Slide 21: The Selective Mining Concept
This slide introduces a major operational advantage. The 'Selective Mining Concept' states that 'No drilling and blasting [is] required.' Instead, the near-surface material can be 'ripped and pushed with a bulldozer.' The accompanying photo shows a Caterpillar bulldozer working in a trench. For an investor, this translates to significantly lower capital expenditure (CAPEX) and operating expenditure (OPEX) compared to traditional hard-rock mining which requires explosives and heavy crushing infrastructure.
Slide 25: Gravity Gold Recovery in Action
Slide 25 reinforces the simplicity of the extraction process. It shows a small-scale gravity recovery machine (a GoldQuest 1400) on a pallet next to a bag of ore. The right side of the slide shows the resulting gold flakes, ranging from ~50 microns to 1.4 mm, sitting in a pan next to a two-dollar coin. This visual repetition of 'ore to gold' is a classic mining pitch tactic to demonstrate that the process works in a field environment, not just a laboratory.
Slide 29: District Potential and Staged Growth
This slide outlines the future upside. The company views developing shallow oxide gold as the 'key to unlocking the potential of this gold district in a staged approach.' It maps out three distinct targets on a Google Earth overlay: 1) Phase 2 Shallow Oxide (200-300 Koz Au), 2) Shallow Sulfide (1.2 Moz Au potential), and 3) Deep Sulfide (3-5 Moz Au potential). By showing that the current project is just the first step in a much larger district-wide play, the company builds a case for long-term value appreciation.
Slide 33: Corporate Contact Information
The final slide provides the logistics for follow-up. It lists the corporate headquarters in Vancouver and a US office in Longmont, Colorado. A specific contact email and telephone number are provided for 'more information.' The background image of a drill rig in operation serves as a final reminder of the company's active status in the field.
What Novo Resources Corp. Does Well
The deck is exceptionally strong on technical proof. In the mining sector, 'seeing is believing,' and Novo provides ample photographic evidence of gold grains, core samples, and field equipment. They successfully communicate a complex geological thesis—that the Pilbara contains conglomerate-hosted gold similar to the Witwatersrand in South Africa—by focusing on the simplicity of their 'Selective Mining Concept.' By highlighting that they don't need to blast, they present a compelling economic argument for early-stage cash flow.
What is Missing from the Deck
While the deck is geologically sound, it is missing several key components found in high-quality investor presentations. First, there is no slide dedicated to the management team or board of directors. In mining, the 'jockey' is often as important as the 'horse,' and investors want to see a track record of successful mine development. Second, the deck lacks a clear financial summary or 'sources and uses' table. While it mentions target ounces, it does not provide an estimated cost per ounce or a timeline to full-scale production. Finally, there is no explicit 'ask'—it is unclear how much capital the company is looking to raise or what the specific valuation milestones are for the next 12-24 months.
Lessons for Founders
Founders in heavy industry or deep tech can learn from Novo's use of 'Scale Comparison.' By placing gold flakes next to common coins (Slide 13, 25), they make the data instantly relatable to a non-expert. Furthermore, the use of 3D modeling (Slide 17) to visualize a hidden asset is a powerful way to build investor confidence. However, founders should ensure they don't neglect the 'People' aspect of the pitch; even the best geological asset needs a capable team to bring it to market. Always include a team slide that highlights relevant operational successes.
Frequently asked questions
- What is the primary mining method proposed by Novo Resources?
- Novo Resources proposes a 'Selective Mining Concept.' As detailed on Slide 21, this method avoids traditional drilling and blasting. Instead, the near-surface material is ripped and pushed using a bulldozer. This approach is intended for the shallow oxide gold mineralization found at the Beatons Creek site, aiming for a lower-cost entry into production compared to deep-vein mining.
- What are the expected gold recovery rates for the Beatons Creek project?
- According to Slide 9, gravity gold recovery tests conducted in late 2014 confirmed a high potential recovery rate of approximately 80%. This is supported by a deportment study from June 2014, which found that 98% of the gold by weight is found in grains larger than 150 microns, making it suitable for gravity-based separation.
- Where are the company's operations and headquarters located?
- The company's primary exploration projects are located in the Pilbara region of Western Australia, specifically the Hamersley Basin (Slide 5). However, corporate headquarters are located in Vancouver, BC, Canada, with an additional US office in Longmont, Colorado (Slide 33).
- What is the long-term exploration strategy outlined in the deck?
- The strategy is a staged approach. Slide 29 explains that Novo intends to develop shallow oxide gold mineralization first to achieve positive cash flow. Once cash flow is established, they will target additional shallow oxide, shallow sulfide (1.2 Moz Au potential), and eventually deep sulfide targets (3-5 Moz Au potential) located over 70 meters below the surface.
- Does the deck include financial projections or a specific funding ask?
- The provided slides do not include a formal 'ask' (amount of capital sought) or detailed financial projections such as P&L or balance sheets. The deck is primarily a technical and geological validation document intended for the 2015 Precious Metals Investment Symposium to attract interest from sector-specific investors.