The August 2024 Oyo Investor Deck serves as a progress report on the company's 'Business Transformation' journey, moving away from high-burn expansion toward sustainable profitability. The core narrative centers on reaching ₹229Cr in Profit After Tax (PAT) for FY24, a stark contrast to the ₹1,941Cr loss in FY22. The deck emphasizes operational efficiency, showing a massive reduction in employee and G&A expenses, alongside a strategic deleveraging effort that brought the Net Debt/EBITDA ratio down from 10x to 3.3x. While the deck lacks a formal 'Ask' or 'Team' slide in this selection, it provi…
Key takeaways
- Oyo achieved its first-ever PAT positive year in FY24 with ₹229Cr, according to slide 5.
- The company has significantly reduced its Net Debt/EBITDA ratio from 10x in FY23 to 3.3x in FY24, as shown on slide 11.
- Operational efficiency is highlighted by an 88% reduction in employee benefit expenses and a 91% reduction in G&A expenses from FY20 to FY24 on slide 17.
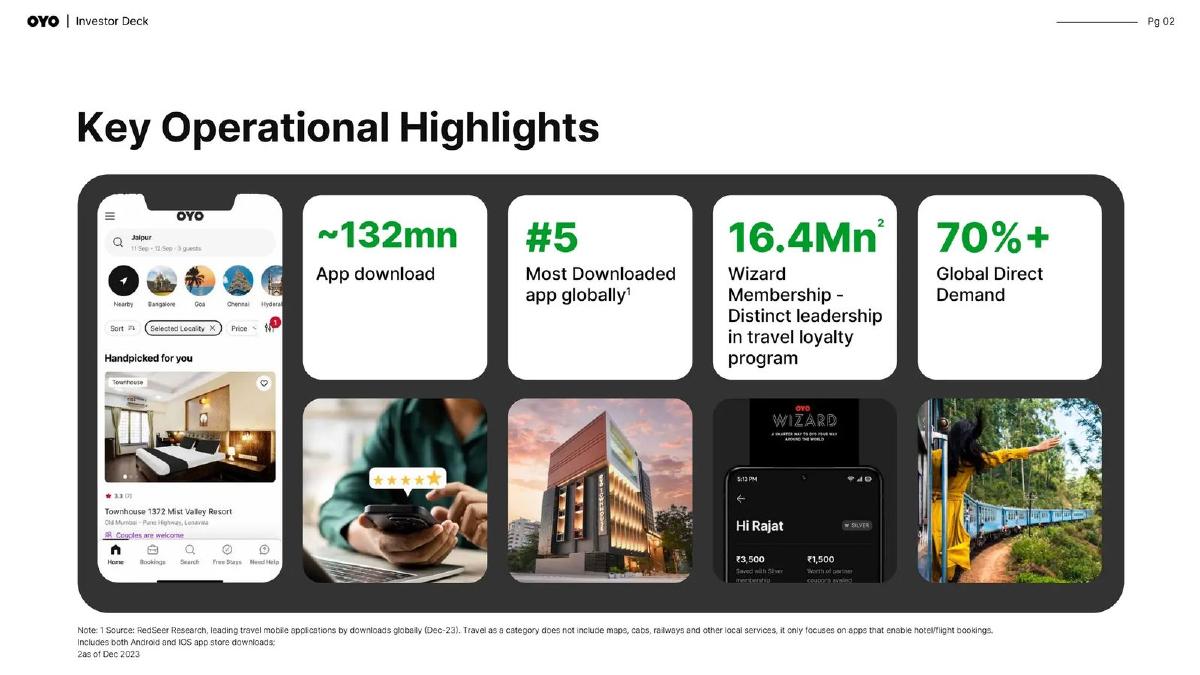
- The platform maintains strong direct demand, with over 70% of demand coming through global direct channels per slide 2.
- Oyo ranks as the #5 most downloaded travel app globally with approximately 132 million downloads, cited on slide 2.
- The company is aggressively integrating Gen-AI, targeting 85% voice query automation and 90% email automation by the end of 2024, as detailed on slide 23.
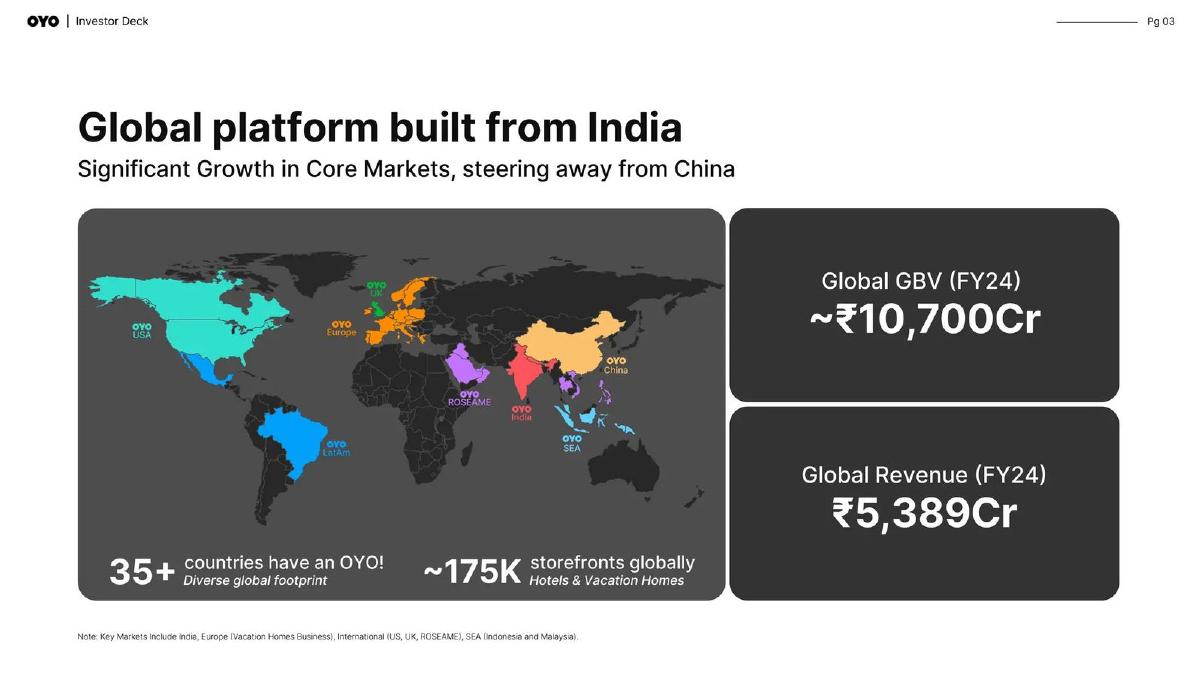
- Revenue for FY24 stood at ₹5,389Cr, showing a slight decrease from FY23's ₹5,464Cr, though gross margins improved to 46% on slide 8.
- The business has shifted to a 'Core Growth Market' strategy, with 95% of storefronts now located in India, Europe, USA, and Indonesia per slide 17.
Slide 1: Title and Brand Presence
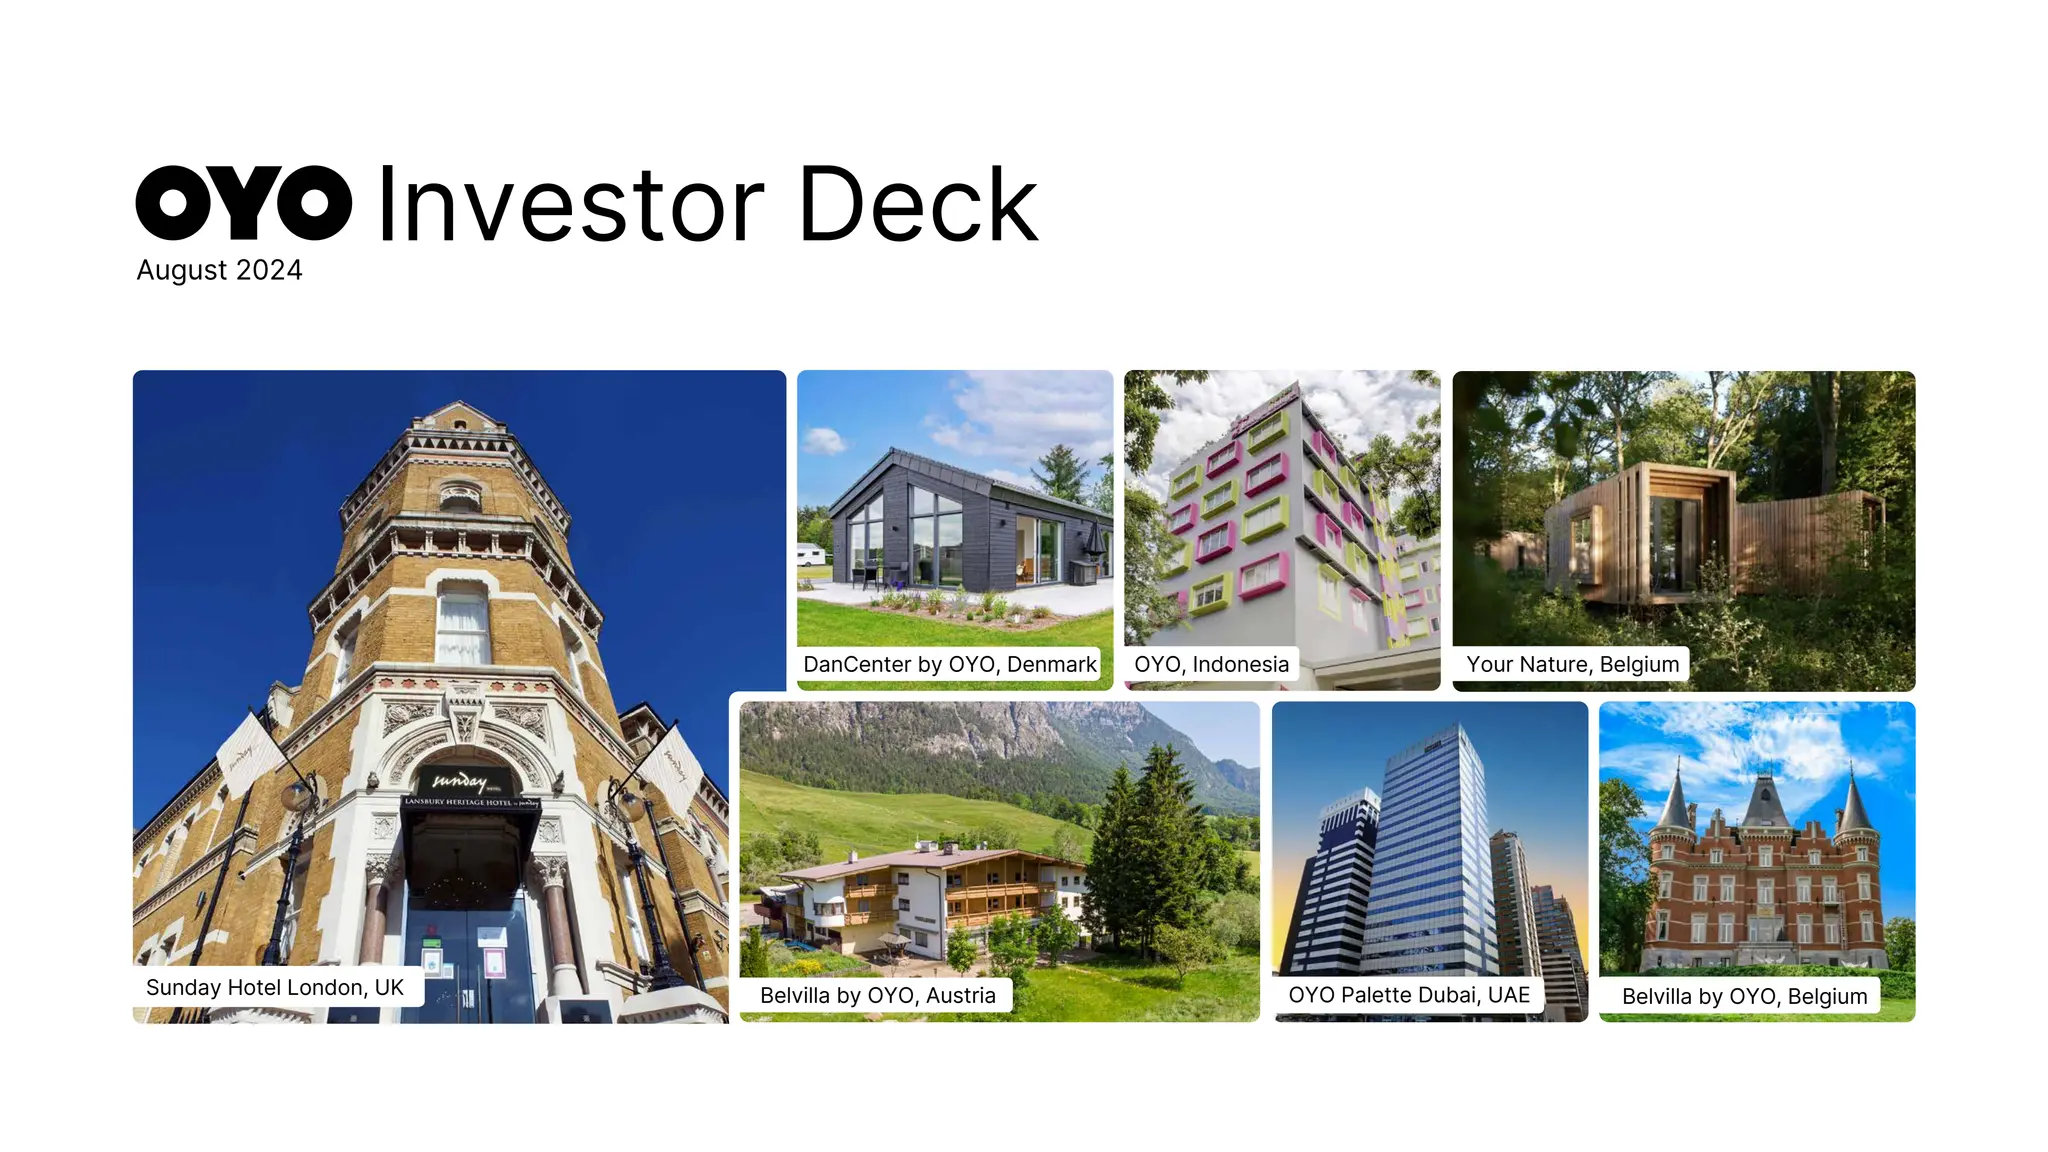
The cover slide establishes the brand's global reach through a collage of diverse property types, ranging from the Sunday Hotel in London to holiday homes in Denmark and Belgium, and high-rise hotels in Dubai. The date is clearly marked as August 2024, positioning this as a very recent update on the company's status. The visual emphasis is on 'premiumization,' moving away from the budget-only image the brand once held.
Slide 2: Key Operational Highlights
This slide focuses on scale and user engagement. It claims ~132 million app downloads and a ranking as the #5 most downloaded travel app globally, citing RedSeer Research. A critical metric here is the '70%+ Global Direct Demand,' which suggests Oyo has successfully reduced its reliance on third-party Online Travel Agencies (OTAs), thereby preserving margins. The 'Wizard' loyalty program is also highlighted with 16.4 million members, indicating a strong recurring customer base.
Slide 5: Financial Performance Summary
This is the 'pivot' slide of the deck. It leads with a headline of ₹888Cr EBITDA and ₹229Cr PAT (Profit After Tax) for FY24. The slide breaks down the performance into five pillars: Revenue (₹5,389Cr), Gross Margin (46%), Operating Expenses (₹1,616Cr), EBITDA, and PAT. The most significant note is the 'First ever PAT positive year,' signaling to investors that the era of cash burn is over. It also mentions a shift toward 'deleveraging and optimizing interest expense' as the next strategic phase.
Slide 8: Detailed Key Financials
Slide 8 provides a three-year comparative view (FY22-FY24). While Revenue from Operations grew from FY22 (₹4,781Cr) to FY23 (₹5,464Cr), it saw a slight dip in FY24 to ₹5,389Cr. However, the quality of that revenue improved: Gross Profit Margin rose from 40% to 46%, and Contribution Margin rose from 37% to 44%. Most notably, Operating Expenses (Employee & G&A) were slashed from ₹1,617Cr in FY22 to just ₹817Cr in FY24, a nearly 50% reduction in two years. This explains how the company reached PAT positivity despite flat top-line growth.
Slide 11: Balance Sheet and Debt Management
This slide addresses the company's liability profile. As of March 31, 2024, Net Debt stands at ~$345 million. The company highlights a voluntary prepayment of ~$195 million in debt during FY24, funded by internal accruals. This move reduced the Net Debt/EBITDA ratio from a precarious 10x in FY23 to a much more manageable 3.3x in FY24. The stated goal is to continue this deleveraging to further reduce interest costs, which currently eat into the bottom line.
Slide 14 & 20: Section Breakers (M&A and Year Ahead)
Slide 14 introduces the M&A section with a high-quality black-and-white image of a Paris duplex, suggesting a focus on European expansion or high-end acquisitions. Slide 20, 'YEAR AHEAD!', uses a similar aesthetic with the Sunday Hotel in Manesar, India. These slides serve as visual transitions but do not contain specific data points in this selection.
Slide 17: Business Transformation Journey
This slide explains 'how' the financial turnaround happened. It details a three-step process: 1) Streamlining the footprint to 95% storefronts in core markets; 2) Moving to a revenue-share model and eliminating fixed payout commitments (which dropped from 14.7% of storefronts in FY19 to just 0.1% in FY24); and 3) Tech-led cost reductions. The slide claims massive reductions in cost items from FY20 to FY24: Employee benefits down 88%, G&A down 91%, and Marketing down 63%.
Slide 23: Gen-AI Initiatives
The final slide in this selection looks at future efficiency gains through Generative AI. Oyo is targeting three areas: Consumer Conversion (AI-generated review summaries), Customer Service (Voice and Email bots), and Developer Efficiency (downtime identification bots). The specific targets—85% voice query automation and 90% email automation by the end of 2024—suggest that the company intends to maintain its lean headcount even if it resumes aggressive growth.
What Oyo's Deck Does Well
The deck is exceptionally transparent about the company's transition from a growth-at-all-costs model to a profitability-first model. By showing the multi-year trend of reducing fixed payout commitments and G&A expenses, the management builds a credible case that the FY24 profit is not a one-time accounting fluke but the result of structural changes. The use of the Net Debt/EBITDA ratio is a sophisticated touch that speaks directly to institutional investors and lenders concerned about the company's solvency and interest coverage.
What is Missing from the Deck
In the provided selection, there is no 'Team' slide, which is unusual for a company that has undergone such a massive cultural and operational shift. While the founder, Ritesh Agarwal, is well-known, the broader leadership team responsible for the 'Business Transformation' is not highlighted. Additionally, there is no explicit 'Ask' or valuation discussion, though this is common for a late-stage company or one preparing for an IPO where such details are often handled in private supplements or formal prospectuses. The deck also lacks a detailed competitor analysis, which would be useful to understand how Oyo's new lean model compares to traditional hotel chains or other tech-enabled aggregators like Airbnb or Booking.com.
Founder Takeaways: The Art of the Turnaround Narrative
Founders should study slide 17 as a masterclass in explaining a strategic pivot. Instead of hiding the fact that they shrunk their footprint or changed their contract terms, Oyo frames these as 'Streamlining' and 'Simplifying.' They use clear bar charts to show the decline of 'bad' metrics (fixed payouts) and the rise of 'good' metrics (gross margins). Furthermore, the inclusion of Gen-AI initiatives (Slide 23) is a smart way to signal that the company is not just cutting costs, but is using technology to ensure those costs stay low permanently. This transforms a 'cost-cutting' story into a 'tech-efficiency' story, which is much more attractive to venture and private equity investors.
Frequently asked questions
- Is Oyo currently profitable according to this deck?
- Yes, slide 5 explicitly states that FY24 was Oyo's 'First ever PAT positive year,' delivering ₹229Cr in Profit After Tax. This follows a period of significant losses, including a ₹1,941Cr loss in FY22. The deck attributes this turnaround to a multifold increase in EBITDA, which reached ₹888Cr in FY24, and a drastic reduction in operating expenses.
- What is Oyo's current debt situation?
- As of March 31, 2024, Oyo reports a Gross Debt of approximately $449 million and a Cash balance of $104 million, resulting in a Net Debt of $345 million. Slide 11 highlights that the company voluntarily prepaid $195 million of debt in FY24 using internal accruals, which is expected to save $27 million in annual interest costs.
- How has Oyo's business model changed over the last four years?
- Slide 17 outlines a 'Business Transformation' involving three steps: streamlining the footprint to four core markets (India, Europe, USA, Indonesia), simplifying contract structures to eliminate fixed payout commitments, and adopting a tech-led 'OYO 360' model. This shift moved the company from a high-risk fixed-minimum-guarantee model to a revenue-share arrangement.
- What role does Artificial Intelligence play in Oyo's future strategy?
- Oyo is heavily investing in Gen-AI for three areas: consumer conversion (summarizing user reviews), customer service (voice and email bots), and developer efficiency. Slide 23 notes that they aim to automate 85% of voice queries and 90% of emails by the end of 2024, which supports their goal of keeping operating expenses low.
- What are Oyo's primary markets now?
- According to slide 17, Oyo has consolidated its operations to focus on 'Core Growth Markets.' Currently, 95% of its storefronts are located across India, Europe, the USA, and Indonesia. This represents a strategic retreat from a more fragmented global presence to markets where they have established leadership and proven unit economics.