Pace Oil and Gas provides a highly technical investor update from March 2012, positioning itself as an 'intermediate-sized real growth company.' The deck is characterized by an intense focus on operational metrics, specifically reserve replacement and the transition from natural gas to higher-margin oil and NGLs. With a 2012 CapEx budget of $90-$100 million, the company aims for production between 14,500 and 15,250 boe/d. The presentation relies heavily on geological maps, production decline curves, and detailed tables of Proved and Probable (2P) reserves. While it lacks a traditional 'proble…
Key takeaways
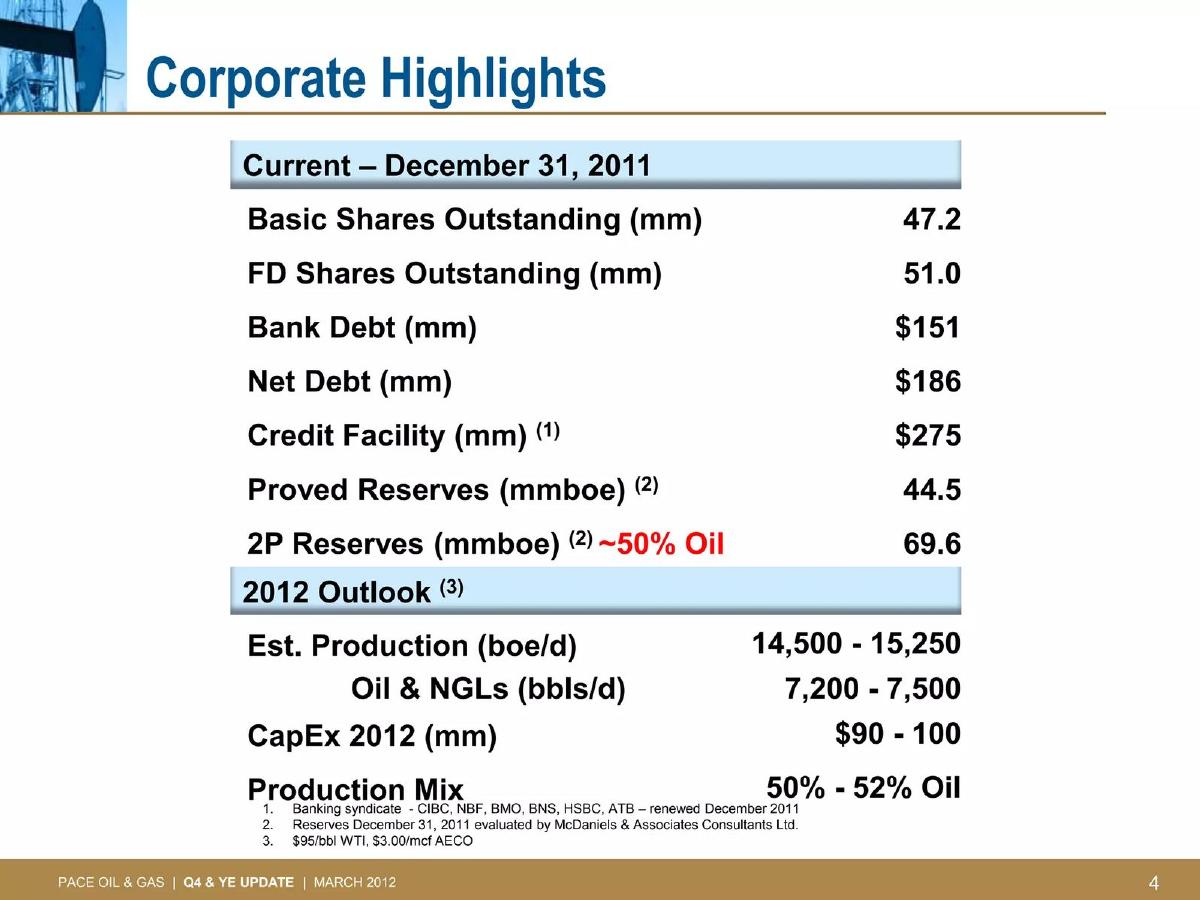
- The company reported 44.5 mmboe in Proved Reserves and 69.6 mmboe in 2P Reserves as of December 31, 2011 (Slide 4).
- Pace achieved a 268% replacement rate for oil and NGLs production in 2011, with a weighted average recycle ratio of over 2.1x (Slide 7).
- The 2012 production mix is targeted at 50% to 52% oil, reflecting a strategic shift toward liquids to increase netbacks (Slide 4).
- A significant portion of the 2012 CapEx ($35-$40 million) is allocated to the Southern Alberta Glauconite/Lithic/Pekisko waterflood project (Slide 13).
- The Haro Pekisko resource play is identified as a major upside, with an estimated 300 to 600 unrisked locations and a 35-75% rate of return (Slide 22).
- Enhanced recovery potential is quantified at 275.9 mmbbls of total Pace upside, primarily driven by polymer and ASP techniques (Slide 25).
- The company maintains high operational control, with a 2012 plan to drill 33 gross wells, resulting in 27 net wells (Slide 13).
- Financial stability is highlighted through a $275 million credit facility against $186 million in net debt (Slide 4).
Executive Summary and Corporate Positioning
Slide 1: Title Slide
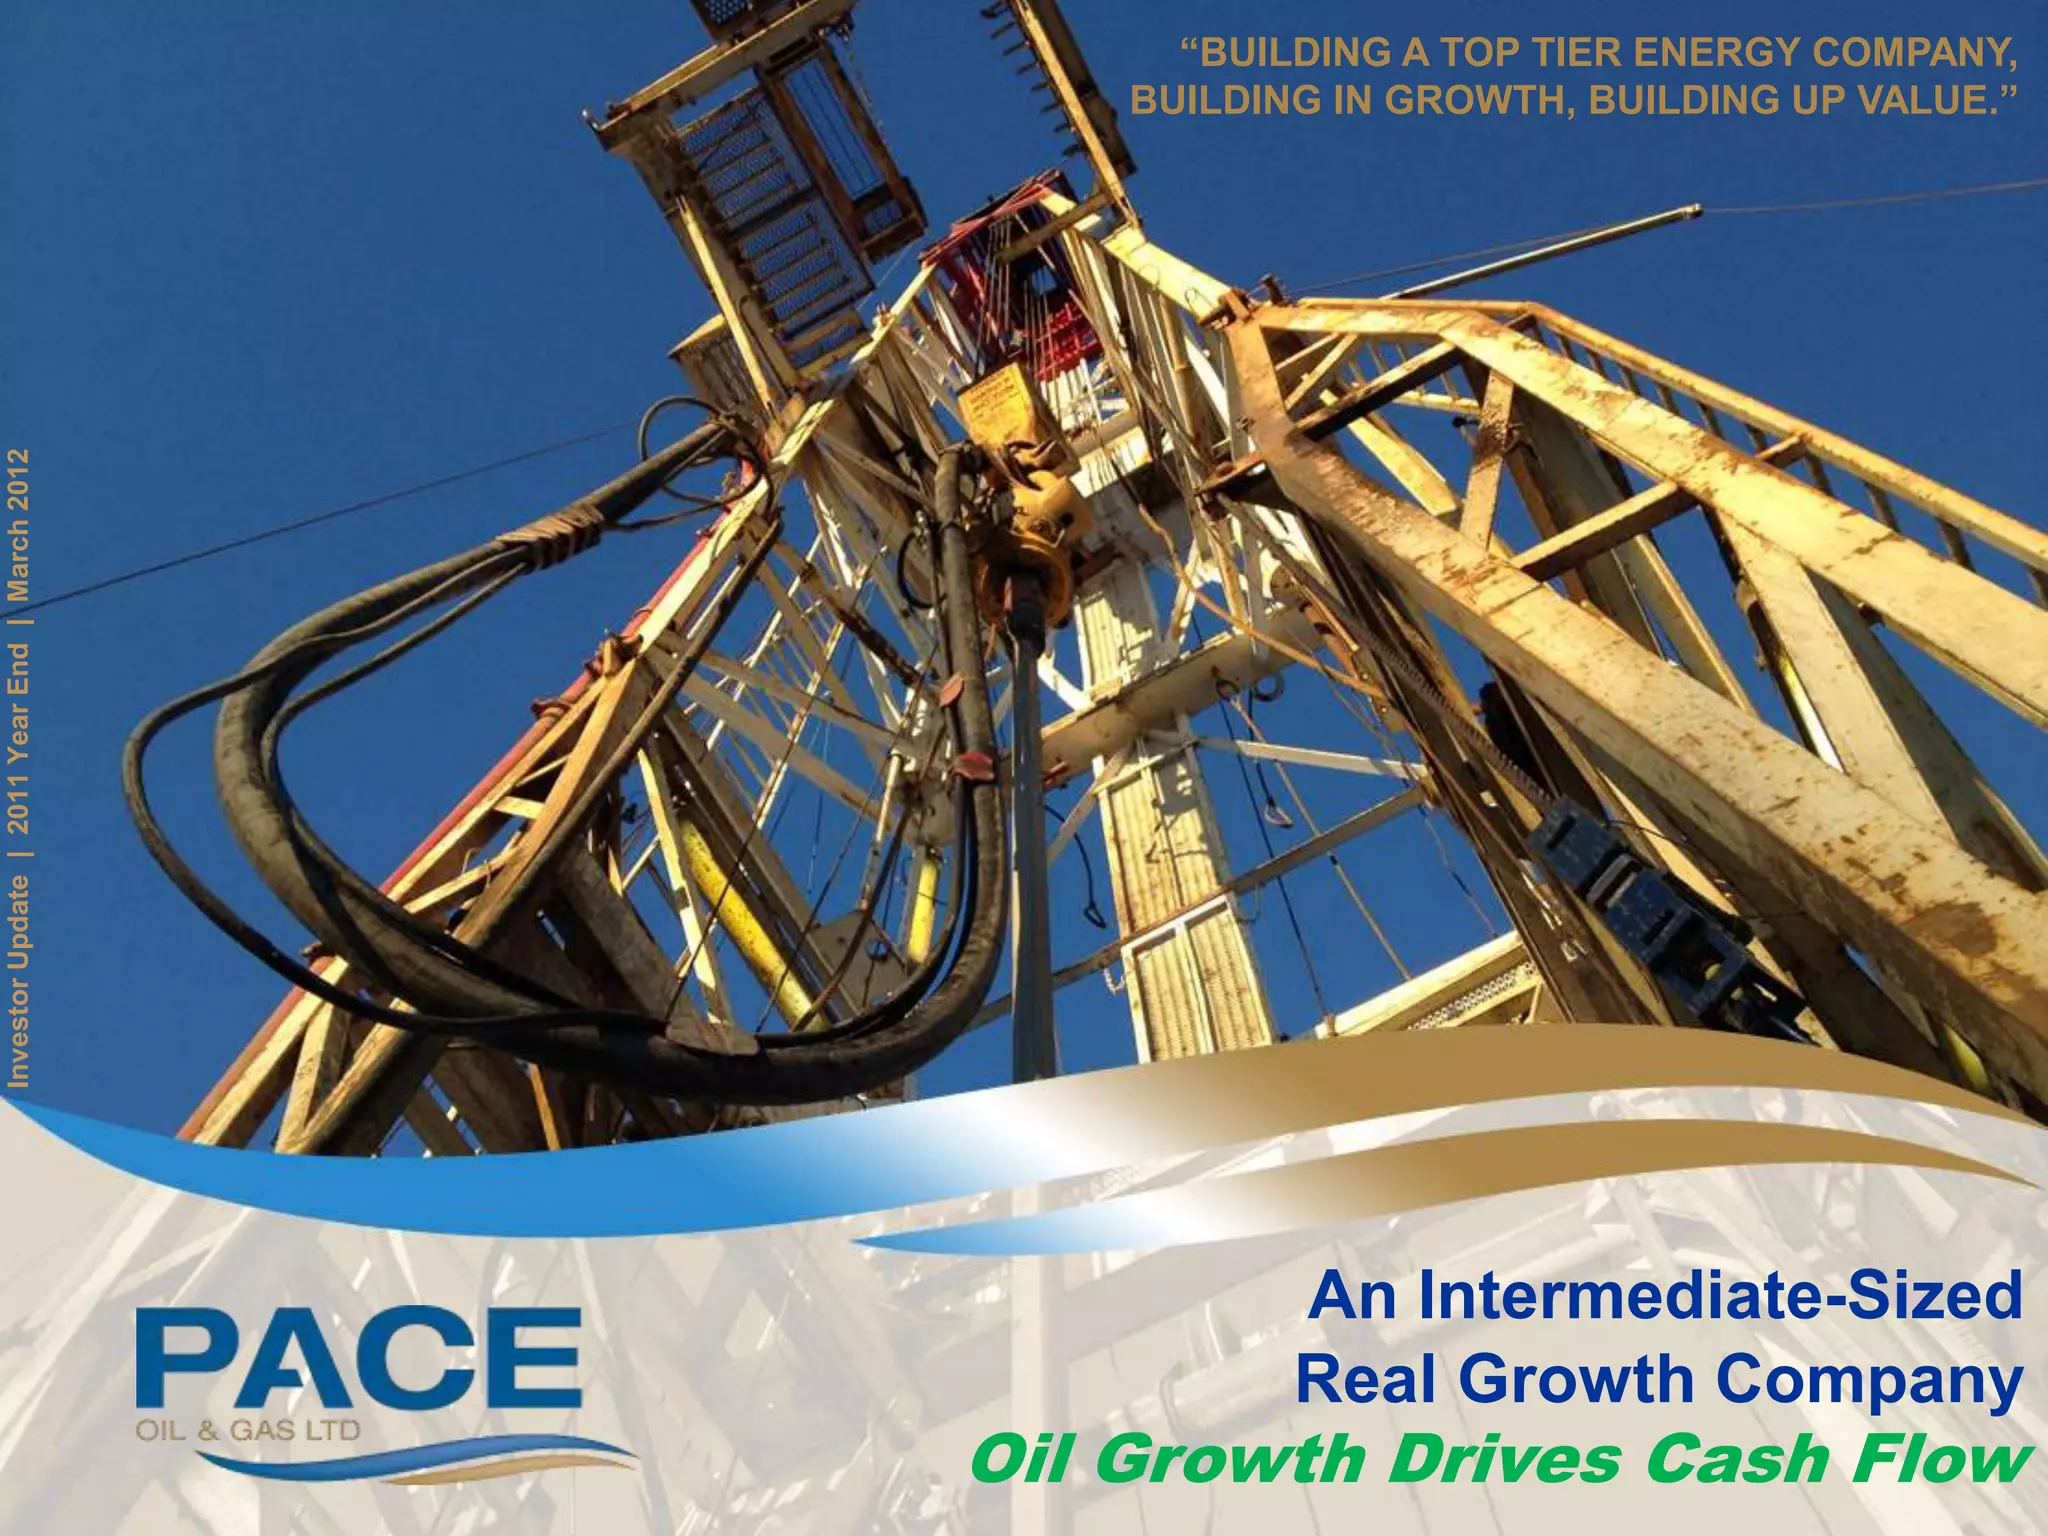
The cover slide establishes the company's identity as 'Pace Oil & Gas Ltd.' and sets a clear strategic tone with the tagline: 'An Intermediate-Sized Real Growth Company' and 'Oil Growth Drives Cash Flow.' The visual of a drilling rig reinforces the industrial nature of the business. The slide is dated March 2012 and references a 2011 Year End update.
Slide 4: Corporate Highlights
This slide provides a snapshot of the company's capital structure and reserve base as of December 31, 2011. Key figures include 47.2 million basic shares outstanding and 51.0 million fully diluted shares. The financial position shows $151 million in bank debt and $186 million in net debt, supported by a $275 million credit facility. The reserve data is critical for an energy company: 44.5 mmboe in Proved Reserves and 69.6 mmboe in 2P Reserves, with the latter being approximately 50% oil. The 2012 outlook forecasts production of 14,500 to 15,250 boe/d and a CapEx budget of $90 to $100 million.
Operational Performance and Efficiency
Slide 7: Pace Delivered Top Finding
This technical slide breaks down Finding, Development, and Acquisition (FD&A) costs. In 2011, Proved FD&A costs were $16.09/boe, an improvement over the 2010 figure of $17.81/boe. The slide highlights a major achievement in the footer: 'Pace replaced 268% of oil & NGLs proven production.' This indicates the company is adding reserves much faster than it is depleting them. The 2.1x recycle ratio on weighted average netback is a key metric for investors, suggesting high profitability per barrel found.
Slide 10: Increased Liquids Increases Netbacks/Cash Flow
Slide 10 uses three bar charts to compare Pace against its peers (identified by three-letter tickers like ZAR, NGL, CKE). The charts show a clear upward trend in the percentage of liquids in the production mix and a corresponding increase in operating netbacks. Most importantly, the bottom chart shows Pace leading its peer group in Cash Flow Per Share (CFPS) growth for the 2010/2011 period. This slide serves as the primary evidence that the 'Oil Growth' strategy is translating into financial outperformance.
Asset Portfolio and Growth Strategy
Slide 13: Significant Upside & Visible Long Term Growth Areas
This slide details the geographic distribution of assets across Alberta and British Columbia. It lists specific play types and their associated 2012 capital allocations. The Southern Alberta Glauconite/Lithic/Pekisko waterflood is the largest line item at $35-$40 million for 24 gross wells. The company emphasizes 'High Working Interest' and 'Operational Control,' which allows them to dictate the pace of development. The total 2012 plan involves 33 gross wells (27 net wells).
Slide 16: NNN & BBB Production Forecast
Focusing on the Retlaw Unit, this slide illustrates the impact of waterflood implementation. A production forecast graph shows a sharp decline in oil production (green line) being arrested and reversed by water injection (blue line). The 2012 plan for this specific area involves $5 million in net capital to add 400 bbl/d of production. The company claims a 52% Internal Rate of Return (IRR) for this project, demonstrating the high efficiency of secondary recovery in mature fields.
Slide 19: Peace River Arch - Red Earth Area
This slide provides a detailed land map of the Red Earth area, showing PACE locations (stars) and existing oil/gas wells. The key attributes listed include a total net acreage of 51,800 sections and a netback exceeding $60/boe. The 2012 plan for this region ($15-$20 million) involves drilling two horizontal wells and testing four others. This slide highlights the company's 'Top Quality light oil property' and the inventory of 50 wells.
Slide 22: Haro Pekisko Encouragement
Slide 22 focuses on a specific resource play with 'Unrisked 300 to 600 locations.' It provides a type curve for oil rates over 36 months and a table of economic metrics. The estimated NPV 10% per well is $2.0 - $2.4 million, with a rate of return between 35% and 75%. The netback for the first year is projected at $55 - $60/boe. This slide is intended to show the long-term 'runway' of the company's drilling inventory.
Enhanced Recovery and Conclusion
Slide 25: Pace Oil Enhanced Recovery
This is the most data-dense slide in the deck, featuring a table that calculates the 'Upside Potential' across various pools (Dixonville, Retlaw, etc.) using advanced recovery mechanisms like Polymer-SP and ASP. The 'Total Pace Upside' is calculated at 275.9 mmbbls. This slide quantifies the long-term value that can be unlocked from existing assets through technical expertise rather than just new exploration.
Slide 28: Contact Information
The final slide provides contact details for the executive team: Fred Woods (President & CEO), Judy Stripling (Executive VP & CFO), and Chad Kalmakoff (VP, Finance). It also lists the company's trading symbols on the TSX (PCE) and OTC (PACEF), confirming its status as a publicly traded entity at the time of the presentation.
What Pace Oil and Gas Does Well
The deck is exceptionally strong on technical validation. In the oil and gas sector, investors care about two things: reserves and the cost to extract them. Pace provides granular detail on both. By including third-party reserve evaluations (McDaniels & Associates) and detailed FD&A cost breakdowns, they build significant credibility. The use of decline curves and waterflood forecasts (Slide 16) provides a scientific basis for their growth claims, moving beyond mere speculation.
Furthermore, the peer benchmarking on Slide 10 is a masterclass in competitive positioning. Instead of just saying they are growing, they show they are growing faster than a dozen named competitors in the metrics that matter most to shareholders: cash flow and netbacks. This creates a sense of urgency and 'best-in-class' status.
What Is Missing from the Deck
The most notable omission is a comprehensive discussion of environmental, social, and governance (ESG) factors. While this deck is from 2012, even then, regulatory hurdles and environmental liabilities associated with waterflooding and chemical injections (ASP/Polymer) were significant risks. There is no mention of abandonment and reclamation obligations (ARO), which are critical for mature assets.
Additionally, while the deck mentions a $275 million credit facility, it lacks a detailed debt maturity schedule. For a company with $186 million in net debt, understanding when those obligations come due is vital for assessing liquidity risk, especially in a volatile commodity price environment. The deck also assumes relatively high commodity prices ($95/bbl WTI) in its footnotes, but does not provide a sensitivity analysis showing how the economics change if oil prices drop.
What Founders Should Copy
Founders in capital-intensive or technical industries should emulate the 'Operational Control' narrative found on Slide 13. By emphasizing that they own the majority interest and operate the wells, Pace signals to investors that they are the masters of their own destiny and not subject to the whims of larger partners. This is a powerful way to frame a company's ability to execute its strategy.
The 'Recycle Ratio' concept (Slide 7) is also worth copying for any business with high customer acquisition or asset acquisition costs. It clearly demonstrates the relationship between the cost of acquiring a unit of value and the profit generated by that unit. Whether you are selling software or extracting oil, showing that your 'recycle' or 'LTV/CAC' ratio is superior to the industry average is the fastest way to win over sophisticated investors.
Frequently asked questions
- What is the primary value proposition of Pace Oil and Gas?
- The value proposition centers on 'Oil Growth Drives Cash Flow.' The company focuses on acquiring and developing assets with high working interest and operational control in Western Canada. By shifting their production mix toward liquids (oil and NGLs), they aim to achieve higher operating netbacks and top-tier cash flow per share growth compared to their peer group.
- How does the company plan to use its 2012 capital expenditure?
- Pace allocated a budget of $90 to $100 million for 2012. The majority of this ($75-$90 million) is directed toward oil programs. Key projects include the Southern Alberta waterflood ($35-$40 million), the Dixonville Montney C waterflood ($15-$20 million), and the Red Earth Slave Point play ($15-$20 million). The goal is to match CapEx to cash flow.
- What technical methods are being used to increase production?
- The deck emphasizes Enhanced Oil Recovery (EOR) techniques. This includes traditional waterflooding, as well as more advanced methods like Polymer-SP (Surfactant-Polymer) and ASP (Alkali-Surfactant-Polymer) flooding. These methods are projected to significantly increase the Estimated Gross Ultimate Recovery (EUR) across their various pools, particularly in Dixonville and Retlaw.
- How does Pace compare to its peers in terms of financial performance?
- Slide 10 provides a comparative analysis showing Pace at the top of its peer group for Cash Flow Per Share (CFPS) growth from 2010 to 2011. It also shows a steady increase in liquids percentage and operating netbacks, moving from the middle of the pack toward the 'top tier' as they execute their oil-focused strategy.
- What are the specific reserve figures mentioned in the deck?
- As of the end of 2011, Pace reported 44.5 million barrels of oil equivalent (mmboe) in Proved Reserves and 69.6 mmboe in Proved plus Probable (2P) reserves. Notably, the 2P reserves are approximately 50% oil. The deck also highlights a total upside potential of 275.9 mmbbls through enhanced recovery programs.