Pacer International's May 2012 investor presentation serves as a comprehensive overview of a mature, publicly traded logistics leader (NASDAQ: PACR). The deck focuses heavily on the company's 'Transformational Journey,' moving from a debt-heavy position in 2008 to being debt-free with $19.1 million in cash by Q1 2012. With a core Intermodal Segment generating $1.2 billion, Pacer emphasizes its strategic relationship with Union Pacific, where it controls or accesses 42% of domestic containers. The presentation also details a rapid expansion into Asia freight forwarding and a diversified highwa…
Key takeaways
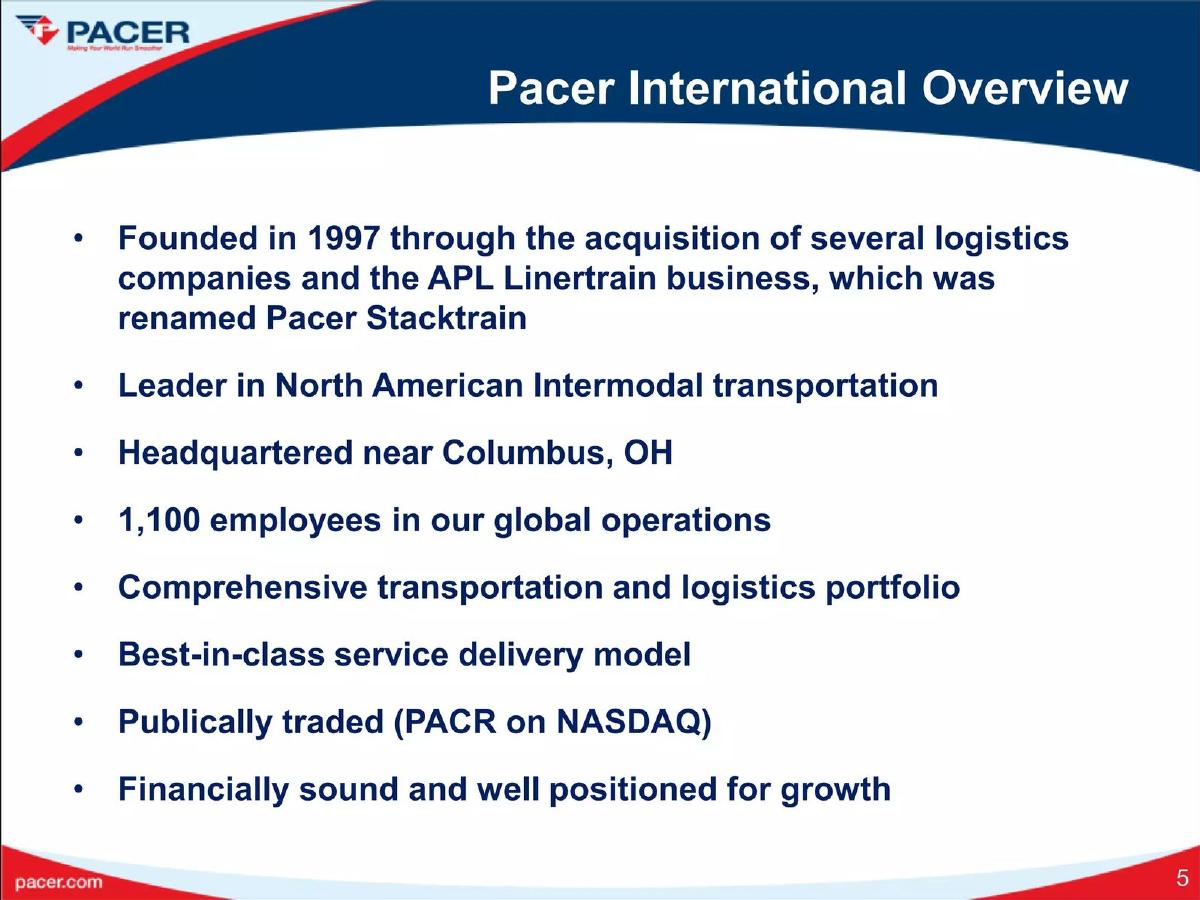
- Pacer was founded in 1997 through the acquisition of several logistics companies and the APL Linertrain business (Slide 5).
- The company's Intermodal Segment is valued at $1.2 billion, covering retail, automotive, ocean carrier services, and drayage (Slide 9).
- Pacer controls or has access to 42% of domestic containers, with 54% of that capacity on the Union Pacific railroad (Slide 13).
- The company achieved a debt-free status in 2011, a significant shift from a $39 million net debt position in 2008 (Slide 29).
- Asia freight forwarding operations expanded rapidly between 2009 and 2012, including the opening of offices in Hong Kong, Shanghai, and Singapore (Slide 21).
- Highway brokerage services are segmented into Dedicated, Brokerage, and JIT (Just-In-Time) models to balance growth and margins (Slide 25).
- By Q1 2012, the company held $19.1 million in cash and planned $8-10 million in IT-focused capital expenditures (Slide 29).
- The presentation identifies key leadership contacts, including the EVP/CFO and VP of Financial Planning & Analysis (Slide 33).
Pacer Investor Presentation: A Deep Dive into Intermodal Logistics
This investor presentation from May 2012 provides a detailed look at Pacer International, a major player in the North American logistics space. Unlike early-stage startup decks, this is a public company presentation designed to reassure shareholders of the company's stability, growth trajectory, and successful debt management. The deck is structured to show a transition from a legacy logistics provider to a modern, global, and financially lean organization.
Slide 1: Title Slide
The cover slide features the slogan "Smoother moves" and the company logo with the tagline "Making Your World Run Smoother." It clearly states the purpose: "Investor Presentation" and the date: "May, 2012." The design is corporate and clean, utilizing a red, white, and blue color palette that suggests a focus on North American infrastructure.
Slide 5: Pacer International Overview
This slide establishes the company's pedigree and scale. Key facts include:
Founded in 1997 via the acquisition of several logistics companies and the APL Linertrain business. · Headquartered near Columbus, OH. · 1,100 employees in global operations. · Publicly traded under the ticker PACR on NASDAQ.
The slide positions Pacer as a "Leader in North American Intermodal transportation" with a "best-in-class service delivery model." The final bullet point, "Financially sound and well positioned for growth," sets the stage for the financial data presented later in the deck.
Slide 9: Pacer Intermodal Segment
This slide focuses on the company's largest business unit, the Intermodal Segment, which it values at $1.2 billion. It lists four core service areas:
"Retail" (Door-to-Door) · Automotive · Ocean Carrier Services · Drayage
The use of a circular image showing Pacer-branded containers on a train reinforces the physical scale of their operations. This slide is meant to show where the bulk of the company's revenue and operational focus lies.
Slide 13: Flexible Rail Capacity Strategy
This is one of the most data-dense slides in the deck, showing "Domestic Container Capacity, by Provider and Western Railroad Relationship." It uses a bar chart to compare Pacer against competitors like JB Hunt, Schneider, and Swift. A prominent red call-out box states: "Pacer controls or has access to 42% of domestic containers." Furthermore, it highlights that 54% of this capacity is on the Union Pacific (UP) railroad. This slide demonstrates Pacer's dominant market share within a specific, high-value rail network.
Slide 17: Pacer's Transformational Journey
This slide uses a checklist format to show progress across multiple categories: Liquidity, Organization and Incentives, Customer Service, Carrier Relationships, Equipment Rightsizing, Systems, and SG&A. It uses green checkmarks for "completed" phases and yellow dots for "in process / planned." Notable completed items include becoming "Debt Free (2011)" and establishing a "Global presence (China WOFE, China offices, SE Asia)." This slide is crucial for showing investors that management is executing on a multi-year strategic plan.
Slide 21: Asia Freight Forwarding History
To emphasize their global expansion, Pacer provides a chronological timeline of their Asia operations from August 2009 to April 2012. The list includes the opening of offices in Hong Kong, Shanghai, Singapore, and Ningbo, as well as the granting of a "Class A Business License" in Shanghai in 2011. An image of the "Ocean World Lines / OWL Logistics" office in China provides visual proof of their international footprint.
Slide 25: Pacer Highway Brokerage Services Portfolio
This slide breaks down the non-rail side of the business into three categories:
Dedicated: Focuses on steady growth and long-term pricing with relatively low margins. · Brokerage: Driven by inside sales with higher margins and ad-hoc pricing. · JIT (Just-In-Time): Handles emergency shipments and surge needs for retailers and automotive manufacturers, offering high margins and 24x7 coverage.
The footer notes that all these offerings leverage the same technology and carrier community, suggesting operational efficiency across different service levels.
Slide 29: Balance Sheet
This slide is the financial climax of the deck. It features a bar chart showing "Net Debt" from 2008 to Q1 2012. The transformation is stark: from a $39 million debt in 2008 to a $19.1 million cash position in Q1 2012. The slide explicitly states that Pacer remains "debt free" and is focused on "maintain[ing] cash generation." It also mentions a planned $8-10 million in IT-focused capital expenditures for 2012, showing a shift from debt repayment to reinvestment in technology.
Slide 33: Investor Contacts
The final slide provides direct contact information for John Hafferty (EVP and CFO) and Steve Markosky (VP, Financial Planning & Analysis and Investor Relations). It includes their phone numbers and a photo of the Pacer logo displayed on the NASDAQ building in Times Square, reinforcing the company's status as a major public entity.
What Works in This Deck
The Pacer deck is an excellent example of a "turnaround" narrative. By clearly visualizing the transition from heavy debt to a cash-positive position (Slide 29), the company builds immediate credibility with investors. The use of specific market share data (Slide 13) provides a clear competitive moat, showing exactly where Pacer sits in relation to giants like JB Hunt. The "Transformational Journey" checklist (Slide 17) is also a highly effective way to communicate complex organizational changes in a digestible format.
What is Missing
As a public company deck, it lacks several elements common in startup pitches. There is no "Problem" slide, as the problem (moving freight) is well-understood. There is no specific "Ask" for capital, as the company is already funded and generating cash. Additionally, while the deck mentions "IT-focused Capital Expenditures," it does not detail the specific technology or software Pacer is building, which would be a central focus for a modern tech-enabled logistics startup.
What a Founder Should Copy
Founders should emulate Pacer's use of benchmarking . Slide 13 doesn't just say Pacer is big; it shows their capacity relative to every major competitor in their specific niche. This level of granular market analysis is very persuasive. Furthermore, the historical timeline of international expansion (Slide 21) is a great way to show momentum. Instead of just saying "we are global," showing the month-by-month rollout of new offices proves that the team can execute on a complex, multi-national strategy.
Frequently asked questions
- What is Pacer's primary business model according to the deck?
- Pacer operates as a North American intermodal transportation and logistics leader. Its primary revenue driver is the Intermodal Segment, which accounts for $1.2 billion in business. This includes door-to-door retail logistics, automotive transport, ocean carrier services, and drayage. They leverage a 'flexible rail capacity strategy' by maintaining deep relationships with major railroads like Union Pacific.
- How did Pacer's financial health change between 2008 and 2012?
- The deck highlights a major financial turnaround. In 2008, Pacer had a net debt of $39 million. Through a series of debt agreements and positive cash flow generation, they reduced this to $20.2 million in 2009 and $9.2 million in 2010. By 2011, they were debt-free with $24 million in cash, maintaining a $19.1 million cash position by Q1 2012.
- What is the significance of the Union Pacific relationship?
- Union Pacific (UP) is a critical partner for Pacer's domestic container capacity. Slide 13 shows that 54% of Pacer's capacity is on the UP. Pacer controls or has access to 42% of all domestic containers in that ecosystem, giving them a significant competitive advantage over other providers like JB Hunt or Swift in that specific network.
- What does Pacer's international footprint look like?
- Pacer has aggressively expanded into Asia through its 'Ocean World Lines' (OWL) brand. Between 2009 and 2012, they opened offices in Hong Kong, Shanghai, Singapore, Ningbo, and Xiamen. They also obtained a Class A Business License in Shanghai in 2011, allowing for comprehensive air and ocean freight operations across major Chinese logistics hubs.
- What are the three pillars of Pacer's Highway Brokerage services?
- Pacer categorizes its highway brokerage into three distinct portfolios: Dedicated (low margin, steady growth, long-term contracts), Brokerage (higher margins, ad-hoc pricing, inside sales-driven), and JIT/Just-In-Time (high margin, emergency shipments, 24x7 coverage). This diversification allows them to serve different customer needs while managing overall network visibility.