The PLAYSTUDIOS deck is a high-production investor presentation designed for a public market audience. Spanning 49 slides (17 analyzed here), it moves beyond simple game mechanics to pitch a 'Loyalty-as-a-Service' ecosystem. The company positions itself as a hybrid between a mobile game developer and a rewards platform, citing a massive $152.1B gaming TAM (Slide 6) and a proprietary 'playAWARDS' infrastructure (Slide 15). By showcasing a 27% projected revenue CAGR (Slide 45) and a clear path to 30% margins by 2025 (Slide 39), PLAYSTUDIOS argues that its model solves the 'Creator's Dilemma' of…
Key takeaways
- The gaming market is valued at $152.1B, with mobile gaming specifically at $68.5B as of 2019 (Slide 6).
- PLAYSTUDIOS claims 78% higher consumer engagement for brands that offer loyalty programs (Slide 12).
- The 'playAWARDS' platform includes eight distinct components, including a Partner Rewards Console and a VIP Player Portal (Slide 15).
- The company reports 4.2 million Monthly Active Users (MAU) with an average player age of 42 and an average income of $80K (Slide 24).
- User engagement is high, with players averaging 2.4 sessions per day and 56 minutes of daily play (Slide 24).
- Every product launched by the studio has achieved 150,000+ sustained Daily Active Users (DAU) within three weeks of cross-promotion (Slide 33).
- Revenue is projected to grow from $161.8M in 2017A to a forecasted $435.2M in 2022E (Slide 42).
- The company forecasts a 30% margin by 2025, driven by ad monetization and operational efficiencies (Slide 39).
Executive Summary: The SPAC Era Gaming Pitch
The PLAYSTUDIOS pitch deck is a comprehensive 49-slide document used for their 2021 SPAC merger. It is a highly polished, data-driven presentation that aims to convince institutional investors that PLAYSTUDIOS is not just a game developer, but a loyalty platform with a defensible moat. The deck focuses heavily on the 'playAWARDS' ecosystem, arguing that real-world rewards create a superior business model compared to traditional mobile gaming. With 4.2 million MAUs and a clear path to 30% margins, the deck provides the granular financial detail required for a public market debut.
Slides 1-3: Branding and Legal Framework
Slide 1 introduces the company with the tagline "IT'S MORE THAN A GAME." The visual style is consistent with high-end mobile gaming—bright colors and 3D character art. Slide 3 is a standard legal disclaimer required for SPAC transactions, mentioning the proposed business combination with Acies and the intent to file a Form S-4 with the SEC. This signals immediately that this is a late-stage, regulated investment opportunity rather than a seed-stage venture pitch.
Slides 6-9: Market Opportunity and Value Composition
Slide 6 establishes the "MASSIVE" market opportunity. It cites a 2019 TAM of $152.1B for gaming, which is larger than music ($21.5B), movies ($42.2B), and books ($113.9B). Mobile gaming specifically is carved out at $68.5B with a 38% growth rate. Slide 9 breaks down the "COMPOSITION OF VALUE" in traditional gaming, listing drivers like Method of Play, Depth of Play, Feature Breadth, Content Updates, Live Operations, and Social Media/Community. This sets the stage for PLAYSTUDIOS to introduce their unique seventh value driver: Loyalty.
Slides 12-15: The Loyalty Platform Moat
Slide 12 pivots to the efficacy of rewards, stating that 78% of consumers show more engagement with brands offering loyalty programs. It lists sectors like Dining, Airline, and Hotel where this is already proven. Slide 15 introduces "playAWARDS," the company's proprietary platform. The slide lists eight components: In-game myVIP Framework, In-game Store SDK, Partner Rewards Console, Game Developer Console, VIP Player Portal, Player Mgmt Console, Concierge/Host Program, and Special Events Program. This slide is critical as it positions the company as a technology provider, not just a content creator.
Slides 18-21: The Portfolio and Track Record
Slide 18 transitions to "OUR STORY," followed by Slide 21, which showcases their "FAMILY OF TOP-RANKED GAMES." The portfolio includes titles like myVEGAS Slots, myKONAMI Slots, POP! Slots, and myVEGAS Blackjack. The slide also lists several EGR and EKG awards from 2017 and 2018, providing third-party validation of their game quality. Two upcoming titles, myVEGAS Bingo and Kingdom Boss, are teased as "Coming Soon."
Slides 24-27: Audience Metrics and Revenue Growth
Slide 24 provides a deep dive into their "VALUABLE & LOYAL AUDIENCE." Key metrics include 4.2 Million MAU , a 55% female skew, an average age of 42, and an average income of $80K . Engagement is high at 56 minutes per day. Most notably, they claim 1.9 Million Reward Purchasers and 11+ Million Rewards Purchased to date. Slide 27 shows a "HISTORY OF REVENUE GROWTH," charting DAU against Monthly Revenue from July 2013 to July 2020. The chart intends to show that revenue (white line) continues to trend upward even when DAU (shaded area) plateaus, which they attribute to overcoming the "Creator's Dilemma."
Slides 30-33: Growth Strategy and UA Efficiency
Slide 30 outlines a four-pillar growth strategy: OPTIMIZE existing franchises, EXPAND the portfolio, ACQUIRE new games/networks, and DIVERSIFY the business model into Ad Monetization and Loyalty-as-a-Service. Slide 33 is perhaps the most important for unit economics. It shows that every product launched has achieved 150,000+ sustained DAU within 3 weeks of cross-promotion. This proves that their existing player network acts as a low-cost acquisition engine for new titles, a significant competitive advantage in an era of rising UA costs.
Slides 36-42: Financial Projections and Margins
Slide 36 introduces the "FINANCIALS" section. Slide 39 provides a bridge to margin growth, starting at a 12.0% margin in CY20 and forecasting a 30% margin by 2025 . The growth is attributed to Core Bus Op Ex (2.6%), E-Commerce (1.8%), Ad Mon (2.6%), and New Games Post Launch (3.2%). Slide 42 provides the P&L summary. Revenue is shown growing from $161.8M in 2017 to a projected $435.2M in 2022 . Adjusted EBITDA is projected to jump from $32.4M in 2020 to $89.9M in 2022 , representing a significant margin expansion from 12.0% to 20.7%.
Slides 45-48: Peer Comparison and Investment Highlights
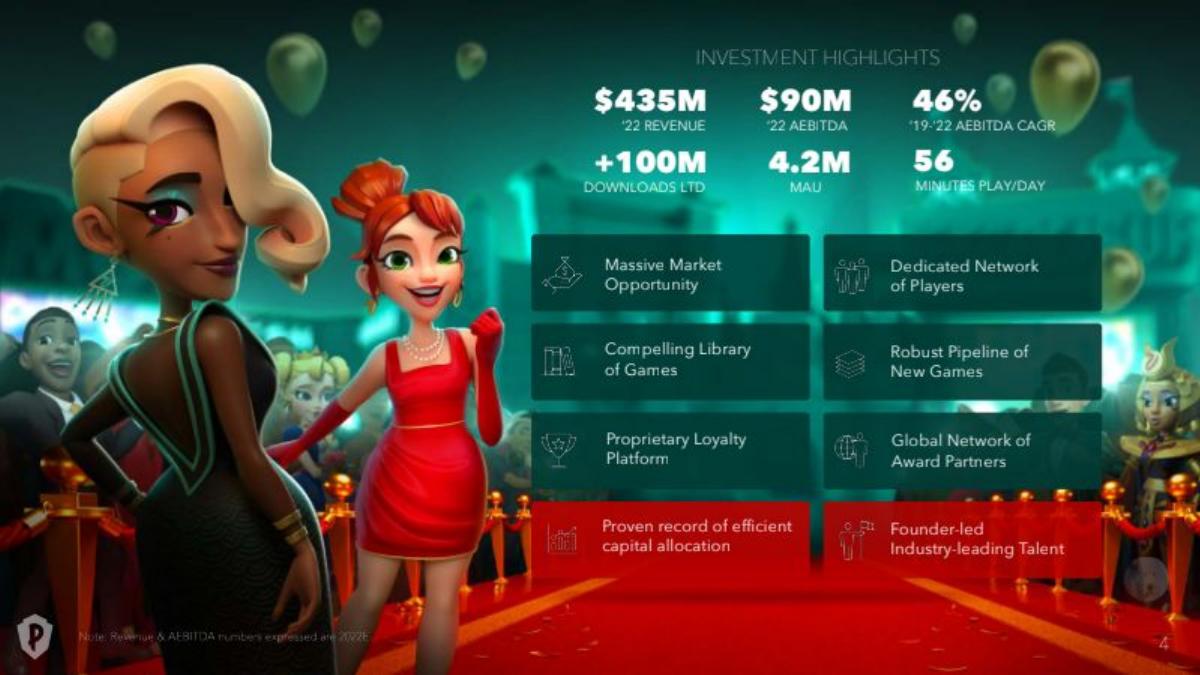
Slide 45 compares PLAYSTUDIOS to peers like Zynga, Glu, Playtika, and SciPlay. PLAYSTUDIOS claims a 27% Revenue CAGR (2020-2022E) versus a 16% peer average, and a 67% AEBITDA CAGR versus a 16% peer average. Finally, Slide 48 summarizes the "INVESTMENT HIGHLIGHTS," reiterating the massive market, proprietary loyalty platform, and founder-led team. The background imagery of MGM and Excalibur reinforces their deep ties to the Las Vegas hospitality industry.
What Works in the PLAYSTUDIOS Deck
Demographic Specificity: By highlighting the $80K average income and age 42 profile on Slide 24, they differentiate themselves from the "low-value" perception of casual gaming. · Network Effect Proof: Slide 33 provides concrete evidence that their platform reduces UA risk, which is the primary concern for gaming investors. · Clear Margin Bridge: Slide 39 doesn't just promise 30% margins; it breaks down exactly where that 18% improvement will come from (e.g., 2.6% from Ad Monetization). · Vertical Integration: The deck successfully pitches the company as a "Loyalty-as-a-Service" provider (Slide 30), which commands higher valuation multiples than a pure-play game studio.
What is Missing from the PLAYSTUDIOS Deck
Detailed Team Slide: While Slide 48 mentions a "Founder-led, Industry-leading Team," the 17 slides analyzed do not include a dedicated team slide with bios or past successes (e.g., former roles at major gaming companies). · Specific Acquisition Targets: Slide 30 mentions an "ACQUIRE" strategy, but there is no detail on the pipeline or the types of multiples they are willing to pay for external studios. · Risk Factors: As a SPAC deck, it is heavily weighted toward the "bull case." There is little mention of platform risks (Apple's IDFA changes) or the competitive landscape for real-world rewards. · Use of Proceeds: The deck lacks a specific slide detailing how the capital raised from the SPAC merger will be allocated between R&D, UA, and M&A.
Founder Takeaways: How to Pitch a Platform
Founders should study how PLAYSTUDIOS uses Slide 33 to prove their distribution advantage. If you are building a multi-product company, you must demonstrate that Product A makes Product B cheaper to launch. Furthermore, the "Creator's Dilemma" framing on Slide 27 is a brilliant way to address the common investor fear that games eventually die. By showing that revenue can decouple from DAU through better loyalty mechanics, they turn a perceived weakness into a strength. Finally, the use of third-party validation (awards on Slide 21 and market data on Slide 6) is essential for establishing credibility in a crowded sector.
Frequently asked questions
- What is the core business model of PLAYSTUDIOS?
- PLAYSTUDIOS operates a 'play-to-earn' casual mobile gaming model. Unlike traditional games that rely solely on in-app purchases, PLAYSTUDIOS integrates a proprietary loyalty platform called playAWARDS. This allows players to earn real-world rewards from over 250 partners, such as MGM and Excalibur, which in turn drives higher retention and attracts a more affluent demographic (average income of $80K) than typical casual games.
- How does the company justify its valuation against peers?
- The deck uses Slide 45 to show that PLAYSTUDIOS expects a 27% revenue CAGR and a 67% AEBITDA CAGR between 2020 and 2022. These figures are contrasted against gaming peers like Zynga (15% revenue CAGR) and Playtika (7% revenue CAGR). By demonstrating superior growth and a more efficient user acquisition model, they position themselves as a premium investment in the gaming sector.
- What are the key audience demographics for their games?
- According to Slide 24, the audience is 55% female and 45% male, with an average age of 42. This is a significantly more mature and financially stable audience than many mobile games, evidenced by the $80K average income. This demographic profile is likely a key selling point for their 250+ reward partners who want to reach high-value consumers.
- What is the 'Creator's Dilemma' mentioned in the deck?
- Slide 27 refers to the 'Creator's Dilemma,' which in mobile gaming typically involves the decay of Daily Active Users (DAU) and revenue over time as a game ages. PLAYSTUDIOS uses a chart to show that while their DAU might stabilize or dip, their revenue continues to grow through better monetization and loyalty mechanics, effectively 'countering' the traditional lifecycle decline of mobile apps.
- How does PLAYSTUDIOS handle user acquisition (UA)?
- The company relies heavily on its existing network for UA. Slide 33 demonstrates that they use 'loyalty mechanics and our player network to seed each new product.' This cross-promotion strategy allows them to reach 150,000+ sustained DAU for new games within just three weeks, reducing the reliance on expensive external marketing channels.