Plugger presents a compelling, albeit dated, vision for a physical utility network. By focusing on battery swapping—a solution for the era of removable smartphone batteries—the deck demonstrates strong early traction with $400,000 in sales across 100 stores by 2014. The narrative is driven by clear milestones: a successful pilot in Gangnam, South Korea, followed by rapid expansion through major retail partners like CVS and GS25. While the deck excels at showing growth and market fit, it lacks critical financial depth, omitting unit economics, burn rate, and a specific funding ask. It serves a…
Key takeaways
- The company validated its model with a 3-month test on Gangnam Street, achieving 5,000 swaps at $3 per swap (Slide 5).
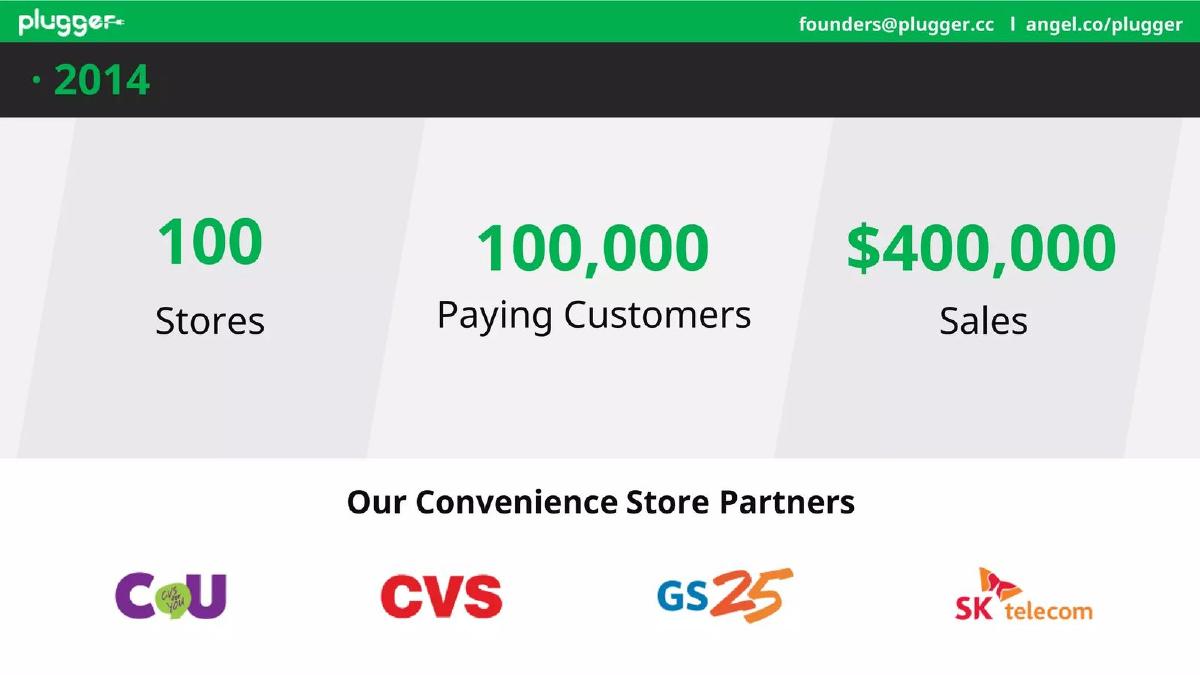
- By 2014, the startup had scaled to 100 stores and 100,000 paying customers, generating $400,000 in sales (Slide 6).
- Strategic partnerships with major retailers like CVS, GS25, and SK Telecom were central to their distribution strategy (Slide 6).
- The product evolved from internal battery swapping for Android to external power bank swapping for iPhone users (Slide 9).
- The growth strategy relied on a 'Push Notification' trigger, alerting users when their battery hit 10% to visit a nearby partner store (Slide 8).
- Projected revenue growth was aggressive, aiming to jump from $400,000 in 2014 to $10M in 2016 (Slide 11).
- The deck identifies Tokyo, Shanghai, and New York as primary expansion targets based on population density and smartphone penetration (Slide 10).
- There is a total absence of a team slide, competitive analysis, or a specific investment 'Ask' (Slides 1-13).
The Hook: Visualizing the Problem
Slides 1-2: Branding and Emotional Resonance
The deck opens with a mascot-driven cover slide featuring a superhero gorilla carrying a battery. The tagline, "Never Run Out Of Power Again," is a direct value proposition. Slide 2 reinforces this with a wordless, high-impact image of four young adults leaning against a wall, all looking at phones with red "low battery" icons superimposed over them. This is a classic 'show, don't tell' approach to identifying a universal pain point of the smartphone era.
The Solution: Physical Infrastructure
Slide 3: The Core Mechanism
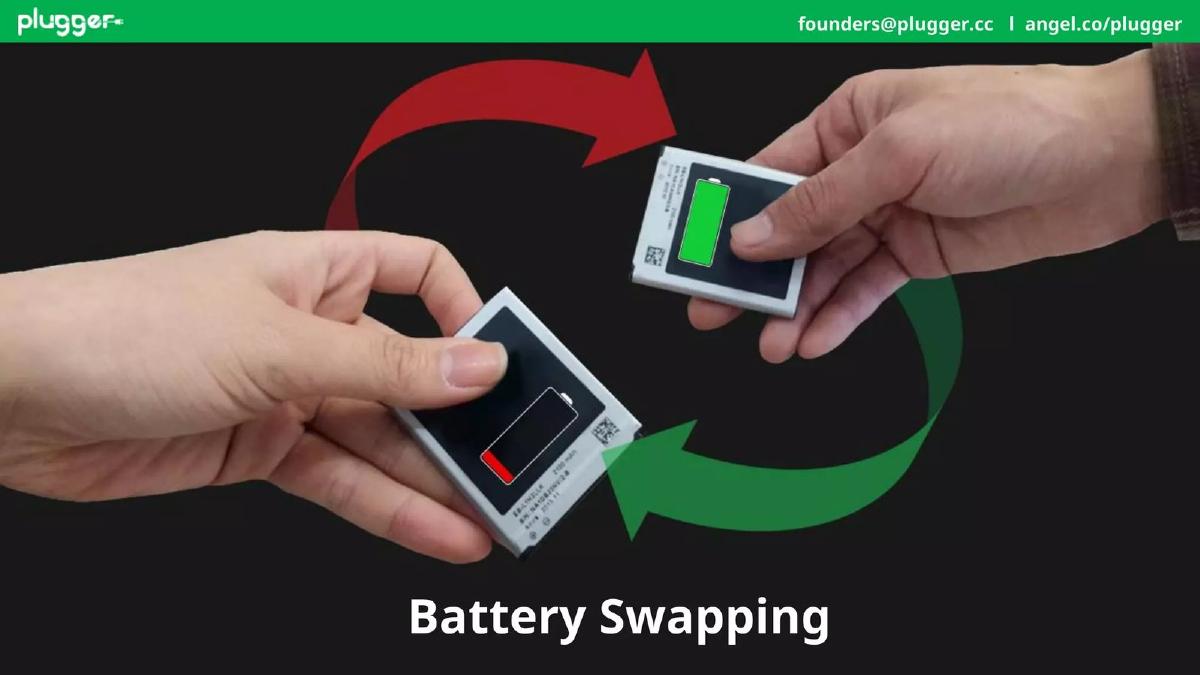
Slide 3 introduces "Battery Swapping" with a simple graphic of two hands exchanging a depleted battery for a charged one. At this stage in the deck, the solution is presented as a physical action rather than a complex technical process, which helps the investor immediately grasp the operational nature of the business.
Slide 4: Localized Validation
Using the cultural phenomenon of "Gangnam Style," Slide 4 announces, "Let's Test on Gangnam Street!" This indicates a hyper-local go-to-market strategy. By choosing one of the most densely populated and tech-forward districts in the world, the company set itself up for a high-probability success story to use as a case study for future expansion.
Traction and Proof of Concept
Slide 5: The Pilot Results
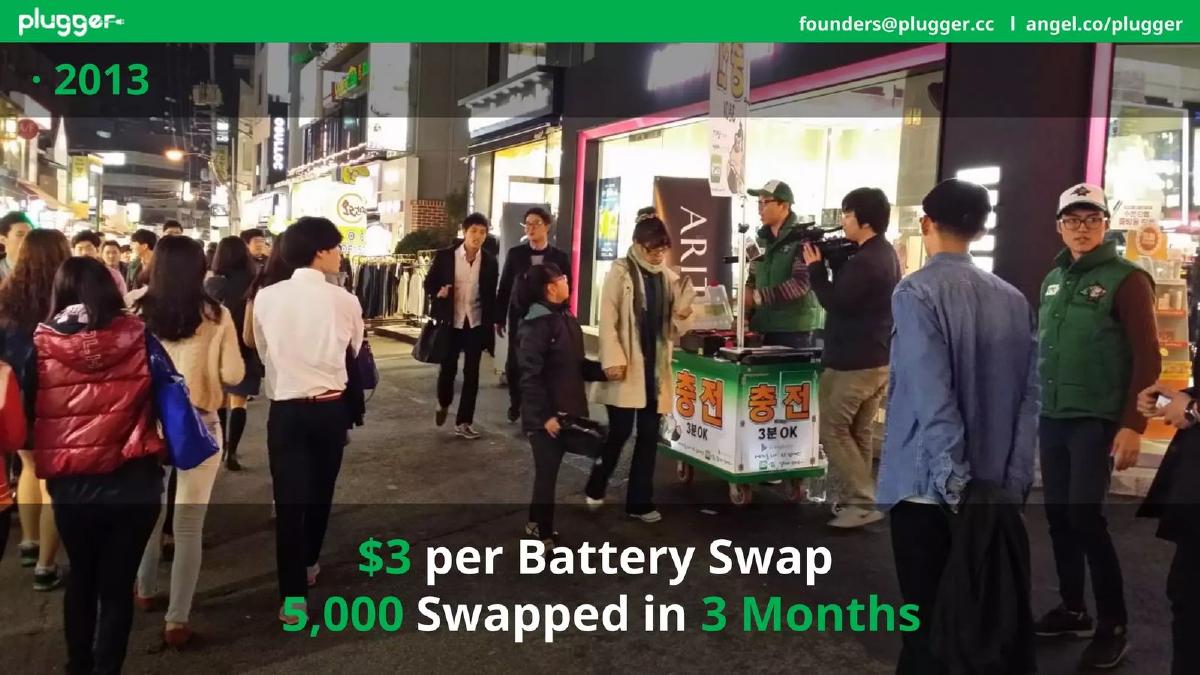
Slide 5 provides the first hard data points. During a 3-month test in 2013, Plugger achieved "5,000 Swapped in 3 Months" at a price point of "$3 per Battery Swap." The background image shows a physical kiosk on a busy street, proving that the service was operational in the real world and that customers were willing to pay a premium for convenience.
Slide 6: Scaling Through Partnerships
The 2014 traction slide (Slide 6) shows significant growth: 100 Stores , 100,000 Paying Customers , and $400,000 Sales . Crucially, it lists "Our Convenience Store Partners," including CU, CVS, GS25, and SK Telecom . This slide is the most important in the deck because it proves the business can scale through third-party retail infrastructure rather than expensive, company-owned storefronts.
Product and User Experience
Slide 7: The Expansion Strategy
Slide 7 visualizes the jump from 100 stores in 2014 to 1,000 stores in 2015 . It uses a map interface on a smartphone to show the increased density of service points. This density is critical for a convenience-based utility; if the user has to walk more than a few blocks, the value proposition of a "quick swap" begins to fail.
Slide 8: The App Loop
Slide 8 explains the user journey: Low Battery (10%) > Push Notification > Visit Store . This demonstrates that Plugger isn't just a hardware company; it's a software-driven service that captures users at the exact moment of need. This automated lead generation for partner stores is a secondary value proposition that could theoretically be monetized through advertising or referral fees.
Slide 9: Addressing Hardware Limitations
A common critique of battery swapping is the move toward sealed devices. Slide 9 addresses this by showing an "External Battery Swapping Program" for iPhone users. By swapping branded power banks instead of internal batteries, Plugger future-proofed its model against changes in smartphone manufacturing.
The Future: Global Ambitions
Slide 10: Market Selection Criteria
Slide 10 identifies expansion targets: Tokyo, Shanghai, and New York . The criteria for selection are "similar smartphone penetration & population density" to South Korea. This shows a logical, data-driven approach to international growth, focusing on urban centers where foot traffic is highest.
Slide 11: Revenue Projections
The growth chart on Slide 11 is a standard "up and to the right" visualization. It projects $10M in sales and 2,000 stores by 2016. The chart ties revenue directly to store count, which is a transparent way to show how the business scales, though it doesn't account for varying revenue per store in different international markets.
Slides 12-13: The Vision and Contact
Slide 12 shows a world map with pins across every continent, labeled "Global Battery Swapping Service." This is the "big vision" slide intended to excite investors about the potential for a worldwide utility network. Slide 13 concludes with the logo and contact information.
What Works in This Deck
Clear Traction: The deck does an excellent job of showing a progression from a single-street pilot to 100 stores and then to 1,000 stores. The $400,000 revenue figure on Slide 6 provides a solid baseline for valuation.
Strategic Partnerships: Listing major brands like CVS and SK Telecom (Slide 6) provides massive social proof. It tells investors that large corporations have already vetted and integrated the Plugger service.
Problem-Solution Fit: The use of push notifications triggered by battery levels (Slide 8) is a clever way to solve the discovery problem. It moves the service from something a user has to remember to something that finds the user when they are in distress.
What Is Missing
The Team: There is no team slide. We know Neil Choi is the CEO from the cover, but we know nothing about his background or the technical/operational expertise of the rest of the leadership. This is a critical omission for any venture-stage deck.
The Ask: The deck never specifies how much money is being raised or what the terms are. Without an "Ask" slide, the deck feels more like a company profile than a fundraising tool.
Unit Economics: While we see the $3 swap price, we don't see the cost of the batteries, the revenue share with the convenience stores, or the customer acquisition cost (CAC). Investors need to know if the $3 covers the operational overhead and hardware depreciation.
Competition: The deck ignores the existence of cheap portable power banks, charging stations, and other battery-swapping competitors. A slide addressing why Plugger's network is superior to a user simply carrying their own $20 power bank is necessary.
Founder's Playbook: What to Copy
The Pilot-to-Scale Narrative: Founders should emulate how Plugger used a small, controlled test (Gangnam Street) to prove a concept before showing how that concept maps to a larger retail network. It makes the 1,000-store goal feel earned rather than guessed.
Visualizing the Trigger: If your product relies on a specific user behavior or moment of need, visualize that moment as Plugger did on Slide 8. Showing the push notification makes the technology feel real and the user acquisition strategy feel automated.
Density as a Moat: Plugger correctly identified that for a physical service, density is the primary competitive advantage. The focus on "cities with similar population density" (Slide 10) is a smart way to frame market expansion for any O2O (Online-to-Offline) business.
Frequently asked questions
- What was Plugger's primary business model?
- Plugger operated on a B2B2C model. They partnered with convenience stores (B2B) to host battery-swapping stations. The end-user (C2C) paid a flat fee of $3 per battery swap. This allowed the company to scale without owning the real estate, leveraging existing retail foot traffic and infrastructure to provide a necessary utility.
- How did the company handle the transition to non-removable batteries?
- Slide 9 explicitly addresses this transition. While Android users at the time could swap internal batteries, iPhone users (and later all smartphone users) were offered an 'External Battery Swapping Program.' This involved swapping branded power banks, ensuring the business model remained viable even as hardware designs changed.
- What was the core marketing trigger for the service?
- The service relied on a software-to-hardware loop. As shown on Slide 8, when a user's phone reached a 10% battery threshold, the Plugger app would send a push notification. This notification included a map directing the user to the nearest partner retail location, effectively turning 'low battery anxiety' into immediate retail foot traffic.
- What are the biggest red flags in this pitch deck?
- The most significant omissions are the team and the 'Ask.' Investors fund people as much as ideas, and the lack of founder backgrounds is a major gap. Additionally, the deck provides no information on how much capital is being raised or how it will be spent. The competitive landscape is also ignored, which is risky in the crowded power bank market.
- Is the revenue growth shown in the deck realistic?
- The deck shows a leap from $400,000 in 2014 to $4M in 2015, and a projected $10M in 2016 (Slide 11). While the 10x growth from 2014 to 2015 is backed by a 10x increase in store count (100 to 1,000), the 2016 projection assumes a doubling of stores but a 2.5x increase in revenue, suggesting an assumed increase in per-store efficiency or user retention.