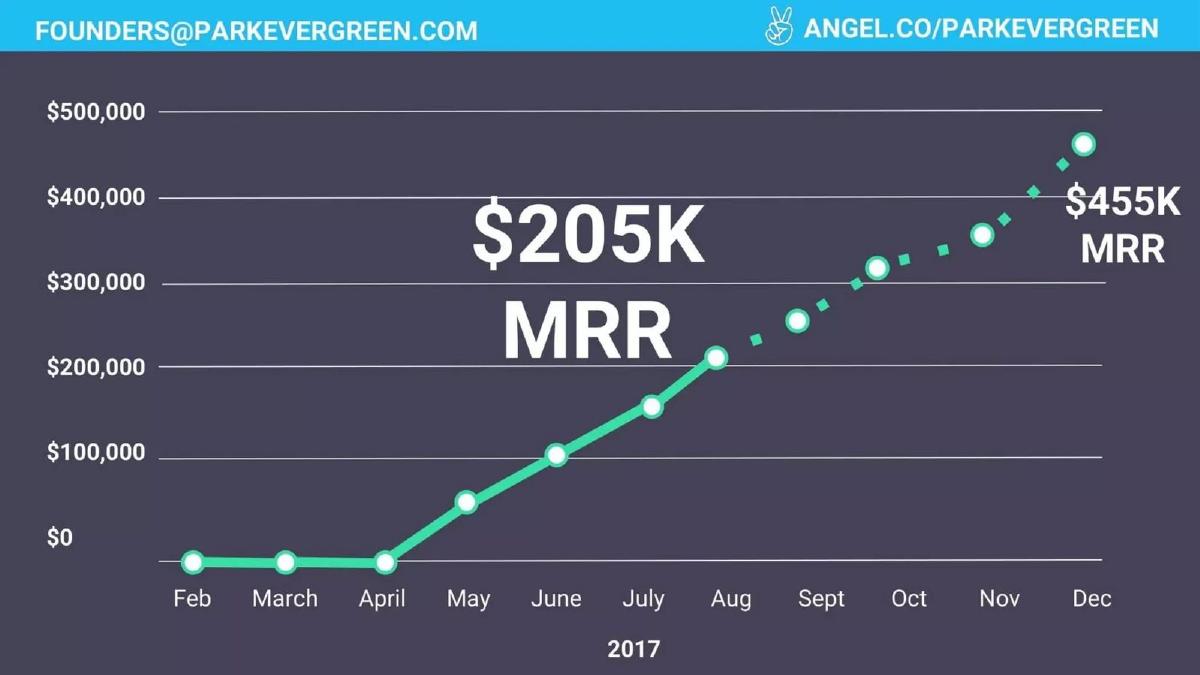
The Park Evergreen (Plot) pitch deck is a study in minimalism, relying almost entirely on large-scale typography and high-impact metrics rather than dense explanatory text. With only 14 slides, the deck highlights a staggering growth trajectory, showing Monthly Recurring Revenue (MRR) scaling from near zero in April 2017 to a projected $455,000 by December 2017 (Slide 2). The narrative focuses on the inefficiency of '5-20 year modernization projects' in the parking and facility sector (Slide 5) and positions their IoT solution as the modern alternative. While the deck lacks traditional sectio…
Key takeaways
- The deck leads with a high-growth revenue chart showing MRR jumping from $0 in April to a projected $455,000 by year-end (Slide 2).
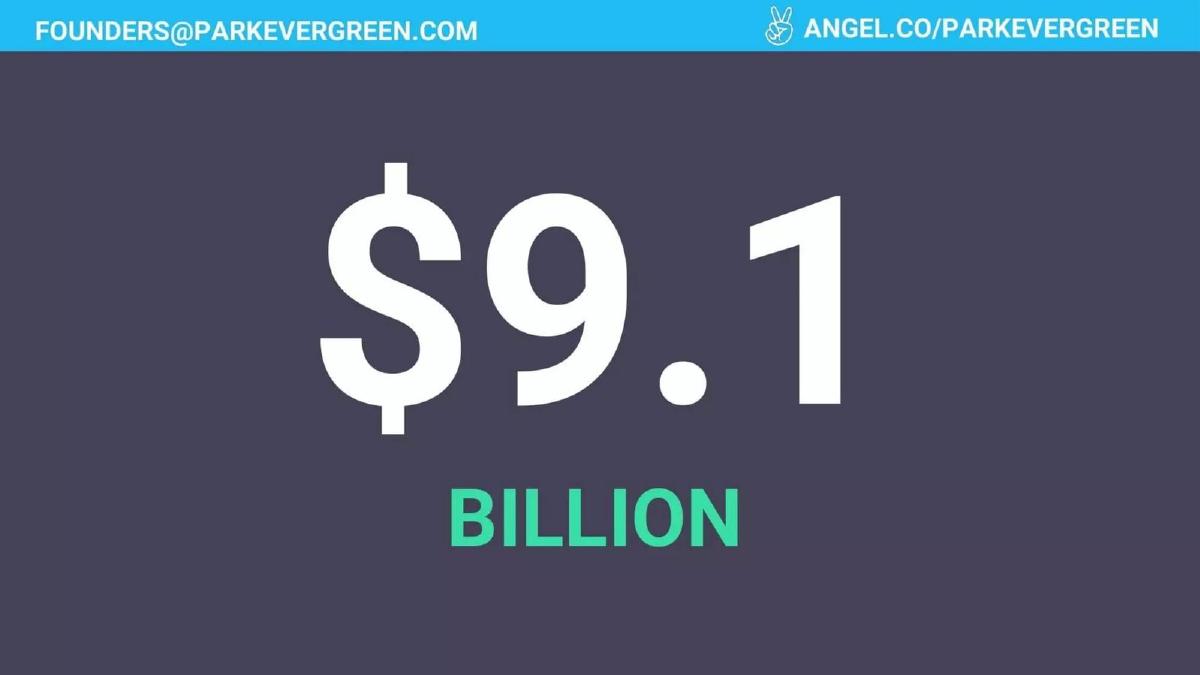
- It identifies a massive total addressable market by combining a $9.1 billion figure with a $30 billion figure (Slides 4 and 11).
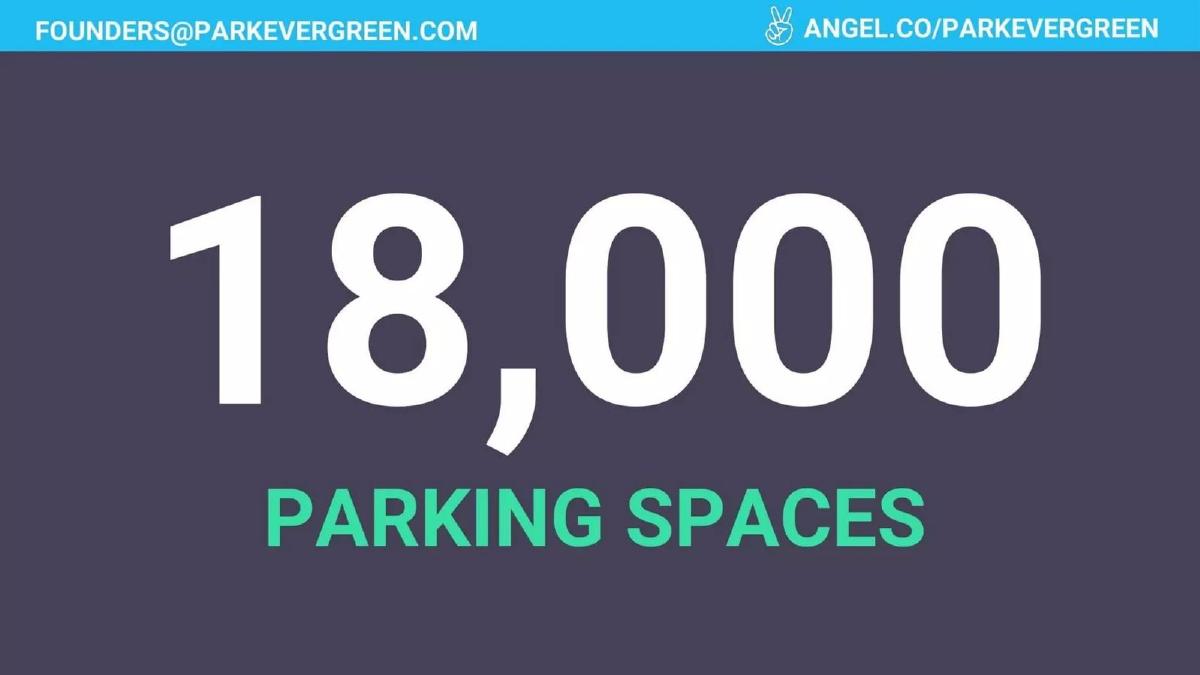
- The company highlights significant scale with 18,000 parking spaces already under management (Slide 3).
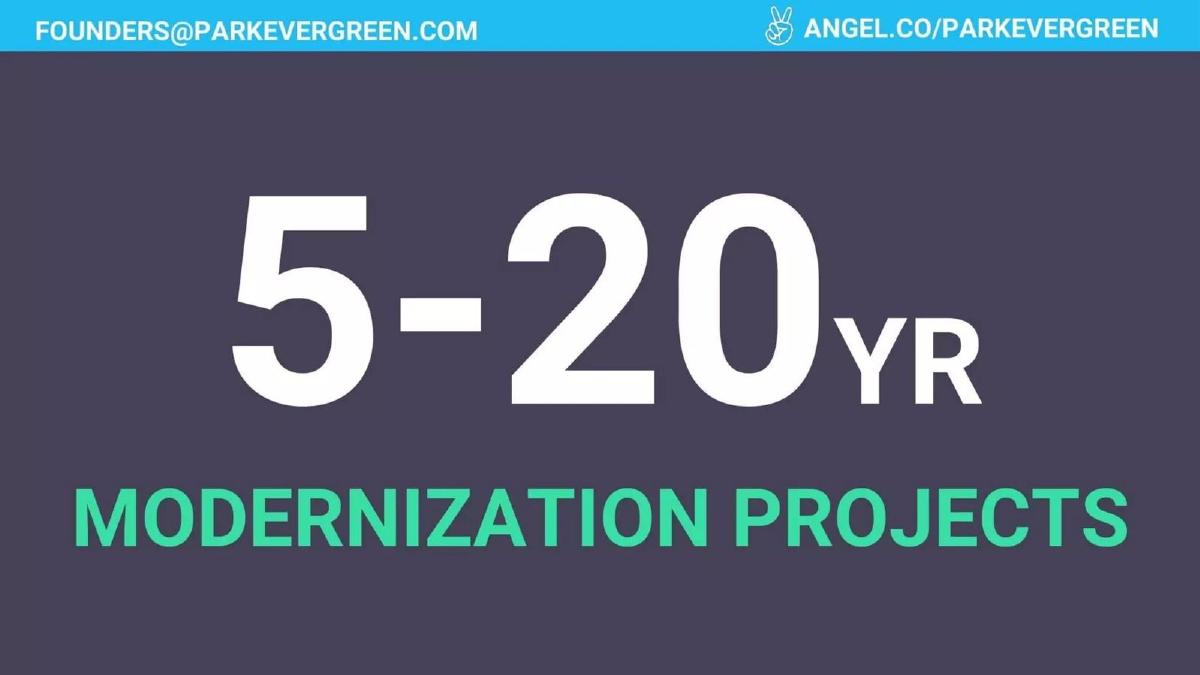
- The 'Problem' is framed as a temporal one, citing that current modernization projects take 5 to 20 years to complete (Slide 5).
- The product is shown through a clean dashboard interface for Los Angeles International Airport, tracking 2,360 current occupants (Slide 7).
- Revenue is diversified across segments, with $55,000 MRR coming from event centers and stadiums (Slide 10).
- The team slide is strictly visual, listing four founders with titles but omitting their professional backgrounds or previous exits (Slide 13).
- The deck ends on a summary of '3 Airport Pilots' and '$205K MRR' to reinforce the core investment thesis (Slide 14).
The Power of Minimalist Traction
The Park Evergreen (later Plot) pitch deck from 2016 is an exercise in extreme brevity. In an era where many founders were still building 30-slide decks filled with technical diagrams, Park Evergreen opted for a high-impact, low-text approach. The deck consists of 14 slides, many of which contain fewer than five words. This strategy works because the company had the one thing every investor craves: undeniable revenue growth. By the time a viewer reaches the end of the deck, the specific mechanics of the IoT sensors matter less than the fact that the company is generating hundreds of thousands of dollars in monthly recurring revenue.
Slides 1-2: The Hook and the Growth Curve
Slide 1 is a standard title slide featuring the Park Evergreen logo over an aerial shot of an airport parking lot at dusk. It immediately establishes the industry context. Slide 2 is the most important slide in the deck. It shows a line graph of MRR for the year 2017. The growth is flat from February to April, then shoots upward starting in May. It highlights $205K MRR in the center and a projected $455K MRR by December. Leading with revenue is a bold move that signals the company is past the 'idea stage' and is now a scaling machine.
Slides 3-6: The Problem and Scale
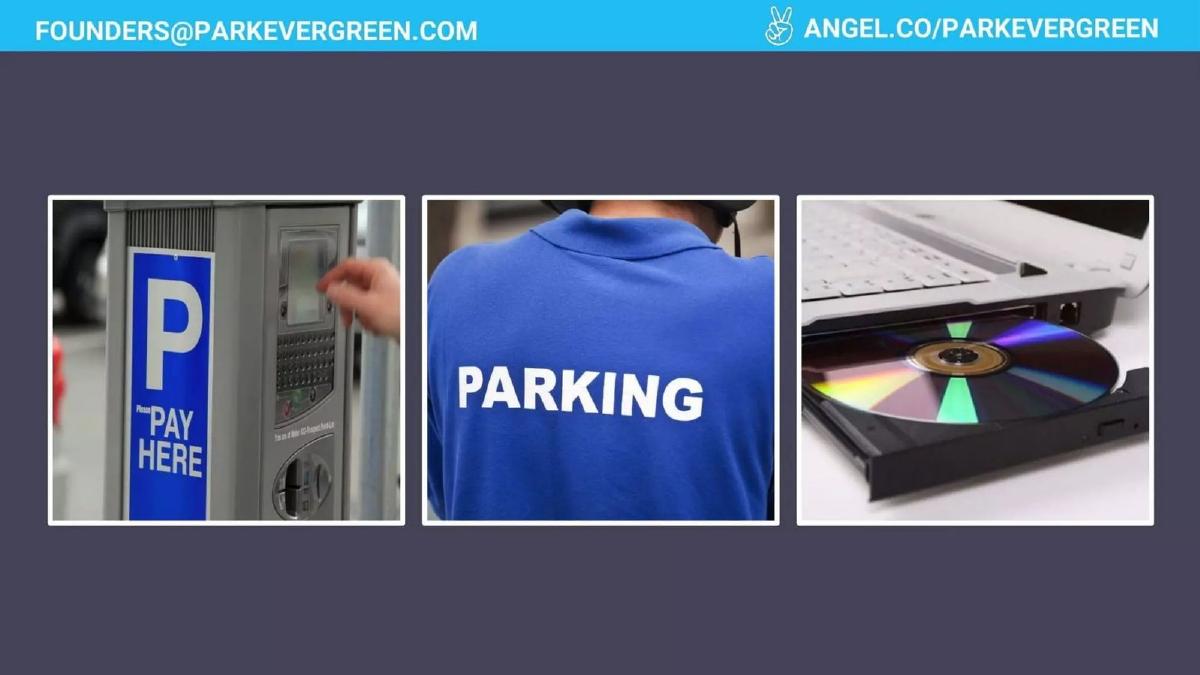
Slide 3 simply states 18,000 PARKING SPACES in large white and green text. This provides a sense of the physical footprint the company has already achieved. Slide 4 introduces a market size of $9.1 BILLION , though it does not specify if this is the total addressable market (TAM) or a specific sub-sector. Slide 5 identifies the pain point: 5-20 YR MODERNIZATION PROJECTS . This suggests that the current solutions for airports and cities are slow, bloated, and outdated. Slide 6 reinforces this with three images: a legacy parking meter, a person in a 'Parking' uniform, and a laptop with a CD-ROM drive. The CD-ROM is a particularly effective visual shorthand for 'obsolete technology.'
Slides 7-9: The Product in Action
Slide 7 provides the first look at the software. It shows a 'Parking Dashboard' for Los Angeles International Airport . Key metrics on the screen include Current Occupancy: 2,360 , Total Revenue: $324,874 , and Average $ Per User: $23.75 . This slide is crucial because it proves the software is functional and integrated with major infrastructure. Slide 8 is a map overlay showing various parking lots with price points like $15.00 , $20.00 , and $22.50 , illustrating how the system manages geographic assets. Slide 9 shows the mobile interface in a user's hand, emphasizing the traveler-facing side of the product.
Slides 10-12: Revenue Segmentation and Market Expansion
Slide 10 shifts focus to a different vertical: Event Centers/Stadiums , showing $55K MRR against a backdrop of the Circuit of the Americas race track. This demonstrates that the technology is not limited to airports. Slide 11 returns to the market size, placing the previous $9.1B figure inside a larger $30B circle. This visualizes the 'upside'—the idea that while they are starting in a $9B niche, their technology is applicable to a much larger market. Slide 12 breaks down the current revenue: $55K MRR from Event Centers/Stadiums and $150K MRR from Airport Pilots. This transparency regarding revenue sources builds significant trust with potential investors.
Slides 13-14: The Team and Summary
Slide 13 introduces the four founders: Ben Cantey (CEO) , Jenn Starr (CGO) , Ben Smith (CTO) , and Chris Addington (CPO) . As noted, there is no biographical information provided. In a deck this lean, the founders are betting that the metrics on the previous slides speak for their competence. Slide 14 serves as the closing summary, reiterating the three pillars of the pitch: 3 Airport Pilots , $205K MRR , and a 39.1B Market (combining the two previous market figures). It includes the contact email founders@parkevergreen.com , which is also present in the header of every single slide.
What Works in This Deck
The primary strength of this deck is its clarity of traction . By putting the MRR growth curve on Slide 2, the founders ensure that every subsequent slide is viewed through the lens of success. The use of real-world examples, specifically the Los Angeles International Airport (LAX) dashboard on Slide 7, grounds the abstract IoT concept in reality. Furthermore, the deck does an excellent job of 'segmenting' its success. By showing that they have both airport pilots and stadium revenue, they prove that their growth isn't dependent on a single lucky contract.
What Is Missing
The most glaring omission is a Technical/Product slide . While we see a dashboard, the deck never explains how the IoT sensors work, how they are installed, or what their proprietary advantage is. An investor might wonder if this is a hardware company, a software company, or a service provider. Additionally, there is no Competition slide . In the smart parking and facility monitoring space, competition is fierce, and failing to acknowledge other players can be a red flag for sophisticated VCs. Finally, the lack of a Financial Ask or a Milestones/Roadmap slide leaves the viewer wondering what the company plans to do next with the capital.
What a Founder Should Copy
Founders should emulate the visual hierarchy used here. Large, bold numbers (like the 18,000 spaces on Slide 3) are much more memorable than bulleted lists. If you have significant revenue, lead with it . Don't bury your growth chart on Slide 12; put it on Slide 2 to set the tone for the entire meeting. Also, the use of a persistent header with contact information and a link to a social proof platform (Angel.co) is a smart way to ensure that even if a slide is shared out of context, the investor knows how to reach out and where to find more data.
Conclusion
The Park Evergreen deck is a 'traction-first' pitch. It assumes that if the numbers are big enough and the growth is fast enough, the details of the 'how' can be handled in the Q&A. For a company that successfully raised $500,000 and eventually rebranded to Plot to tackle the broader smart city market, this minimalist approach proved highly effective. It is a reminder that in fundraising, a single compelling chart is often worth more than a thousand words of explanation.
Frequently asked questions
- What was the primary focus of Park Evergreen before it became Plot?
- Based on the deck and catalogue facts, the company was originally focused on parking solutions for large facilities like airports and stadiums. Slide 3 highlights '18,000 Parking Spaces,' and Slide 7 shows a 'Parking Dashboard' specifically for Los Angeles International Airport. The transition to Plot involved expanding this IoT sensor technology to monitor TSA wait times and general roadway/city infrastructure.
- How does the deck demonstrate market demand?
- The deck uses a 'show, don't tell' approach to demand. Instead of listing potential customers, it displays actual revenue figures: $55,000 MRR from event centers and $150,000 MRR from airport pilots (Slide 12). By showing that large-scale entities are already paying six-figure monthly sums, the founders bypass the need to prove product-market fit through theory.
- Is there a specific funding 'Ask' in this deck?
- No. The 14-slide deck completely omits a formal 'Ask' slide. There is no mention of the amount being raised, the valuation, or the intended use of funds. This suggests the deck was likely used as a visual aid for a demo day presentation (such as 500 Startups) where the specific terms are discussed in follow-up meetings.
- What is the significance of the '$9.1 Billion' and '$30 Billion' slides?
- Slides 4 and 11 represent the market size. Slide 4 introduces the $9.1 billion figure, while Slide 11 places that figure inside a larger $30 billion circle. This visualizes the company's path from a niche (parking) to a broader market (facility and city monitoring), though the deck does not explicitly define what these markets are.
- How does the team slide rank in terms of detail?
- The team slide (Slide 13) is very low on detail. It provides photos, names (Ben Cantey, Jenn Starr, Ben Smith, Chris Addington), and titles (CEO, CGO, CTO, CPO). It lacks logos of former employers, university names, or specific achievements. For a $500,000 raise, this indicates the investors were likely moved more by the MRR growth than the founders' resumes.