Storygami’s 2013 pitch deck is a masterclass in using social proof to overcome the 'nice-to-have' stigma of marketing tools. By leading with a quote from Sir Richard Branson and following up with specific performance data from global brands like Unilever and Al Jazeera, the company reframed interactive video from a gimmick to a measurable ROI engine. The deck focuses heavily on the 'what' and 'how well it works' rather than the 'how it works' or the 'how much it costs.' While it lacks traditional financial projections and a specific funding ask, the 12-slide presentation provides a dense coll…
Key takeaways
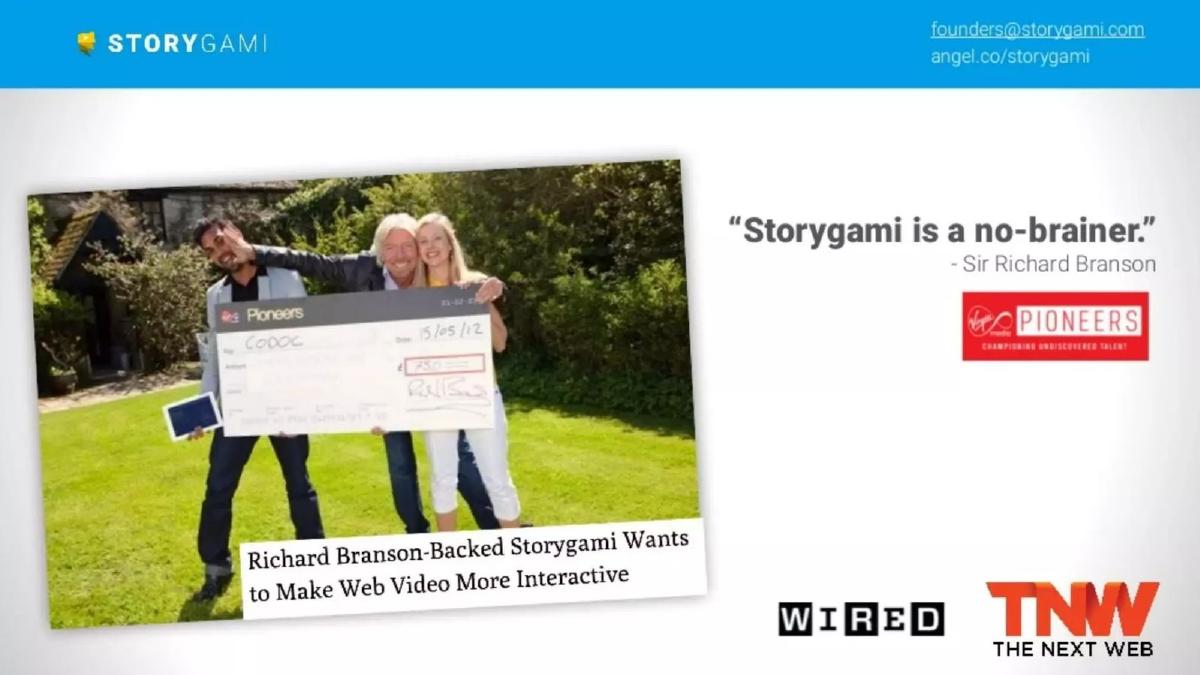
- The deck leads with massive social proof, featuring a photo of the founders with Richard Branson and a 'no-brainer' quote on Slide 2.
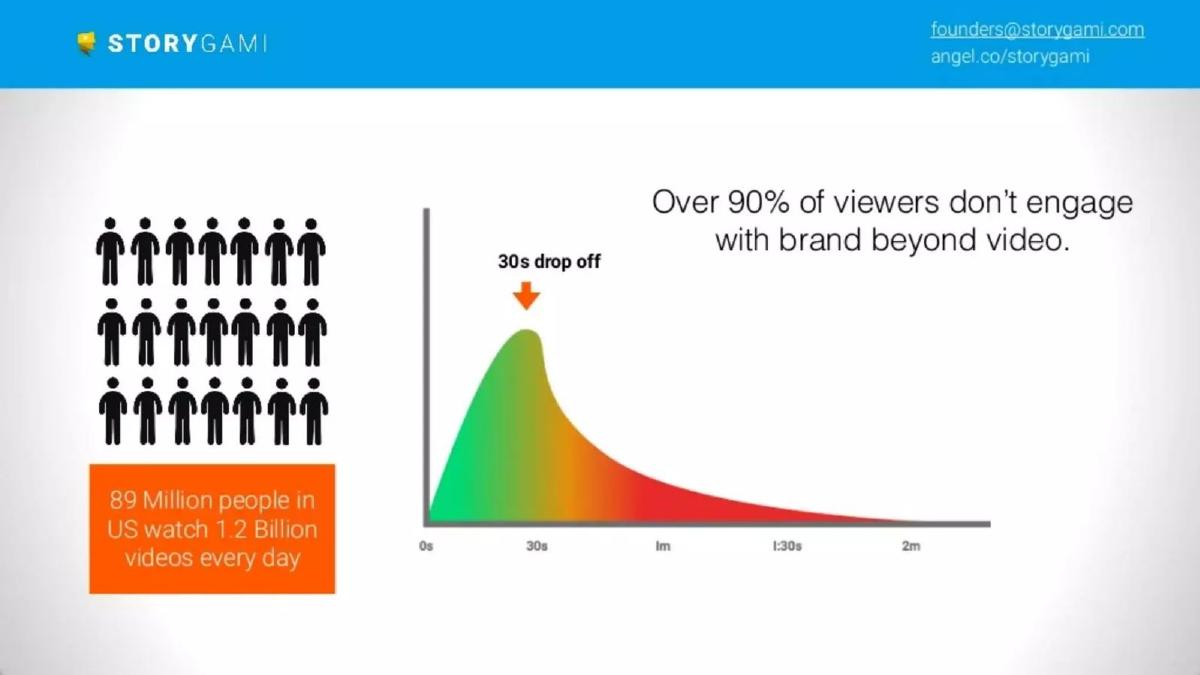
- Problem identification is specific, citing that 89 million people in the US watch 1.2 billion videos daily, yet 90% don't engage beyond the video (Slide 3).
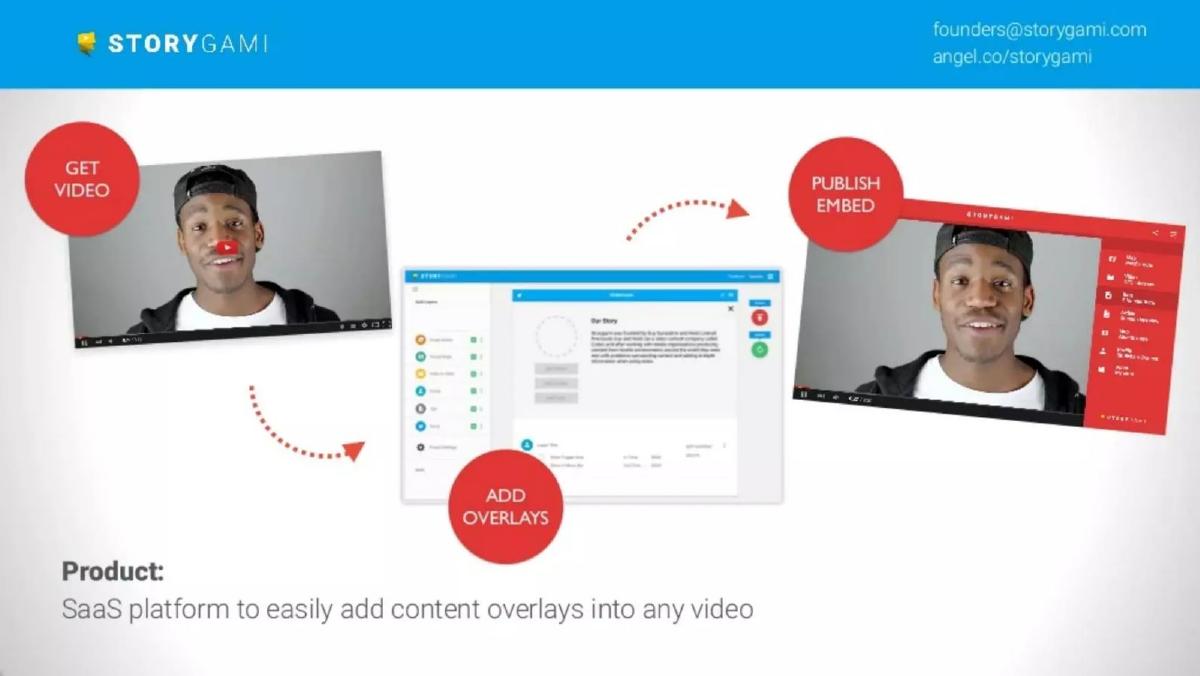
- Product functionality is simplified into a three-step process: Get Video, Add Overlays, and Publish Embed (Slide 4).
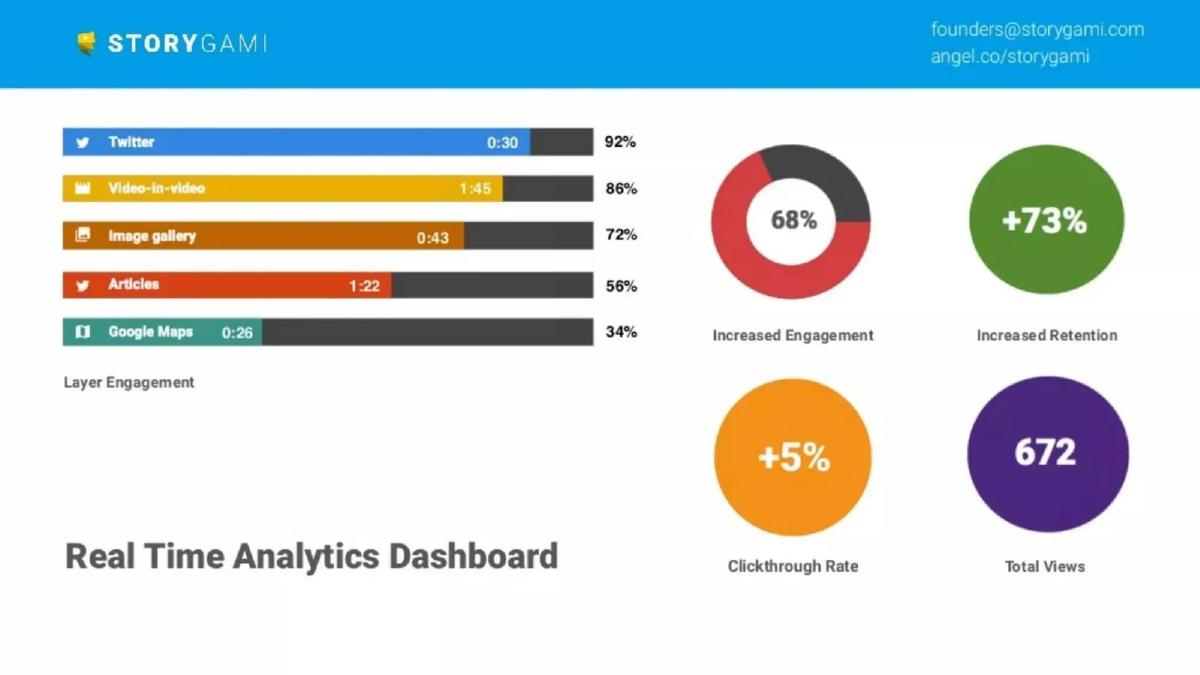
- Engagement metrics are the core of the pitch, claiming a 68% increase in engagement and a 73% increase in retention (Slide 5).
- Case studies provide granular proof, such as Virgin Atlantic seeing a 71% engagement increase and 1 minute 10 seconds of extra time spent (Slide 7).
- The customer list is high-caliber for an early-stage startup, including BT, Vice, Sky News, and Bupa (Slide 10).
- The team slide (Slide 11) identifies four key roles: Development, Marketing, CEO/Co-Founder, and Design/Co-Founder.
- The deck completely omits a business model slide, financial projections, and a specific capital ask.
The Power of the 'Branson Bump'
Storygami’s 2013 deck is a product of its time, originating from the 500 Startups ecosystem. It is lean, visually driven, and relies almost entirely on the credibility of its early adopters. In a crowded MarTech space, Storygami chose to lead with authority rather than technology. By placing Sir Richard Branson on the second slide, they immediately bypass the skepticism usually reserved for early-stage interactive video tools.
Slides 1-2: The Hook and the Hero
Slide 1 is a minimalist title slide featuring the Storygami logo—a stylized yellow play button/origami hybrid—and the tagline "Smart Interactive Video." It establishes a clean, professional brand identity immediately.
Slide 2 is the 'Social Proof' slide. It features a large photo of the founders holding a giant check with Richard Branson, accompanied by the quote: "Storygami is a no-brainer." It also includes logos from Wired and The Next Web. For a seed-stage company, this is an incredibly strong opening. It answers the 'Why you?' question before the 'What is it?' question has even been asked.
Slides 3-5: The Problem, Product, and Performance
Slide 3 addresses the 'Problem.' It uses a simple infographic to state that 89 million people in the US watch 1.2 billion videos every day, but over 90% of viewers don't engage with the brand beyond the video. A retention graph shows a sharp '30s drop off,' visually representing the lost opportunity for marketers.
Slide 4 introduces the 'Product.' It describes Storygami as a "SaaS platform to easily add content overlays into any video." The workflow is simplified into three red bubbles: Get Video, Add Overlays, and Publish Embed. The UI screenshots show a drag-and-drop interface, emphasizing ease of use for non-technical marketing teams.
Slide 5 focuses on 'Real Time Analytics.' This is a crucial slide because it moves the conversation from 'cool widgets' to 'business intelligence.' It lists engagement rates for specific overlay types: Twitter (92%), Video-in-video (86%), Image gallery (72%), Articles (56%), and Google Maps (34%). It also claims a 68% increase in engagement and a 73% increase in retention across the board.
Slides 6-10: The Evidence (Case Studies)
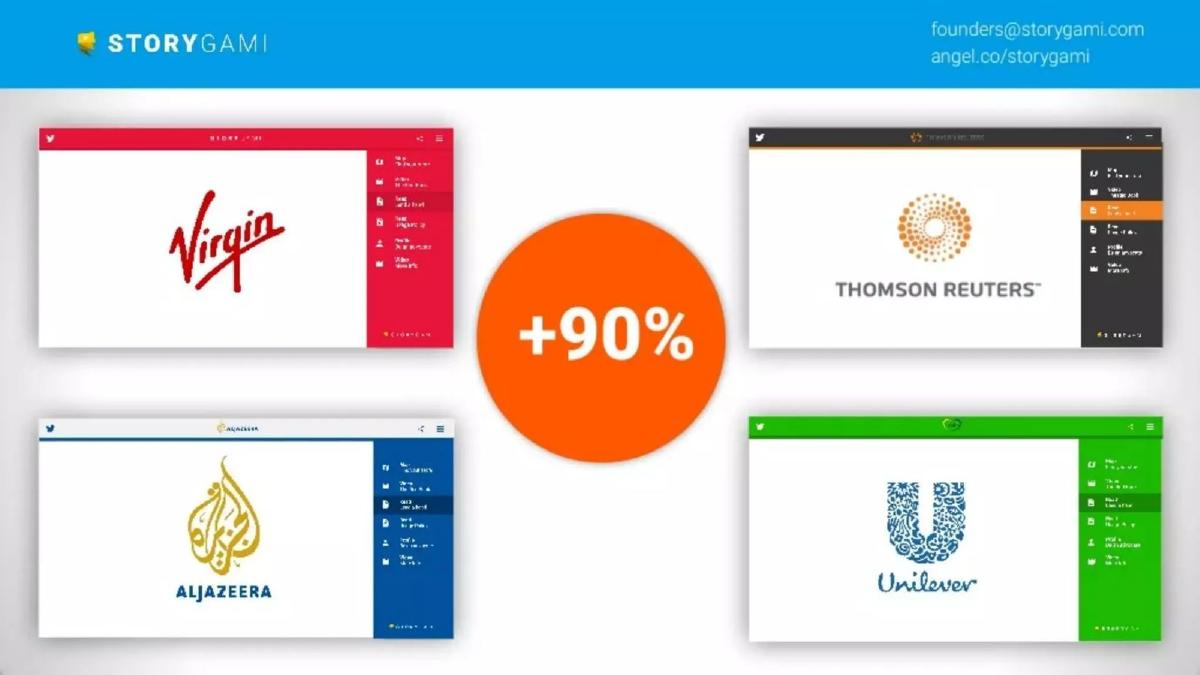
The middle section of the deck (Slides 6 through 9) is dedicated to specific brand results. Slide 6 shows four branded players (Virgin, Thomson Reuters, Al Jazeera, Unilever) with a large '+90%' graphic in the center.
Slide 7 is a deep dive into Virgin Atlantic. It shows a poll overlay asking "Which post is more appropriate?" and lists two specific KPIs: an increase in time spent by 1 minute and 10 seconds, and a 71% increase in viewer engagement. This slide is effective because it shows the tool in a real-world context (social media training or brand awareness).
Slide 8 features Al Jazeera, showing a sidebar with 'Director Notes,' 'Image Gallery,' and 'Articles.' It claims a 50% increase in viewer engagement. Slide 9 features Unilever (Flora brand), showing a recipe/blog sidebar and claiming a 43-second increase in time spent and a 40% increase in engagement.
Slide 10 serves as the 'Traction' or 'Logo' slide. It lists a heavy-hitting roster of clients including Bupa, BT, Vice, and Sky News. Notably, it distinguishes between active clients and "Live Trials," which is a transparent way to show momentum without overstating permanent contracts.
Slides 11-12: The Team and The Contact
Slide 11 introduces the team with a professional group photo. The roles are clearly defined: Łukasz Łabędzki (Development), Damiano R (Marketing), Heidi Lindvall (CEO/Co-Founder), and Guy Gunaratne (Design/Co-Founder). The balance of two founders and two key functional leads suggests a small but execution-focused unit.
Slide 12 is the closing slide, providing an email address and an AngelList link. It uses the same blue and white color palette as the rest of the deck, maintaining brand consistency to the end.
What Works in the Storygami Deck
1. Relentless Focus on Outcomes: Most interactive video decks spend too much time on the 'features' (e.g., "we have a map widget"). Storygami spends its time on the 'results' (e.g., "the map widget resulted in X% more time spent"). By Slide 9, the investor is convinced that the tool actually works.
2. High-Signal Logos: For a startup that raised only $100,000 in 2013, the client list is extraordinary. Having Virgin, Unilever, and Al Jazeera as early users suggests that the founders have either incredible sales hustle or a product that solves a very painful problem for large media spenders.
3. Visual Simplicity: The deck uses a consistent color palette and very little text. It is designed to be spoken over, making it an ideal demo-day deck. The use of red circles to highlight the three-step process on Slide 4 is a great example of 'glanceable' design.
What is Missing from the Storygami Deck
1. The Business Model: There is no mention of how Storygami makes money. Is it a per-video fee? A monthly SaaS subscription? A percentage of the media spend? Without this, it’s hard to judge the scalability of the $100k raise.
2. Market Size (TAM): The deck identifies that a lot of people watch video, but it doesn't quantify the addressable market for interactive video software. Investors need to know if this is a $100M opportunity or a $10B opportunity.
3. The Ask: The deck ends without telling the investor what the company needs. A standard pitch deck should include a slide detailing the funding goal, the runway it provides, and the specific milestones (e.g., "Raising $500k to reach 50 enterprise clients").
What a Founder Should Copy
1. The 'Proof First' Structure: If you have a big-name backer or a massive pilot, don't hide it on Slide 10. Put it on Slide 2. Storygami uses Richard Branson to buy the audience's attention for the rest of the presentation.
2. KPI-Driven Case Studies: Instead of just showing a screenshot of your product, show the product with the specific metric it improved. Slide 7 (Virgin Atlantic) is the strongest slide in the deck because it combines the UI, the brand, and the data in one view.
3. Clear Role Definition: Even in a small team, showing that you have 'Development,' 'Design,' 'Marketing,' and 'CEO' roles covered (Slide 11) gives investors confidence that the core pillars of a software business are represented.
Final Analysis
Storygami’s deck is a textbook example of how to leverage early traction to build a narrative of inevitability. While it lacks the financial depth required for a Series A, it is perfectly calibrated for a Seed round or an accelerator graduation. It identifies a clear gap in the market—the '30-second drop off'—and provides a mountain of evidence that their solution bridges that gap. For founders in the SaaS space, the lesson here is clear: stop selling features and start selling the lift in your customer's bottom-line metrics.
Frequently asked questions
- How much did Storygami raise with this deck?
- According to the catalogue listing, Storygami raised $100,000 in 2013. This was part of their participation in the 500 Startups accelerator program, which typically provided standardized seed funding to its cohorts during that era.
- Who were Storygami's primary customers?
- The deck highlights a sophisticated enterprise client base. Slide 10 lists logos for Virgin Media, Unilever, BT, Thomson Reuters, Al Jazeera, Vice, and Sky News. These are primarily large-scale media organizations and consumer goods brands that produce high volumes of video content.
- What specific engagement metrics does the deck claim?
- The deck is very specific about performance. Slide 5 claims a 68% increase in engagement and a 73% increase in retention. Slide 6 mentions an overall 90% increase across clients, while individual case studies show gains ranging from 40% (Unilever, Slide 9) to 71% (Virgin Atlantic, Slide 7).
- What is missing from the Storygami pitch deck?
- The deck is missing several standard venture components: a business model (pricing), a market size (TAM/SAM/SOM) analysis, a competitive landscape, financial projections, and a specific 'Ask' slide detailing how much money they are raising and what the milestones are.
- What platforms does Storygami support?
- While the slides focus on the overlays, the catalogue listing specifies that the SaaS tool allows users to add interactive elements to existing videos from YouTube, Vimeo, Brightcove, and Ooyala. Slide 7 explicitly shows a YouTube player interface being used with their overlays.