TRDATA’s 2009 seed deck is a case study in extreme minimalism, containing fewer than 100 words across 14 slides. The company sought to disrupt the financial data industry by providing real-time, user-generated data for emerging markets—territory where incumbents like Bloomberg were allegedly under-serving the community. By showcasing a massive logo wall of financial institutions and direct comparative metrics (3x more users and 10x more data providers than Bloomberg in specific regions), the deck successfully communicated traction and market gap without dense technical explanations. While it…
Key takeaways
- The deck highlights a specific market failure where Bloomberg terminals show 'Not Priced' for emerging market assets (Slide 3).
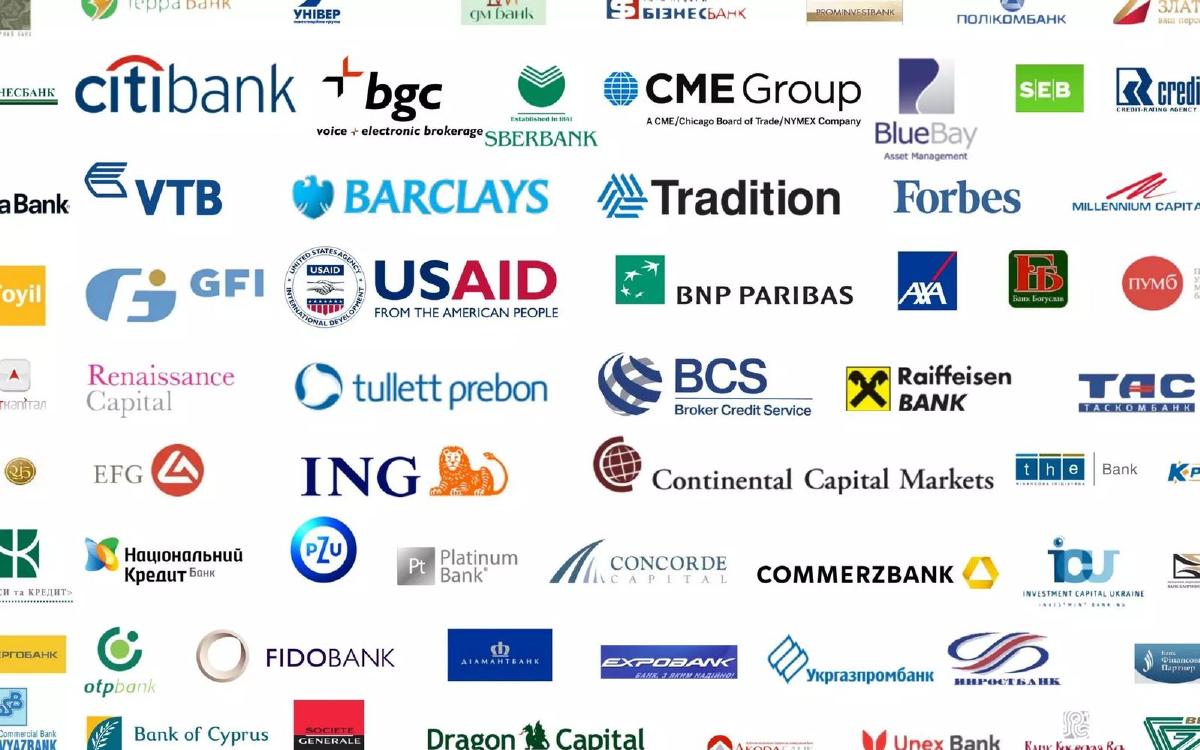
- A massive logo wall of over 50 financial institutions is used to imply deep industry penetration or target reach (Slide 2).
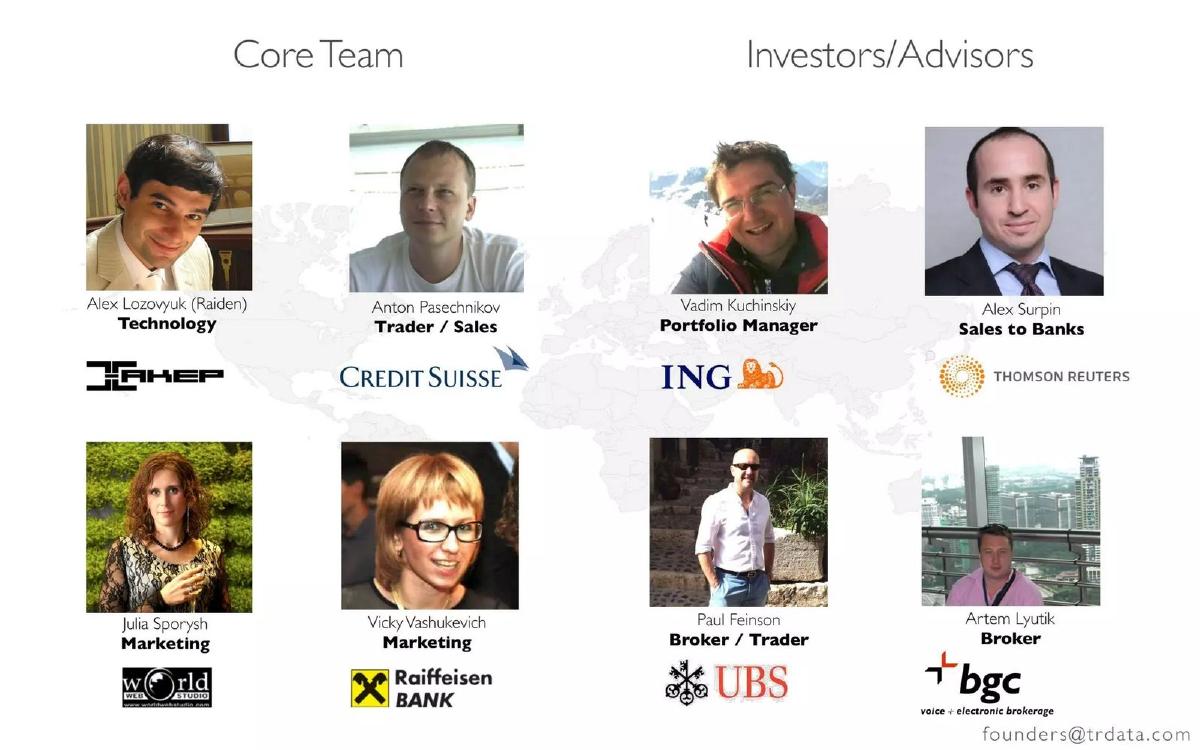
- The team slide leverages heavy-hitting financial brands including Credit Suisse, ING, UBS, and Thomson Reuters to establish credibility (Slide 6).
- TRDATA claims a 100% market dominance or focus within the Ukrainian market as their initial proof of concept (Slide 10).
- Direct competitive benchmarking claims 3x more users and 5x more active prices than Bloomberg (Slide 11).
- The company reported $300,000 in existing revenues at the time of the pitch (Slide 12).
- The total addressable market for the market data industry is cited as $23 billion (Slide 13).
- The funding ask was a flat $1 million, though the company eventually raised $1.4 million according to catalogue data (Slide 14).
The Visual Language of Financial Disruption
The TRDATA pitch deck is a relic from 2009 that feels surprisingly modern in its brevity. At only 14 slides, it avoids the 'wall of text' trap that many fintech startups fall into. Instead, it uses a series of high-impact visuals to tell a story of a fragmented market that the incumbents have failed to organize. The deck is designed to be presented, not read; without a speaker, many of the slides are purely atmospheric. However, for a seed-stage company, the focus on 'who we are' and 'who we are beating' provides a clear narrative arc.
Slides 1-4: The Context and the Gap
Slide 1: Cover The deck opens with the TRDATA logo and the tagline 'MAKING MARKETS.' The silhouette of a frog is the primary brand mark. The presence of a world map with highlighted regions (Latin America, Africa, Eastern Europe, and Asia) immediately signals a focus on Emerging Markets (EM).
Slide 2: The Institutional Landscape This slide is a dense collage of logos including Citibank, Barclays, BNP Paribas, and Sberbank. There is no text explaining these logos. In the context of a pitch, this is intended to show the breadth of the financial industry or, more likely, the entities currently struggling with the data problem TRDATA intends to solve.
Slide 3: The Problem Statement This is the most creative slide in the deck. It features a bottle of Sassicaia 2009 wine, a '$200K' price tag, and a screenshot of a Bloomberg terminal. The terminal shows a bond ('FICBUA 10 1/2') with the status 'Not Priced.' The juxtaposition suggests that while luxury goods have clear valuations, massive financial instruments in emerging markets are often 'dark,' lacking real-time transparency.
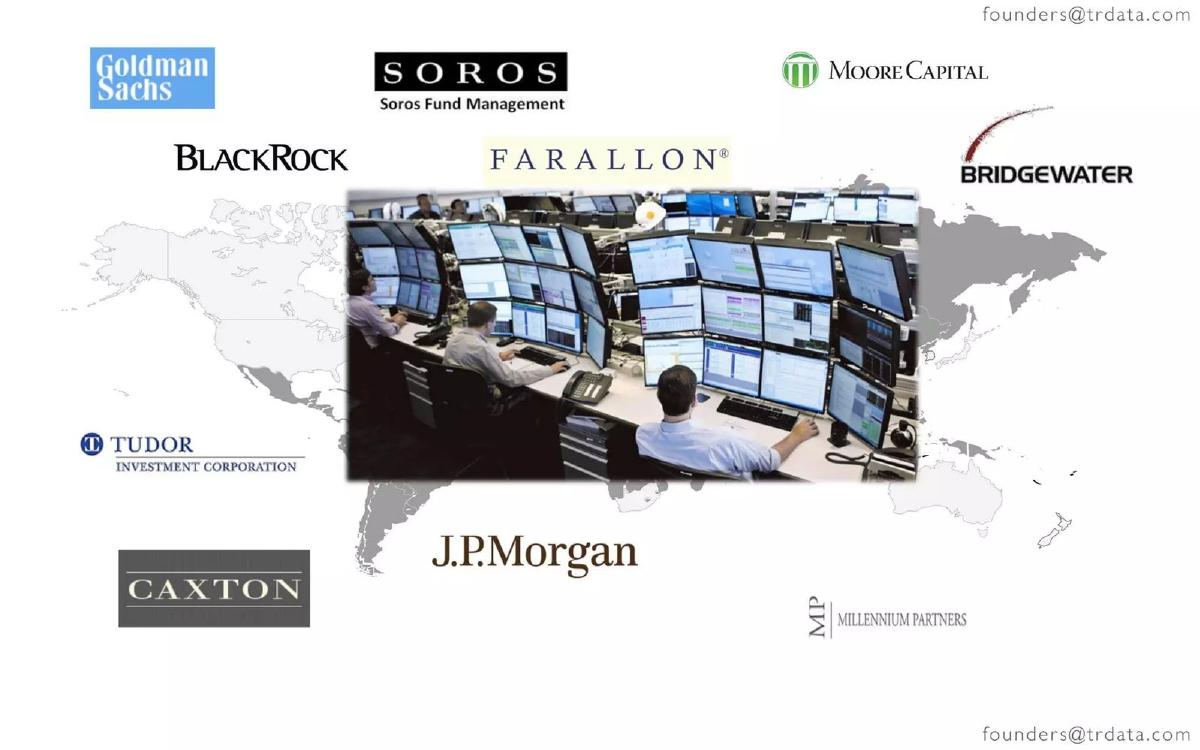
Slide 4: The Target Audience Another logo wall, this time focusing on the 'Buy Side' and major investment banks: Goldman Sachs, Soros Fund Management, BlackRock, and J.P. Morgan. By placing a photo of a high-intensity trading floor in the center, TRDATA identifies exactly who needs their data to make decisions.
Slides 5-9: The Solution and the Team
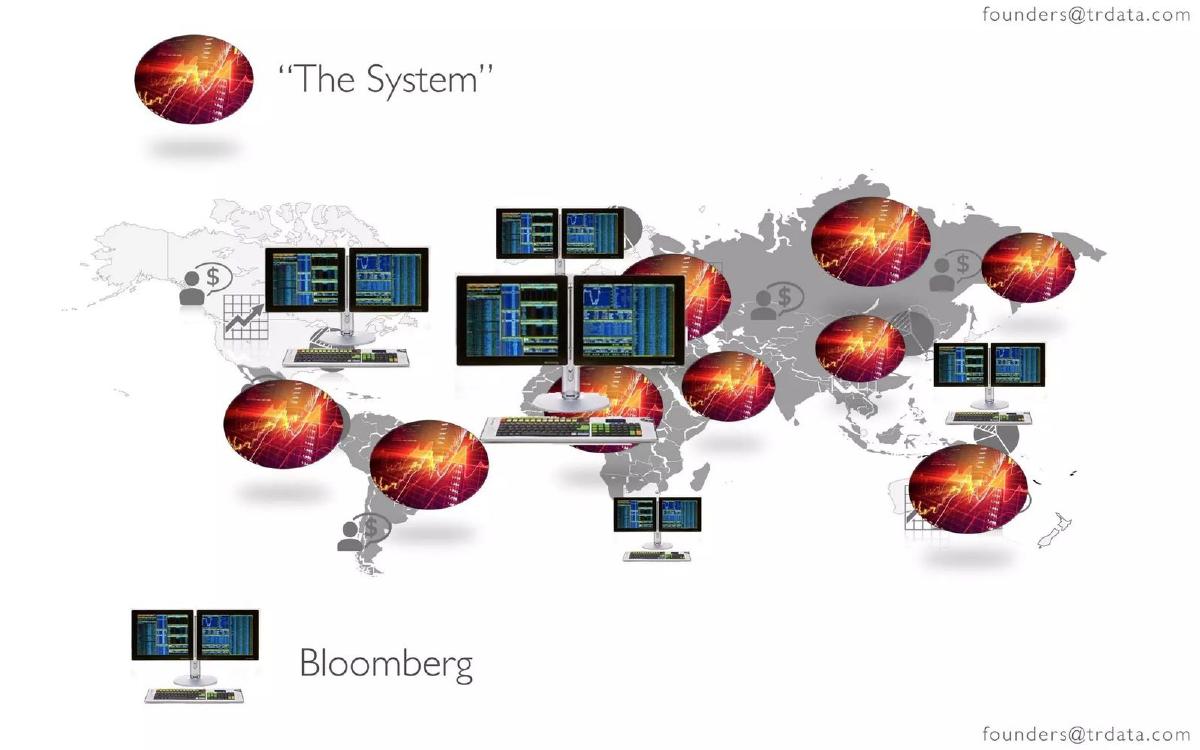
Slide 5: The Incumbent vs. The Reality The slide labels Bloomberg as a centralized, static system (represented by a few terminal icons) while 'The System' (TRDATA's vision) is shown as a decentralized network of data points across the globe. It frames TRDATA as a distributed, crowdsourced alternative to the rigid Bloomberg model.
Slide 6: Core Team and Advisors Credibility is the currency of this slide. The 'Core Team' includes Alex Lozovyuk (Technology), Anton Pasechnikov (Trader/Sales), Julia Sporysh (Marketing), and Vicky Vashukevich (Marketing). The 'Investors/Advisors' section is even more impressive, featuring individuals with backgrounds at Credit Suisse, ING, Thomson Reuters, UBS, and BGC. For a $1M seed round, this level of institutional pedigree is a significant de-risking factor.
Slides 7-9: Geographic Focus These slides use the same world map from the cover to show the flow of data. Slide 7 and 8 use icons for charts, pie graphs, and currency to show data being generated in EM regions. Slide 9 focuses specifically on Ukraine, using the national flag and the text '100%,' implying they have achieved total market coverage or a complete data set for that specific country.
Slides 10-14: Traction and The Ask
Slide 10: The Ukraine Proof Point This slide repeats the '100%' claim over a map of Ukraine. In a pitch, this likely served as the 'Land and Expand' slide, proving that the model works in one complex emerging market before scaling globally.
Slide 11: Competitive Benchmarking TRDATA explicitly compares itself to Bloomberg. They claim to have '3x more users,' '5x more active prices,' and '10x more data providers.' These are bold claims for a seed-stage startup, but they provide the 'why now' and 'why us' that investors look for. It suggests that in the specific niche of EM, the giant is vulnerable.
Slide 12: Revenue The slide simply states '$300K revenues.' There is no breakdown of MRR, ARR, or customer concentration. While vague, the presence of six-figure revenue at the seed stage in 2009 was a strong indicator of product-market fit.
Slide 13: Market Size The 'Market Data Industry' is valued at '$23B.' This is a standard TAM (Total Addressable Market) slide, intended to show that even a small slice of the pie results in a massive company.
Slide 14: The Ask The final slide features a money bag icon and the text '$1 Million.' It is a direct, no-frills request for capital. The contact email 'founders@trdata.com' is provided, mirroring the cover slide.
What Works in the TRDATA Deck
1. Extreme Clarity on the Problem: Slide 3 is a masterclass in visual storytelling. By showing a 'Not Priced' status on a Bloomberg terminal next to a high-value asset, they instantly communicate the frustration of a trader who cannot get a quote on a bond. It identifies a specific, painful gap in the market leader's product.
2. Pedigree as a Proxy for De-risking: The team slide (Slide 6) does not list responsibilities or bios. It lists logos. By associating the founders and advisors with Credit Suisse, UBS, and Reuters, they signal to investors that they 'speak the language' of the industry they are trying to disrupt. In fintech, industry insiders are often preferred over pure tech outsiders.
3. Aggressive Benchmarking: Slide 11 is the 'hook.' By claiming to outperform Bloomberg by 3x to 10x on key data metrics in their niche, they make a compelling case for why a trader would switch to or add TRDATA to their workflow.
What is Missing from the TRDATA Deck
1. Business Model: There is absolutely no mention of how the company makes money. Is it a per-terminal seat license like Bloomberg? Is it an API-based data feed? Is it free for contributors and paid for consumers? The $300k in revenue proves people are paying, but not how or why they will continue to pay at scale.
2. Product Screenshots: Aside from the Bloomberg terminal screenshot used to show a problem, we never see the TRDATA interface. For a platform that claims to make content submission 'easy and fun' (per the catalogue description), the lack of a UI/UX showcase is a missed opportunity to prove their technological advantage.
3. Use of Funds: The deck asks for $1 million but doesn't explain what that money will buy. Will it be used for engineering, sales in new regions, or data acquisition? Investors generally want to see a high-level breakdown of the runway this capital provides.
4. Unit Economics: There is no mention of the cost to acquire a user or the lifetime value of a data provider. In a crowdsourced model, the 'funnel' of data is just as important as the 'funnel' of sales, and neither is addressed here.
Founder Takeaways: What to Copy
Use Visual Metaphors for Complex Problems: If you are solving a technical or niche problem, find a way to illustrate it simply. TRDATA’s use of the 'Not Priced' terminal screen is much more effective than a slide listing 'Data Latency Issues' or 'Low Coverage Ratios.'
Lead with Traction Metrics: If you have revenue or user numbers that beat the incumbent in a specific sub-sector, put those front and center. You don't need to be bigger than the incumbent globally; you just need to be better than them in the room where your customers sit.
Keep it Brief: This deck respects the investor's time. It hits the problem, the team, the traction, and the ask in 14 slides with almost no filler. While it may be too minimalist for a deck sent via email, it is an excellent template for a deck intended to be presented live, where the founder can provide the missing context verbally.
Conclusion: TRDATA’s deck succeeded because it identified a massive, $23 billion market where the dominant player had a visible weakness. By combining a team of industry veterans with early revenue and superior data depth in a specific geography (Ukraine), they made a $1 million check look like a safe bet on a high-upside niche play.
Frequently asked questions
- What is the core problem TRDATA is solving?
- TRDATA addresses the lack of real-time pricing for emerging market financial instruments. Slide 3 illustrates this by showing a Bloomberg terminal screen where a bond is listed as 'Not Priced,' contrasted with a $200,000 bottle of wine, suggesting that high-value assets are being traded blindly due to poor data infrastructure.
- How does TRDATA differentiate itself from Bloomberg?
- According to Slide 11, TRDATA differentiates through volume and user engagement in emerging markets. They claim to have 3x more users, 5x more active prices, and 10x more data providers than Bloomberg in their target segments, relying on a user-generated content model rather than centralized data collection.
- What is the significance of the logo walls in this deck?
- The logos on Slide 2 and Slide 4 represent the ecosystem of global finance (Citibank, Goldman Sachs, BlackRock). While the deck doesn't explicitly state these are all paying customers, they serve as a visual shorthand for the 'world' TRDATA operates in and the institutional level of their target audience.
- Is there a clear business model explained in the slides?
- No. The deck completely omits a business model slide. It mentions $300,000 in revenues on Slide 12, but it does not explain if this comes from subscriptions, data licensing, or transaction fees. This is a significant omission that would usually require a verbal explanation during the pitch.
- What was the outcome of this specific fundraising round?
- While Slide 14 asks for $1 million, the catalogue data indicates the company successfully closed $1.4 million in Seed funding in 2009. This suggests the minimalist visual approach was effective in securing investor interest during that era.