The anual.io pitch deck is a 24-slide presentation that leans heavily on a fictionalized user persona named Henry to illustrate the friction in client reporting. By focusing on the emotional and professional consequences of poor data communication, the deck establishes a clear 'why' for its existence. It identifies a specific market opportunity in the data visualization sector, valued at USD 4.12 billion with a projected growth to USD 6.99 billion by 2022. However, the deck suffers from a lack of operational detail. Across the provided slides, there is no mention of unit economics, a competit…
Key takeaways
- The deck uses a multi-slide narrative arc involving 'Henry' and 'John' to demonstrate the product's utility in a real-world sales environment (Slides 2-5).
- It identifies a specific market size for data visualization applications at USD 4.12 billion (Slide 7).
- The company projects a market CAGR of 9.21% through the end of 2022 (Slide 7).
- The product aims to solve the problem of 'bad, bad...design' in traditional text-heavy presentations (Slide 6).
- The solution involves integrating Google AdWords and Analytics data into short, 60-second animations (Slide 4).
- The deck omits critical investor information, including the team's background, current traction, and the amount of funding sought.
- Visual storytelling is prioritized over data density, with several slides containing fewer than 20 words of text.
The Narrative Hook: Selling Through Storytelling
The anual.io pitch deck is a case study in using a persona-driven narrative to establish a problem-solution fit. Rather than leading with technical specifications or market dominance, the deck spends its opening act building empathy for the user. While this approach is effective for engagement, it leaves little room for the rigorous data analysis typically required in a seed or Series A round.
Slide 1: Title and Visual Identity
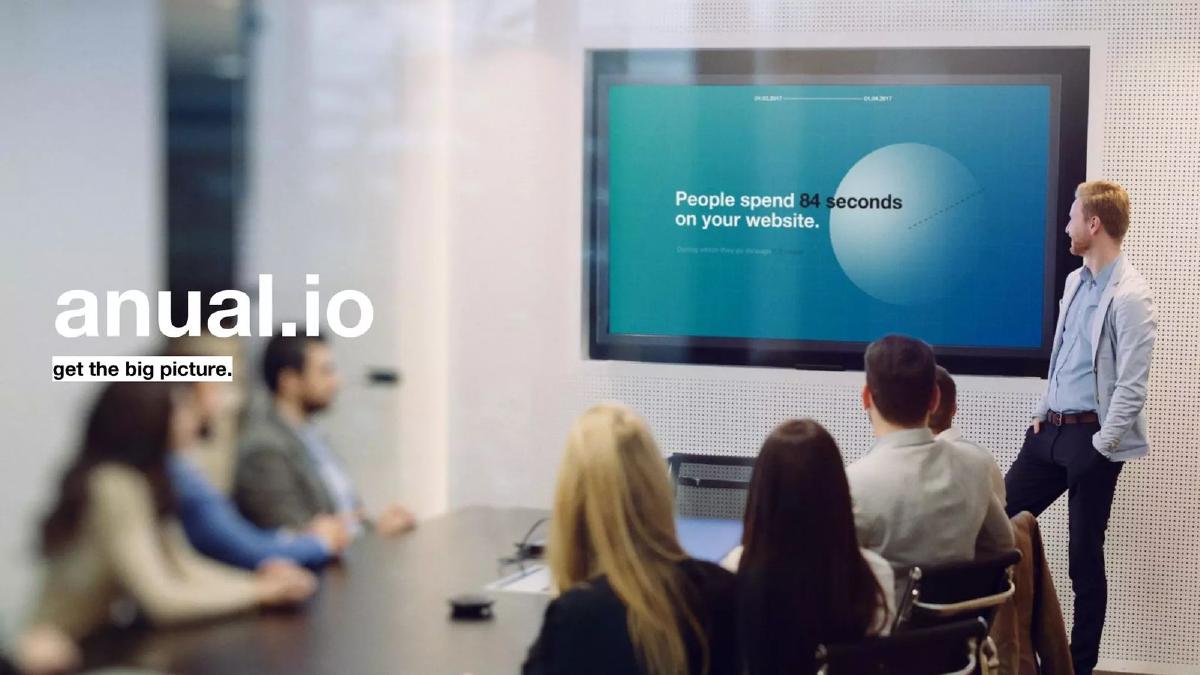
The cover slide introduces the brand anual.io with the tagline "get the big picture." The background image features a professional setting where a presenter is showing a screen that reads, "People spend 84 seconds on your website." This immediately establishes the context: digital analytics and the challenge of capturing attention. The date on the screen, 01.03.2017 to 01.04.2017, suggests the deck was likely produced around that timeframe.
Slide 2: The Conflict
Slide 2 introduces the characters of the narrative. It states: "But, Henry still needs to present those changes to his client - John, and he has to approve proposed adjustments before moving on.." This slide sets the stakes. It identifies the bottleneck in the professional workflow—the client approval process—which is the specific friction point anual.io intends to lubricate.
Slide 3: The Failure State
Slide 3 describes the 'before' scenario. It notes that "Henry messed up explaining his ideas, with notes flying all over the place." It uses colloquial language like "full panic mode on" to describe the user's emotional state. The outcome is a lost opportunity: "John... safely said NO, and took off." This slide serves to validate the pain point by showing the cost of poor communication: lost revenue and rejected proposals.
Slide 4: The Intervention
Slide 4 introduces the product as the hero of the story. It describes Henry sitting in his "favourite spot, with a laptop, grey blanket, and a good chamomile tea." He types anual.io , links his Google account , and selects two animations: "Google AdWords Geographic Overview" and "Google AdWords+Analytics User Flow." The slide claims these animations help the client get the big picture "in like 60 seconds." This is the most technical slide in the sequence, revealing the product's reliance on Google API integrations.
Slide 5: The Success State
Slide 5 provides the resolution. It quotes a fictional text from the client, John: "It’s brilliant, let’s make those changes... I’d like to finally explain them what I actually do ;)" The slide ends with the word "Jackpot." This completes the narrative arc, moving from failure to success via the anual.io platform. While emotionally resonant, it offers no proof of actual user success stories or case studies.
Slide 6: The Problem Statement
Slide 6 pivots from the story to a broader market problem. It claims that "Currently you don’t have much of a choice when it comes to quickly translating your ideas into understandable big picture." It critiques existing solutions as being "chunks of text, intertwined with some data visualization" and, most pointedly, "a bad, bad...design." This slide defines the company's value proposition as a design-first alternative to traditional reporting tools.
Slide 7: Market Size and Growth
Slide 7 provides the quantitative justification for the business. It states: "The data visualization applications market is currently valued at USD 4.12 billion and is expected to grow at a CAGR of 9.21%, to reach USD 6.99 billion by the end of 2022." This is the only slide in the provided set that uses hard financial figures. It positions anual.io within a multi-billion dollar sector, though it does not specify what portion of that market (TAM/SAM/SOM) the company intends to capture.
Slide 8: The Future Vision
Slide 8 features a large-scale presentation environment. The text reads: "Will need animations to help explain complex ideas, structures, and concepts." This slide suggests that the product's utility extends beyond one-on-one client meetings to large-scale public speaking and enterprise-level communication. It reinforces the core thesis that animation is the future of data explanation.
What Works in the anual.io Deck
The deck excels at emotional resonance . By spending five slides on a relatable story, the founders ensure that the investor understands the exact moment of frustration their product solves. The focus on design quality is also a strength; the deck itself is clean and minimalist, which serves as a subtle proof of concept for a company claiming to fix "bad design." The inclusion of specific API integrations (Google AdWords and Analytics) gives the product a sense of technical reality that a purely conceptual deck would lack.
What Is Missing from the anual.io Deck
Despite the strong narrative, the deck is missing almost every critical component of a standard investment pitch. There is no team slide , leaving investors in the dark about who is building the technology. There is no business model ; it is unclear if this is a subscription service, a freemium tool, or an enterprise license. The competitive landscape is ignored, failing to mention established players like Tableau, Looker, or even basic tools like Canva or PowerPoint. Most importantly, there is no ask . The deck does not state how much money is being raised, what the valuation is, or what milestones the funding will achieve. Without these elements, the deck functions as a product demo rather than a fundraising tool.
Founder's Guide: What to Copy and What to Avoid
Founders should copy the persona-based problem definition . Using "Henry" to illustrate a workflow makes the problem tangible in a way that bullet points cannot. However, founders must avoid the lack of operational transparency seen here. A narrative should take up no more than 20% of a deck. The remaining 80% must be dedicated to the 'how' and the 'how much.' If you identify a $4 billion market, you must explain exactly how you will take market share from incumbents. Finally, never omit the team slide ; in early-stage investing, the people are often more important than the product, and anual.io fails to introduce its most valuable asset.
Frequently asked questions
- What problem does anual.io solve?
- According to slide 6, the company addresses the lack of choice in 'quickly translating your ideas into understandable big picture' formats. It specifically targets the inefficiency of presentations made of 'chunks of text' and 'bad design.' By providing automated animations, it helps professionals like the persona 'Henry' explain complex changes to clients who might otherwise reject proposals due to a lack of understanding.
- What is the market opportunity for anual.io?
- Slide 7 states that the data visualization applications market is currently valued at USD 4.12 billion. It further notes a projected Compound Annual Growth Rate (CAGR) of 9.21%, leading to a total market value of USD 6.99 billion by the end of 2022. This suggests the company is positioning itself within a growing enterprise software niche.
- How does the product actually work?
- Slide 4 describes a workflow where a user links their Google account to anual.io. The user then chooses from pre-set animation templates, such as 'Google AdWords Geographic Overview' or 'Google AdWords+Analytics User Flow.' The tool generates short animations intended to help clients understand proposed changes in approximately 60 seconds, bypassing the need for manual design work.
- Who is the target audience for this deck?
- Based on the narrative in slides 2 through 5, the primary target audience is digital marketing professionals or agency account managers who need to present data-driven adjustments to clients. The persona 'Henry' represents a user who struggles to communicate the value of his work, suggesting the tool is a B2B productivity or reporting solution.
- What are the biggest risks in the anual.io pitch?
- The primary risk is the total absence of business fundamentals. The deck does not explain the revenue model (SaaS, per-use, etc.), the cost of customer acquisition, or the technical defensibility of the product. Furthermore, without a team slide, investors cannot assess the founders' ability to execute on the vision or navigate the competitive data visualization landscape.