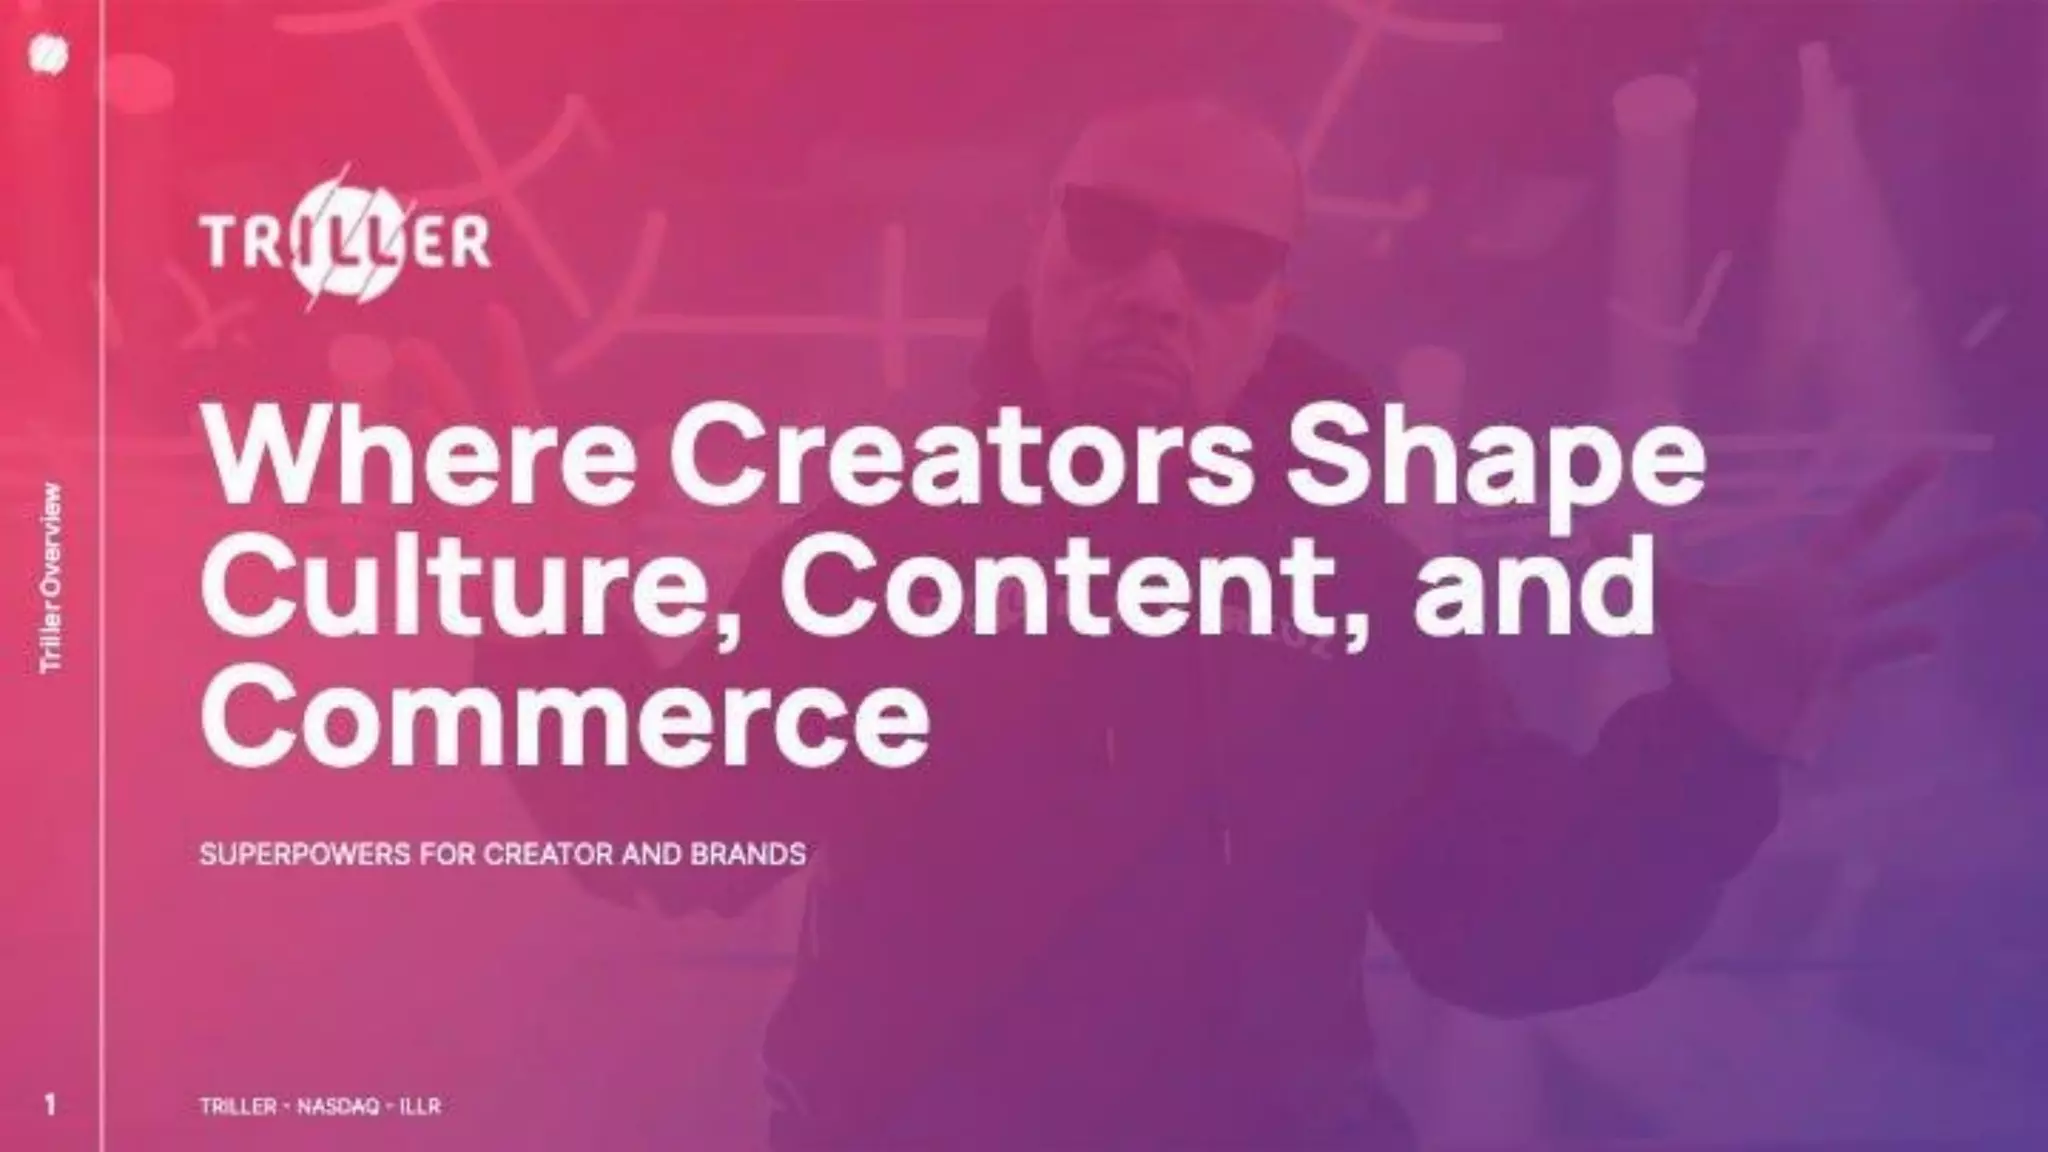
Triller’s 10-slide deck serves as a high-level strategic overview for its transition to public markets, emphasizing its role as an 'open-garden' alternative to Big Tech. The deck leans heavily on the company's M&A activity, showcasing a portfolio of brands like FITE, BKFC, and Verzuz to demonstrate a diversified revenue model spanning sports, music, and the metaverse. While the deck claims significant growth—projecting $100M+ in revenue for 2022 and 350M+ organic downloads—it lacks traditional venture details such as a dedicated team slide, granular unit economics, or a specific breakdown of…
Key takeaways
- The company positions the Creator Economy as a $100B market where Big Tech currently captures >99% of the value (Slide 3).
- Triller claims a massive scale of 350M+ organic app downloads and lists high-profile creators like Charli D’Amelio and Justin Bieber (Slide 7).
- Revenue is shown growing from $49M in 2021 to a projected $100M+ in 2022 (Slide 10).
- The 'Creator Engine' is visualized as a series of interlocking gears representing content creation, distribution, monetization, engagement, and measurement (Slide 6).
- M&A is a core pillar of the roadmap, with the company aiming to be a 'multi-billion, global business with strong operating margins' (Slide 5).
- Triller Sports is highlighted as a major driver, citing the Tyson v. Jones event as the 'No.1 DIGITAL PPV Event Ever' in November 2020 (Slide 8).
- The deck reports a significant spike in 'Creators Tracked/QTR' from 10,000 in 2021 to 2,100,000 in 2022 (Slide 10).
- The deck omits a traditional team slide, detailed financial projections beyond 2022, and a specific 'Ask' or use of funds breakdown.
The Triller Strategy: Aggregation and Open Ecosystems
Triller's pitch deck, reportedly used for a $500 million pursuit to go public, is a study in ecosystem building. Rather than presenting as a simple social media app, the company positions itself as a comprehensive infrastructure for the creator economy. The deck relies heavily on the concept of 'open gardens' versus 'walled gardens,' a direct critique of the business models employed by major incumbents like Meta and ByteDance.
Slide 1: Title and Positioning
The cover slide establishes the brand's core pillars: Culture, Content, and Commerce. The tagline 'Superpowers for Creator and Brands' suggests a B2B2C model where the platform provides the tools (the 'superpowers') for others to generate value. Notably, the slide includes the ticker 'NASDAQ: ILLR,' signaling the company's public market intentions from the outset.
Slide 2: Disclaimers
This is a standard, text-heavy legal disclaimer slide. It clarifies that the presentation is for informational purposes regarding 'Triller Hold Co LLC' and warns that the investment involves a high degree of risk. In a 10-slide deck, dedicating a full slide to legalities is typical for companies entering the public sphere or conducting late-stage private rounds.
Slide 3: The $100B Opportunity
Slide 3 defines the market problem. It values the Creator Economy at $100B+ per year within a larger $500B+ digital content market. The central visual is a pie chart showing that 'Big Tech' captures over 99% of the value, while 'Creators' receive less than 1%. Triller positions itself as the solution to this 'systemic problem' by putting power back into the hands of creators. The mention of 'walled garden' ads highlights the lack of user and data access provided by competitors.
Slide 4: The Triller Roadmap
This slide outlines the transition from a 'powerful open-garden platform' today to an 'undisputed leader' in the future. The roadmap is split into two tracks: technology/creators and brand/business growth. The 'How We Get There' section explicitly mentions 'strategic M&A' and 'accessing capital markets.' A logo cloud at the bottom features acquired or integrated brands like Verzuz, BKFC, FITE, and Amplify.ai, reinforcing the company's status as a conglomerate.
Slide 5: The Creator Engine
Slide 6 (labeled as 7 in the footer) uses a gear metaphor to explain the product ecosystem. The interlocking gears are:
Create Content: Powered by Triller, BKFC, and Verzuz. · Distribute: Leveraging social platforms (Snapchat, Facebook, TikTok, YouTube) alongside owned properties like FITE and Triller TV. · Monetize: Utilizing FITE, Fangage, and Triller NFTs. · Engage: Through Amplify.ai and Crosshype. · Measure: Using Julius and Amplify.ai.
This visualization demonstrates how Triller aims to own every stage of the creator lifecycle.
Slide 6: The App Advantage
Slide 7 (labeled 15) focuses on the flagship Triller app. It claims 350M+ organic app downloads . The slide lists four key advantages: U.S.-based security (a competitive jab at TikTok), a roster of 'The Biggest Creators' (including Justin Bieber and Cardi B), creator control over data/money, and global reach. This slide serves to validate the platform's scale and cultural relevance.
Slide 7: Triller Sports
Slide 8 (labeled 17) highlights the company's success in live sports. It cites the Tyson v. Jones event in November 2020 as the 'No.1 DIGITAL PPV Event Ever.' Key metrics include 5M+ registered FITE users, 2B+ BKFC social media impressions, and 1K+ live events streaming per year. This section emphasizes that Triller is not just a short-form video app but a major player in live, high-intent transactional media.
Slide 8: The Metaverz
Slide 9 introduces 'METAVERZ,' Triller's play for virtual experiences. It categorizes the offering into six areas: Virtual Events (stadiums for concerts/sports), Socialization, Gamification, Theater, Fashion District, and Monetization (blockchain gaming and NFTs). This slide reflects the market trends of the early 2020s, showing Triller's intent to expand into persistent virtual worlds.
Slide 9: Key KPIs and Unit Economics
Slide 10 (labeled 21) provides the most concrete financial and engagement data in the deck. The growth between 2021 and 2022 is portrayed as exponential:
Social Media Actions: 1.6B to 175B. · Content Engagements: 1.6B to 2.3B. · Revenue: $49M to $100M+. · Creators Tracked: 10,000 to 2,100,000. · Brands Tracked: 275 to 25,000.
The right side of the slide lists monetization levers, including revenue share, PPV, and platform fees, though it lacks specific margins or CAC/LTV data.
What Triller Does Well
Ecosystem Visualization: The 'Creator Engine' gear graphic is an effective way to show how disparate acquisitions fit into a single strategic vision. It moves the conversation from 'we bought a bunch of companies' to 'we built a vertically integrated stack.'
Aggressive Positioning: Triller leans into its U.S. roots and 'open' data policies to create a clear contrast with TikTok. In a crowded market, having a 'villain' (Big Tech/Walled Gardens) helps define the company's mission.
Multi-Vertical Proof: By showcasing success in sports (PPV records) and music (Verzuz), the deck proves that the platform's technology is versatile and capable of handling high-value transactions, not just passive scrolling.
What is Missing from the Deck
Team Slide: There is no mention of the leadership team, board of directors, or advisors. For a $500M public market play, the pedigree of the executives managing these complex M&A integrations is a critical omission.
Detailed Financials: While revenue growth is shown, there is no information on burn rate, profitability, or a breakdown of revenue by business unit. Investors cannot see which of the many acquired brands are actually driving the $100M+ top line.
Use of Proceeds: The deck does not specify how the $500M will be spent. Is it for further M&A, debt repayment, or product development? A clear 'Ask' slide is standard for fundraising, even at this scale.
Competitive Landscape: Aside from the 'Big Tech' pie chart, there is no direct comparison to other creator-focused tools or emerging decentralized platforms. The deck assumes Triller is the only 'open' alternative.
Founder Takeaways
Sell the Infrastructure, Not the App: If you are building in a crowded space, don't just pitch a product; pitch an ecosystem. Triller’s focus on the 'Creator Engine' makes the business feel more durable than a single app that might fall out of fashion.
Leverage Macro Trends: Triller successfully tied its pitch to the 'Creator Economy' boom and the geopolitical tensions surrounding TikTok. Aligning your startup with large-scale market shifts makes your success feel inevitable to investors.
Quantify the 'Why Now': The pie chart on Slide 3 is a classic 'Why Now' visual. It identifies a massive disparity in value capture and positions the company as the necessary correction to that imbalance. Every deck needs a version of this 'gap' analysis.
Frequently asked questions
- What is Triller's primary value proposition to creators?
- Triller positions itself as an 'open-garden' platform. Unlike 'walled garden' social media apps (implied to be TikTok or Instagram), Triller claims to put data, fans, and monetization back under the direct control of the creators. Slide 3 and Slide 7 emphasize that creators currently receive less than 1% of the value in the digital content market, and Triller intends to solve this fundamental problem.
- How does Triller generate revenue according to the deck?
- The monetization model is diversified across several streams. Slide 10 lists revenue share, ticket sales, pay-per-view (PPV), subscriptions, merchandise, sponsors, advertising, and platform fees. This multi-pronged approach is supported by their acquisition of sports and music properties like BKFC and Verzuz, which facilitate direct-to-consumer transactions beyond simple ad impressions.
- What role does M&A play in Triller's business strategy?
- M&A is central to Triller's identity as a 'tech & media platform.' Slide 5 and Slide 6 show a 'Roadmap' and 'Creator Engine' built on acquired brands such as FITE, Thuzio, Julius, Amplify.ai, and Fangage. The strategy appears to be aggregating specialized tools and content verticals to create a comprehensive ecosystem for creators to manage their entire business.
- How does Triller differentiate itself from competitors like TikTok?
- Slide 7 explicitly states that Triller is 'Based in the U.S., while other apps have been deemed a threat to national security by government officials.' This is a direct reference to the regulatory scrutiny faced by TikTok. Additionally, Triller emphasizes its 'open' nature regarding data access, contrasting it with the 'walled gardens' of Big Tech mentioned on Slide 3.
- What are the most significant growth metrics shared in the deck?
- The most striking metric is the growth in 'Creators Tracked/QTR,' which jumped from 10,000 in 2021 to 2.1 million in 2022 (Slide 10). During the same period, 'Social Media Actions' rose from 1.6 billion to 175 billion. These figures suggest a massive expansion in the platform's reach and the volume of data it processes through its integrated brands.