Ascend.io positions itself as the 'Enterprise Intelligence Platform' for the Fortune 2000, focusing on the transition of Big Data from an expert-only niche to a mainstream business necessity. The deck, likely for a Series A round, leans heavily on the elite pedigree of its founders (ex-Ooyala, Google, and Twitter) and a macro-historical thesis that technical complexity always yields to abstraction layers like Windows or AWS. Technically, the deck argues for a 'Declarative Data Graph' that allows users to focus on business logic while the platform automates 12 specific manual operations, inclu…
Key takeaways
- The deck relies heavily on the 'pedigree' of the founders (Ooyala, Google, Twitter) to establish immediate credibility in a complex technical space.
- Ascend positions itself as an 'abstraction layer' (the Windows of Big Data), moving from 'Expert' tools to 'Mainstream' accessibility.
- The platform leverages existing big data investments rather than replacing them, acting as a non-disruptive orchestration layer.
- A key differentiator is the shift from 'Imperative' (how) to 'Declarative' (what) data modeling.
- The deck lacks traction data, revenue metrics, or current customer logos, focusing instead on the macro thesis and team.
- The product aims to solve the 'talent shortage' by making SQL and data modeling the only required skills, rather than Scala or Spark expertise.
What this deck actually is
The Ascend.io deck is a Series A-stage narrative designed to bridge the gap between high-level executive pain points and low-level technical infrastructure. It identifies as an "Enterprise Intelligence Platform," but the content reveals it to be a Data Pipeline Automation and Orchestration layer. The single most important finding in this deck is its heavy reliance on executive pedigree and market timing rather than granular product metrics or traction data. By framing Big Data as a "complexity crisis" similar to the pre-Windows era of computing, Ascend positions itself not as a tool for engineers, but as a strategic necessity for the Fortune 2000.
Structurally, the deck follows a classic "Solution-to-a-Market-Shift" framework. It spends significant real estate establishing the scale of the Big Data sector (Slide 3) and the scarcity of talent (Slide 4 and 5) before introducing its specific technical architecture. The deck is notably light on financial performance, user growth, or specific case studies, suggesting it was used at a stage where the product-market fit was being demonstrated through a technical "bet" on abstraction rather than raw revenue volume.
Slide-by-slide walkthrough
Slide 1: Title Slide
The cover slide introduces "ASCEND ENTERPRISE INTELLIGENCE PLATFORM." The visual composition uses a split layout: a clean white panel for text on the left and a right-hand panel featuring a UI screenshot superimposed over a mountain landscape. The imagery is a literal interpretation of the name "Ascend," suggesting a high-level view and "climbing" above complexity. The title is presented in a bold, sans-serif font that conveys a modern, enterprise-grade aesthetic.
Investors read this as a positioning statement. The phrase "Enterprise Intelligence Platform" is deliberately broad. It avoids being pigeonholed as a "database" or "ETL tool," aiming instead for a higher valuation tier associated with "Intelligence." The UI overlay is meant to signal that the product is real and functional, though the "faded" nature of the screenshot makes it more atmospheric than informative. The reader cannot determine the actual functionality or the specific sector the platform serves from this slide alone, as "Enterprise Intelligence" is a ubiquitous term in B2B software.
The strongest version of this slide would include a clear, one-sentence value proposition (e.g., "The automation layer for big data pipelines"). As it stands, "Enterprise Intelligence Platform" could mean anything from a BI dashboard to an AI consulting firm. Defining the category early prevents investor confusion that might persist through the first half of the deck. Including a clearer, non-faded UI element would also provide immediate proof of product maturity rather than just brand atmosphere.
Slide 2: Leadership
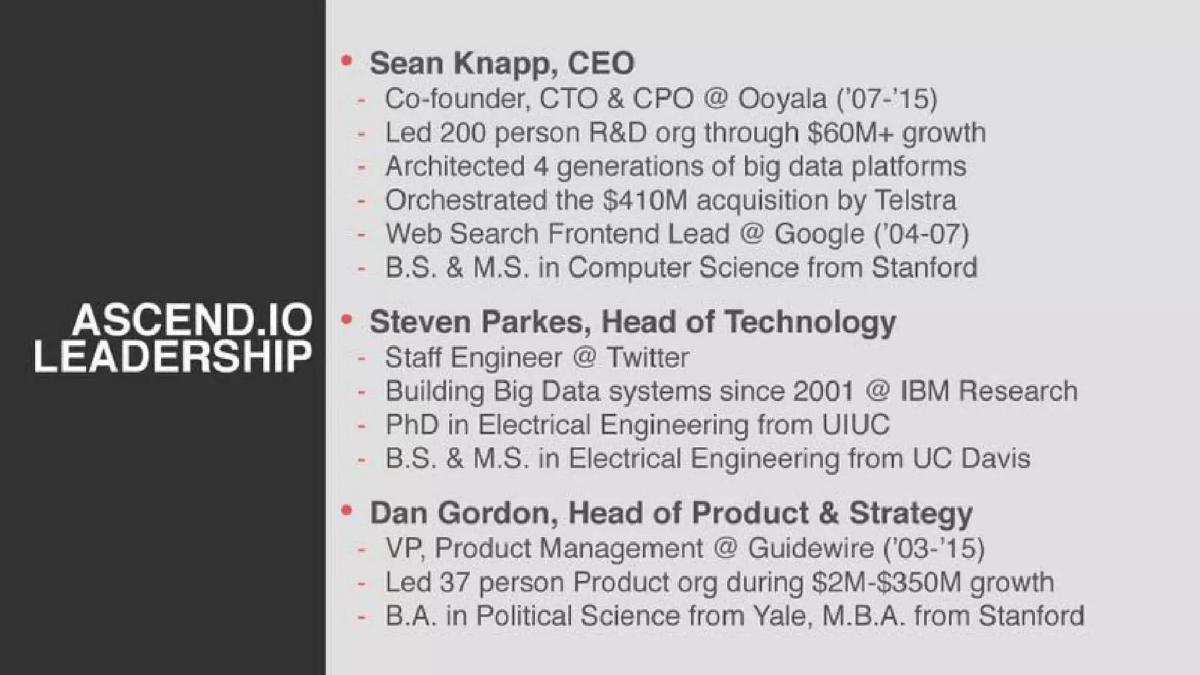
This slide details the pedigree of the three key leaders: Sean Knapp (CEO), Steven Parkes (Head of Technology), and Dan Gordon (Head of Product & Strategy). It highlights significant exits and growth metrics: Knapp is noted as a Co-founder, CTO & CPO at Ooyala where he "Led 200 person R&D org through $60M+ growth" and "Orchestrated the $410M acquisition by Telstra." Steven Parkes is highlighted as a Staff Engineer at Twitter with a PhD from UIUC, having built systems at IBM Research since 2001. Dan Gordon is credited with leading a "37 person Product org during $2M-$350M growth" at Guidewire. Academic credentials from Stanford, Yale, and UC Davis round out the profiles.
For an investor, this is the "Confidence Slide." The presence of this slide so early in the deck (Slide 2) indicates that the founders’ track records are the primary hook for the round. The inclusion of specific R&D headcount and revenue growth figures provides quantitative proof of their ability to scale. It signals that this team has not just built technology, but has successfully navigated the venture-backed lifecycle from inception to massive exit. The emphasis on "Architected 4 generations of big data platforms" for Knapp suggests deep domain expertise that mitigates technical execution risk.
This is an exceptionally strong leadership slide due to the specificity of the numbers provided (e.g., $410M acquisition, $350M growth). However, it could be improved by including the current team size at Ascend. While the past achievements are impressive, investors also want to see that these leaders have successfully recruited a core team for this specific venture. Mentioning the current engineering headcount or key early hires from their previous successful ventures would bridge the gap between their historical wins and current momentum.
Slide 3: The Big Data Opportunity
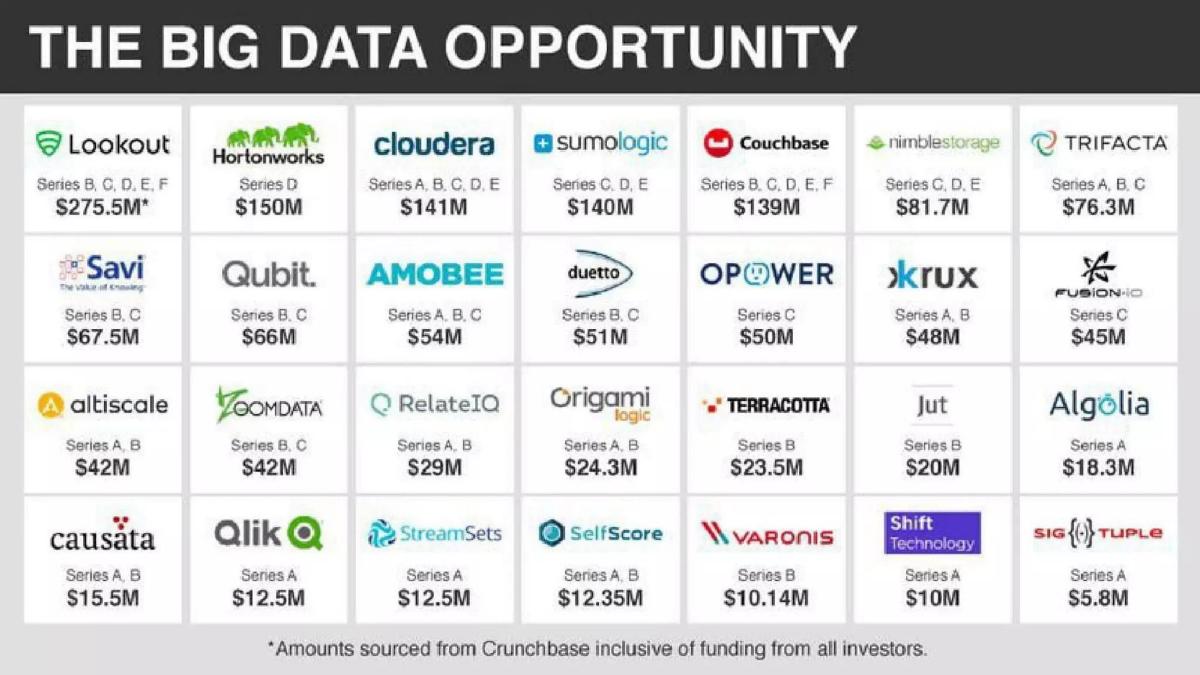
This slide is a 7x4 grid showcasing 28 different logos from the Big Data space, along with their funding stages and amounts. Notable entries include Lookout (Series B-F, $275.5M), Hortonworks (Series D, $150M), Cloudera (Series A-E, $141M), and Sumo Logic (Series C-E, $140M). The funding amounts vary widely, from Sigtuple at $5.8M (Series A) to the hundreds of millions for established names. A footnote clarifies that these figures are sourced from Crunchbase and include funding from all investors. The visual intent is to demonstrate a massive, well-capitalized ecosystem that is already in motion.
An investor sees this and thinks "Validated Market" but also "Crowded Space." By showing the hundreds of millions of dollars flowing into these companies, Ascend is arguing that the market is enormous and the "Big Data" problem is one that enterprises are willing to spend heavily to solve. It creates a sense of FOMO (Fear Of Missing Out) by placing Ascend conceptually among these high-value names. However, without a narrative connector, it is unclear if these companies are intended to be viewed as competitors, partners, or simply examples of the sector's general exuberance.
The weakness of this slide is the lack of a "Why Now" or "What’s Wrong" context within the grid. It simply lists successful companies. A stronger version would categorize these logos into the "Complex Infrastructure" that Ascend intends to simplify. For instance, grouping companies by "Storage," "Processing," and "Analytics" would allow Ascend to place itself horizontally above all of them. This would turn a list of well-funded neighbors into a list of companies that have created the very complexity Ascend is here to solve.
Slide 4: Market Validation Quote
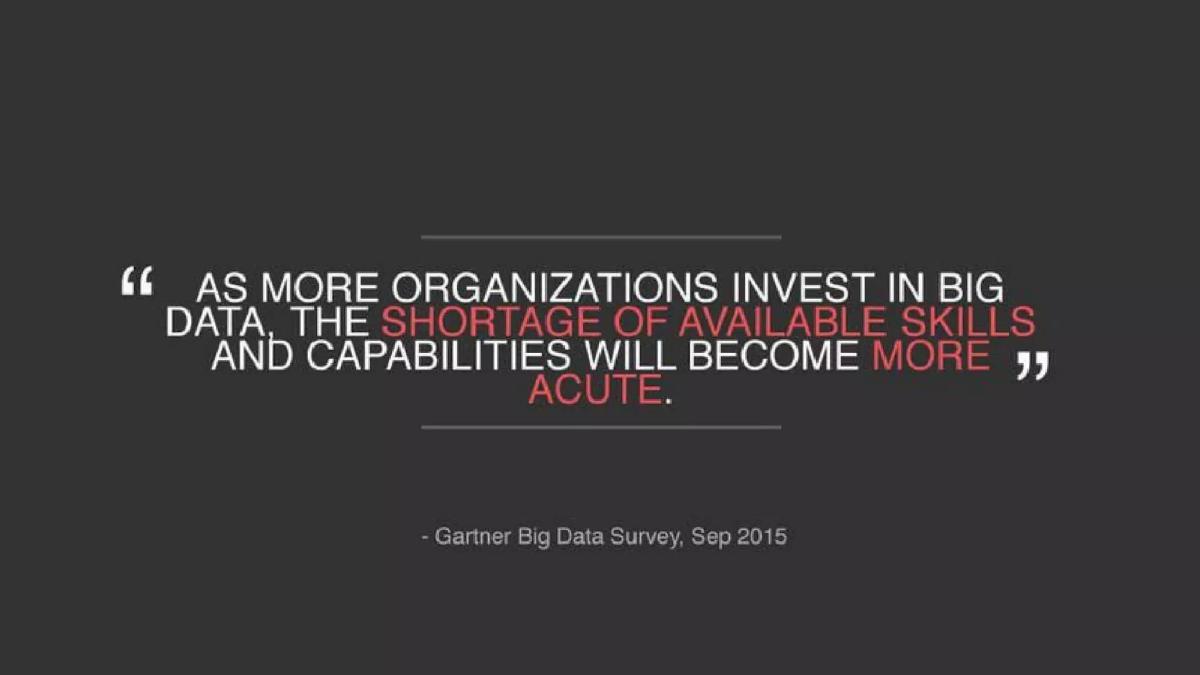
Centered on a dark background is a quote from a September 2015 Gartner Big Data Survey: “As more organizations invest in big data, the shortage of available skills and capabilities will become more acute.” The slide uses a high-contrast design, with white and red text between two thin horizontal lines. The focus is entirely on the "shortage of available skills," which is highlighted in red to draw the eye immediately to the scarcity of human capital in the industry.
Investors interpret this as the "Problem Statement." It identifies the primary bottleneck in the sector: it isn't a lack of raw data or a lack of storage tools, but a lack of people who can effectively use them. This justifies the existence of an "abstraction layer." If companies cannot hire enough Scala experts or distributed systems engineers, they must purchase a platform that removes the need for those specific skills. It moves the conversation from technical specifications to human resource constraints, which is a universal and expensive pain point for the Fortune 2000 target audience.
While the quote is highly relevant, its date (September 2015) might feel slightly dated depending on the exact timing of this deck's presentation. If the deck was used in 2016 or 2017, a 2015 quote is fine, but it remains a secondary source. The strongest version of this slide would supplement the third-party quote with a proprietary data point—for example, quoting a prospect saying, "We have the budget for 10 data engineers but can only find 2." This would ground the Gartner theory in the company's own market interactions.
Slide 5: Common Challenges
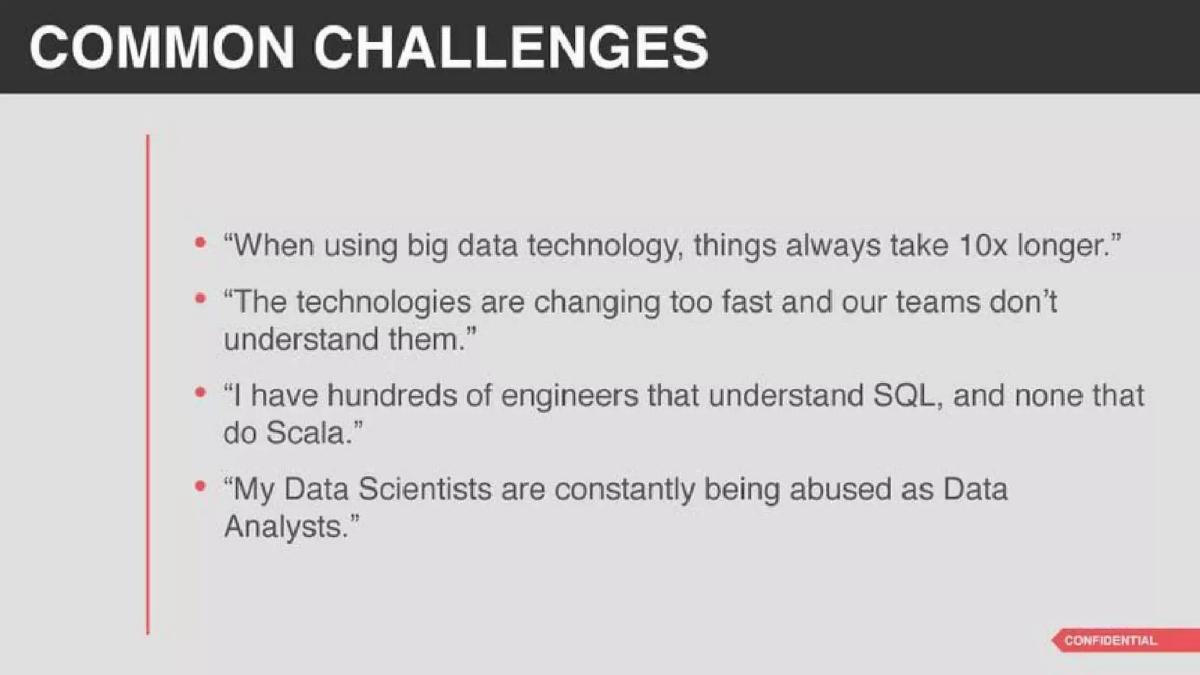
This slide presents four anecdotal quotes representing the "Voice of the Customer." The challenges cited are specific: "When using big data technology, things always take 10x longer," "The technologies are changing too fast and our teams don’t understand them," "I have hundreds of engineers that understand SQL, and none that do Scala," and "My Data Scientists are constantly being abused as Data Analysts." A red "CONFIDENTIAL" bar is placed in the bottom right corner, suggesting these might be insights derived from private customer discovery sessions.
These quotes are highly relatable to any CTO or VPE. The investor reads this as proof that the founders have been deeply engaged with the market. The "SQL vs. Scala" point is particularly sharp because it highlights a specific technical friction point: there are millions of SQL-proficient workers in the global workforce but a tiny fraction who can write production-grade Scala for big data frameworks. The quote about Data Scientists being "abused" hits on a common organizational inefficiency where expensive talent is wasted on data preparation rather than high-value modeling.
The slide would be stronger if these weren't just bulleted quotes but were tied to specific personas or segments (e.g., "The VPE at a Fortune 500 Retailer"). Without attribution, they risk sounding like hypothetical "founder-invented" problems rather than verified market feedback. Additionally, the slide identifies the problems well but does not yet hint at the solution's mechanics, leaving the reader in a "negative" space. A stronger version would include a small "Ascend Response" bullet for each challenge to show immediate product relevance.
Slide 6: History Tells Us
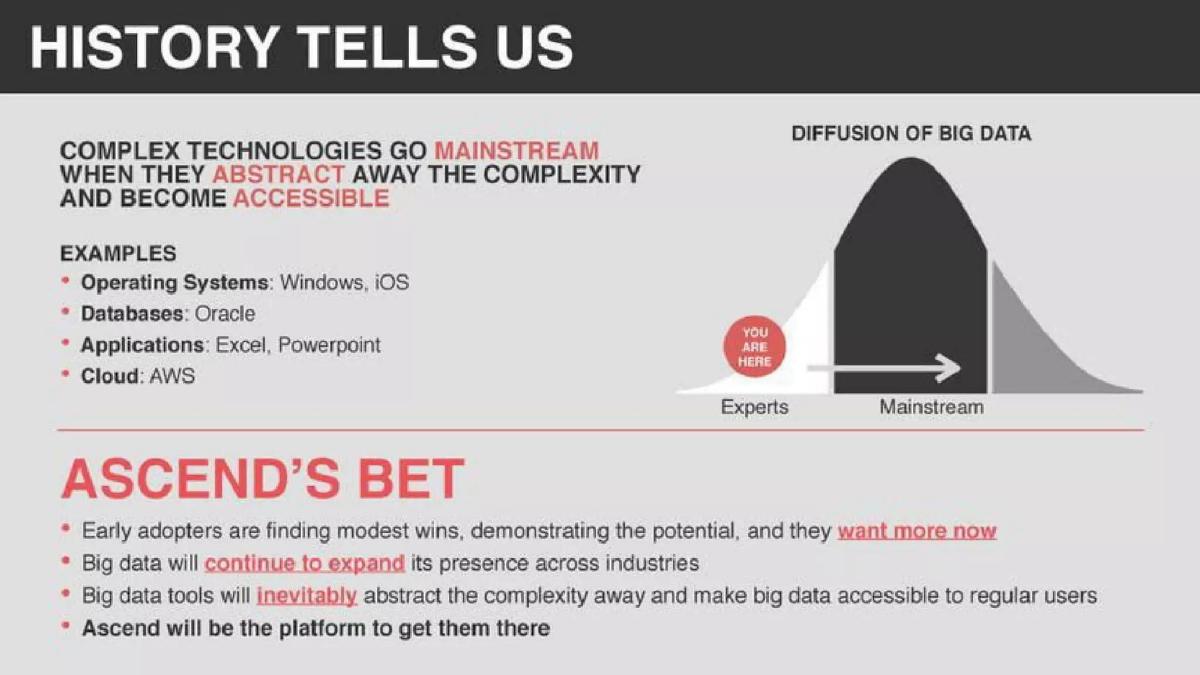
This slide uses a historical analogy to explain Ascend’s market position. It lists how Operating Systems were abstracted by Windows and iOS, Databases by Oracle, Applications by Excel and Powerpoint, and Cloud by AWS. On the right, a bell curve titled "DIFFUSION OF BIG DATA" shows a progression from "Experts" to "Mainstream." A red "YOU ARE HERE" marker is placed right at the beginning of the mainstream inflection point. The slide concludes with "ASCEND’S BET," stating that big data tools will "inevitably abstract the complexity away" and that Ascend will be the platform to get them there.
This is the "Macro Thesis." The investor is being told that Ascend is following a proven historical pattern: complexity always yields to abstraction as a technology matures. By positioning Ascend as the potential "Windows" of Big Data, the founders are making a play for the largest part of the market (the Mainstream) rather than fighting over the smaller "Experts" segment. It shifts the perception of the product from a niche utility to a potential paradigm shift. The use of the bell curve provides a visual "Why Now" argument, suggesting the market is primed for a new layer of software.
The "Ascend's Bet" section is wordy and contains four distinct bullet points that largely repeat the same sentiment. A stronger version would use a simple "Before vs. After" visual to show the transition from "Expert-only code" to "Mainstream-accessible UI." To make the bell curve more effective, the founders should have included specific criteria for why they believe the market is at that specific "inflection point" today—such as the stabilization of underlying open-source projects or a specific threshold of cloud adoption.
Slide 7: Ascend Targets
This slide defines the Go-To-Market strategy across three pillars: Company, Buyer, and User. Targets include Fortune 2000 companies that are "Cloud friendly" across industries like Media, Finance, and IoT. The Buyer is identified as C-suite (CIO/CTO/CDO) or Line of Business heads facing pressures like "Lack of big data experts" and "Migrating to cloud." Crucially, the User is defined as "Non Big Data Developers" or "Data Analysts" whose skillset is "SQL" and "Data Modeling," while "Coding [is] Optional."
Investors use this to evaluate the scalability of the business model. The target list is broad, suggesting a horizontal platform with a large Total Addressable Market (TAM). The most significant detail here is "Coding Optional." This reinforces the "Mainstream" thesis from the previous slide. If the user only needs SQL, the pool of potential users for the product is orders of magnitude larger than if it required Scala or Python. It also indicates a lower barrier to entry for departments outside of core engineering, such as Finance or Marketing.
This slide is notably missing "Current Customers" or even "Pipeline Logos." While it lists "Targets," it doesn't list who is actually using the platform today. Even if the company is in early pilots, showing logos of companies that fit these criteria (e.g., a specific Finance company or a Retail giant) would validate that the "Target" profile is actually based on reality. The "Specific project as driver" bullet is also vague; listing 2-3 common use cases (e.g., "Customer 360" or "Churn Prediction") would make the GTM strategy more concrete.
Slide 8: The Ascend Platform
This slide provides a side-by-side comparison of responsibilities between the customer and the platform. Under "You," there is only one item: "Business Logic." Under "Ascend," there is a list of 12 check-marked automated tasks, including "Integrate data sources," "Data De-Duplication," "Error Recovery," "Data Partitioning," and "Trigger Downstream." A small screenshot of a software dashboard is visible on the right, showing a graph-based interface. A "CONFIDENTIAL" tag appears again in the corner.
This is the "Value Proposition" slide. It clearly communicates a massive reduction in the "grunt work" of data engineering. The checklist is effective because it enumerates the invisible, time-consuming complexities that usually lead to the "10x longer" delay mentioned in Slide 5. The investor sees a clear product-led solution to the labor shortage problem: by automating these 12 items, one analyst can do the work that previously required an entire team of data engineers. It essentially promises to turn "Business Logic" into a finished product with zero operational overhead.
The dashboard screenshot is far too small and low-resolution to be meaningful. A stronger version of this slide would blow up the UI to show exactly how a user defines "Business Logic" (perhaps a simple SQL window) versus how the platform visualizes those 12 automated tasks. The contrast between a single input and the twelve complex outputs would be a powerful visual mnemonic for the platform's efficiency. Furthermore, defining "Data Consistency" or "Error Recovery" in the context of the platform would help technical investors understand the robustness of the automation.
Slide 9: How Ascend Works
This is the "Architecture Slide." It breaks the system into four components: a Data Modeling Interface where users define "Declarative Data Graphs," an Automation Engine that "monitors for changes in data," Distributed Workers that orchestrate infrastructure, and Processing Infrastructure which performs the "majority of data processing." A snippet of code is shown on the left, which points via a red arrow to the four boxes containing the platform's logic and icons.
Investors look for technical "Defensibility" here. The "Declarative Data Graph" is presented as the core innovation. By describing it as "higher-level models," the deck argues that Ascend isn't just a wrapper for other tools, but a sophisticated orchestration layer that "translates" logic into tasks. The explicit mention that "Existing big data infrastructure continues to perform the majority of data processing" is a strategic masterstroke—it means Ascend is not a "rip and replace" solution that requires moving petabytes of data, but rather a "control plane" that sits on top of existing investments. This significantly reduces the perceived risk and cost of adoption.
The diagram is somewhat abstract and does not detail how the "Automation Engine" actually makes decisions. The "Red Arrow" flow from the code to the boxes is clear, but the relationship between "Distributed Workers" and "Processing Infrastructure" could be better defined—specifically, whether these workers reside in the customer's VPC or Ascend's cloud. Clarity on the "deployment model" is often a key gatekeeper question for enterprise investors. A stronger version would also explain what happens when a task fails—does the "Automation Engine" retry, or does it alert the user?
Slide 10: Competitive Advantages
This slide is divided into Business and Technical advantages. Business bullets include "Remove need for big data expertise," "Reduce project times by up to 90%," and "Leverage existing big data investments." Technical advantages focus on "Automated Big Data Operations: 'design once, run forever'," being "Non-Disruptive," and a "Game-changing combination of mutable, persistent, and declarative" architecture. The layout is clean, with a red vertical line separating the two columns of text.
The claim to "Reduce project times by up to 90%" is a bold, quantitative promise that stands out. Investors will immediately want to see the math or a case study backing this up. The technical advantage of "design once, run forever" is a strong marketing hook for VPEs who are tired of their teams spending weekends fixing broken pipelines. By framing the technical traits as "mutable, persistent, and declarative," the company is signaling to technical reviewers that they have solved the fundamental state-management problems that plague big data orchestration.
The slide is text-heavy and lacks any empirical proof for its most aggressive claims. A stronger version would take that "90% reduction" and put it into a mini case study: "Company X used to take 4 months to build a pipeline; with Ascend, they did it in 2 weeks." Quantitative evidence from a real pilot or even a side-by-side benchmark test is always more persuasive than bullet points of potential benefits. Without it, these advantages remain "aspirational" rather than "proven."
Slide 11: Landscape
This slide presents a "Competitor Grid" through the lens of the "Ascend Viewpoint." It categorizes players into four rows: BI & Other Tools (Domo, Tableau) labeled as partners; Big Data Orchestration Tools (Cask, StreamSets) labeled as limited by their "Imperative ('how')" nature; Open Source Ecosystem (Cloudera, Databricks) labeled as "Great technologies upon which we... rely"; and Cloud (Amazon, Microsoft, Google) labeled as "Strong partner potential" with "Some risk of expanding product offerings."
The investor reads this as the company's "Strategic Positioning." Ascend is positioning itself as a partner to almost everyone, which is a common tactic for startups to appear less threatening to incumbents. By claiming that orchestration tools like StreamSets are limited by their "How" (Imperative) rather than "What" (Declarative) nature, Ascend is staking its claim on a superior technical philosophy. This "Imperative vs. Declarative" distinction is the primary technical differentiator of the whole deck. The acknowledgement of cloud providers as a risk shows a level of maturity and realism that investors appreciate.
The "Some risk" mention regarding Cloud providers is honest but could be framed more defensively. A stronger version would explain why the Cloud giants (AWS/Azure) are unlikely to build this specific abstraction layer in the near term—perhaps because their primary incentive is to sell more low-level compute hours rather than to make that compute more efficient or abstracted. Additionally, identifying why the "Imperative" nature of competitors is a dealbreaker for the "Mainstream" user would further solidify Ascend's unique market position.
Slide 12: Conclusion
The final slide features a pun: "BIG DATA IS SUCH A CLUSTER. SEE LIFE FROM THE TOP OF THE STACK WITH ASCEND.IO." It repeats the company logo and maintains the dark gray background with centered red and white text. The messaging returns to the mountain theme established on the title slide, emphasizing the "top of the stack" positioning.
This functions as a call to action and a final reinforcement of the brand identity. The word "cluster" is a clever nod to the technical term "compute cluster" while acknowledging the messy, disorganized reality of the industry that the deck spent the previous eleven slides describing. It ends the deck on a confident, slightly irreverent tone that matches the "Expert" pedigree of the founders. It aims to leave the investor with a feeling of clarity and resolution.
This slide is a missed opportunity for a "The Ask" or a "Milestones" summary. While it works as a visual closer for a verbal presentation, a deck sent to investors usually needs to end with what the company is looking for (e.g., "Raising $15M to scale GTM and Engineering") or a summary of the roadmap they intend to hit in the next 18 months. Leaving the investor with just a pun is memorable, but it doesn't provide the necessary information to drive the transaction forward. The strongest version would have at least one slide following this that outlines the investment opportunity.
Concrete fixes in priority order
Include Proof of Traction: The deck is currently entirely theoretical and architectural. It needs a slide detailing current pilots, revenue, or at least specific user engagement metrics from early testers to prove that the "90% reduction" claim is based on real-world application. · Clarify the "Why Now": While Slide 3 shows a lot of money in the space, it doesn't explain why now is the moment for an abstraction layer. Adding a specific technical catalyst, such as the maturity of cloud data warehouses or the explosion of data sources, would strengthen the market timing argument. · Add "The Ask": The deck lacks a closing slide stating how much capital is being raised and what milestones it will achieve. An investor needs to know the scale of the round to determine if it fits their mandate (e.g., "Raising $10M for Series A"). · Improve the Product Visuals: The screenshots on Slides 1 and 8 are small and faded. High-resolution, clear "before and after" shots of the product in action would do more to explain the "Declarative Data Graph" than the abstract diagrams on Slide 9. · Differentiate from Competitors more clearly: The "Landscape" slide is soft on competition, framing almost everyone as a "partner." A stronger version would explicitly show why a company would choose Ascend over using the native tools provided by well-funded players like Databricks or AWS Glue.
Frequently asked questions
- How does Ascend differentiate itself from established Big Data players like Cloudera or Databricks?
- The deck claims Ascend targets the 'Mainstream' user (Data Analysts, Non-Big Data Developers) by using a 'Coding Optional' and 'SQL' based interface, whereas incumbents target 'Experts.'
- What are the primary business benefits cited by the platform?
- Ascend claims to 'reduce project times by up to 90%' and 'remove the need for big data expertise' by automating 12 specific operational tasks including de-duplication, error recovery, and data partitioning.
- What evidence of leadership capability does the deck provide?
- The deck emphasizes the founding team's pedigree, specifically CEO Sean Knapp's role in the $410M acquisition of Ooyala and Head of Product Dan Gordon's role in scaling Guidewire from $2M to $350M.
- What is the core technology behind the Ascend platform?
- The 'Declarative Data Graph' is the core technical innovation, allowing users to define business logic while the platform's automation engine handles the underlying infrastructure orchestration and monitoring.
- Which industries is Ascend targeting?
- The deck identifies target sectors as Media, Consumer, Retail, Finance, and IoT, specifically focusing on Fortune 2000 companies that are 'Cloud friendly.'