HowGood’s Series B deck is a masterclass in data-driven storytelling. Rather than relying on emotional appeals regarding climate change, the company presents itself as a critical infrastructure layer for the food and beverage industry. By quantifying their database—boasting 15 years of supply chain mapping and 33,000 ingredients—they establish immediate defensibility. The deck clearly bifurcates their offering into 'Impact Platform' (SaaS) and 'Impact Data' (DaaS), showing how they serve both internal product development and external consumer marketing. While the deck lacks a formal team slid…
Key takeaways
- The company claims to have the world's largest product sustainability database, a core competitive advantage stated on slide 2.
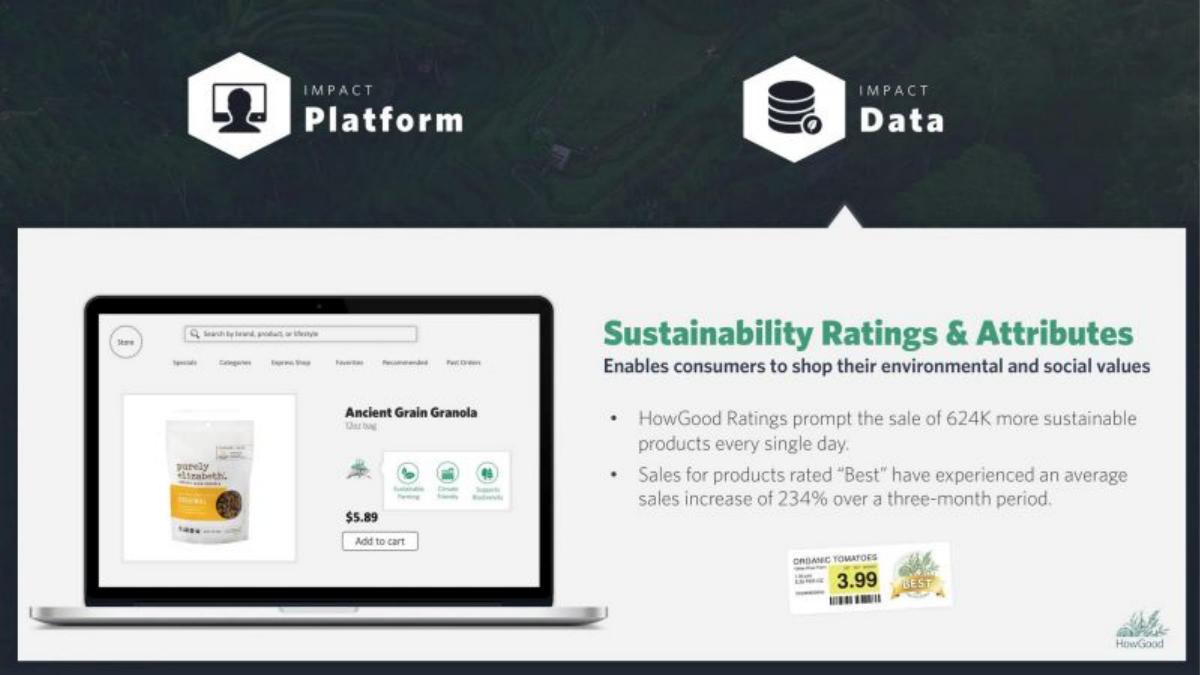
- HowGood reports that products rated 'Best' by their system saw an average sales increase of 234% over three months, as shown on slide 6.
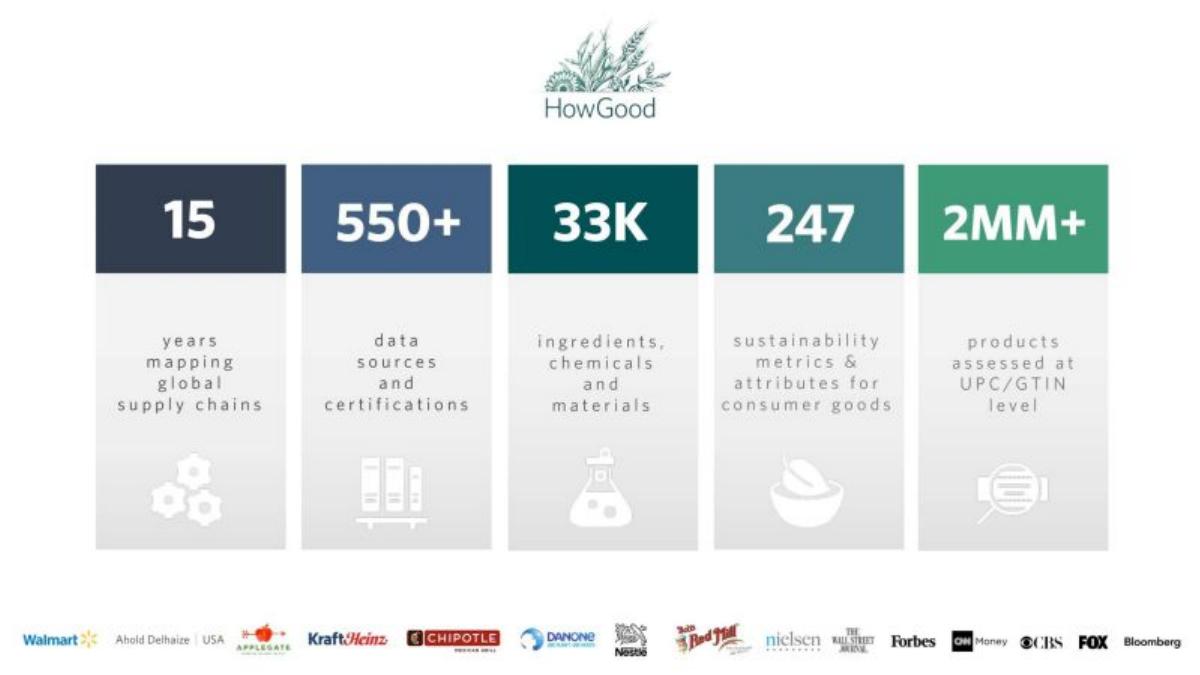
- The database includes over 2 million products assessed at the UPC/GTIN level, supported by 15 years of supply chain mapping (slide 3).
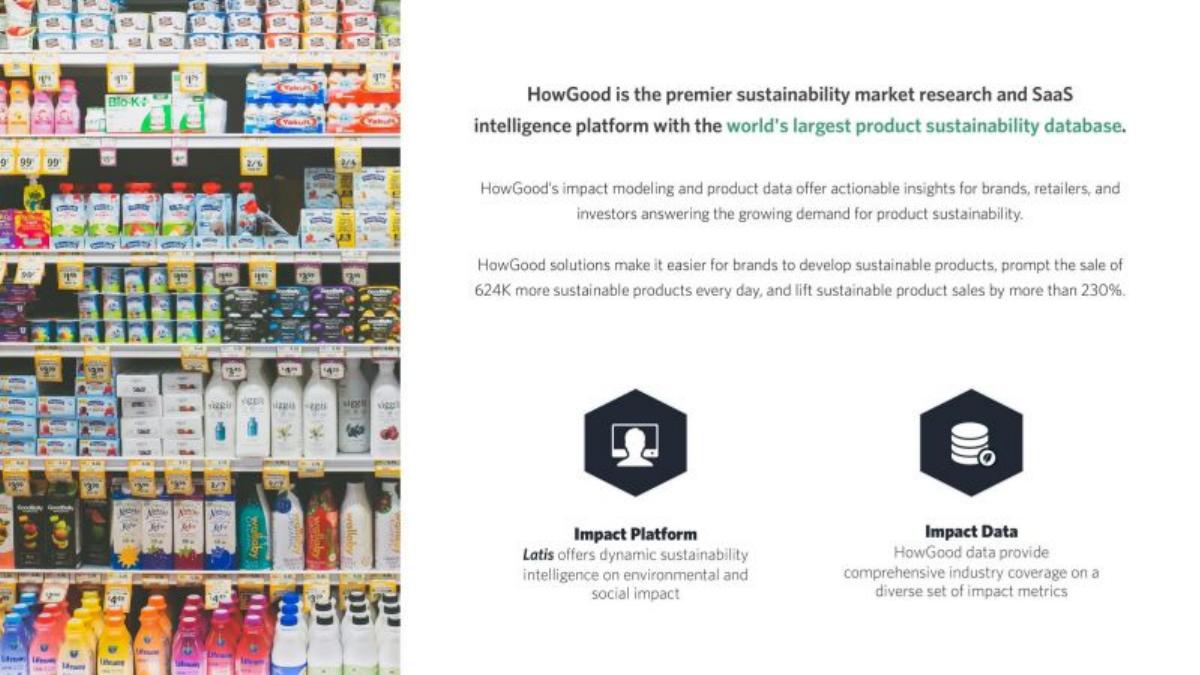
- The business model is split into two distinct revenue streams: the Latis Impact Platform and Impact Data (slide 2).
- A combined Total Addressable Market (TAM) is calculated at $16,617,520,722, broken down by specific industry verticals on slide 8.
- The deck highlights high-profile partnerships and media mentions, including Walmart, Kraft Heinz, Chipotle, and Danone (slide 3).
- Future growth is mapped through a product development plan that expands from food into apparel, cleaning supplies, and HABA verticals (slide 9).
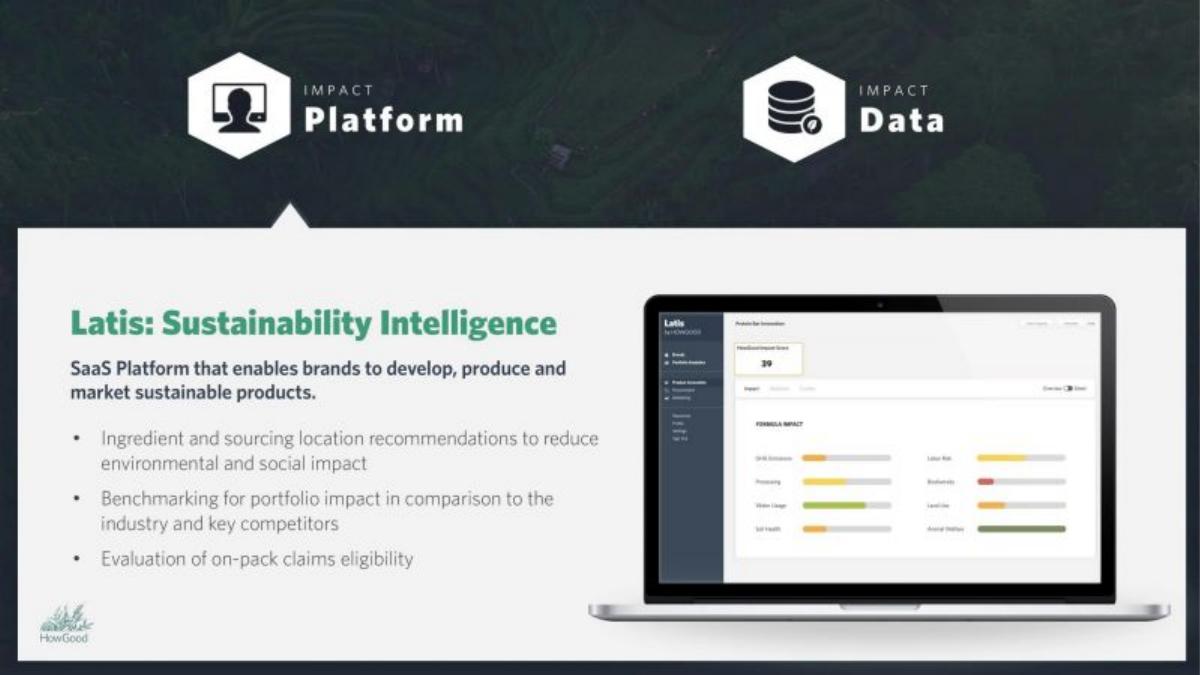
- The Latis platform enables brands to evaluate on-pack claims eligibility and benchmark against competitors (slide 4).
The Data-Heavy Series B Strategy
HowGood’s Series B deck is a concise, 11-slide presentation that prioritizes data depth over narrative fluff. In the sustainability sector, where 'greenwashing' is a constant concern, HowGood uses its 15-year history and massive database to position itself as the objective source of truth for the food industry. The deck is structured to prove three things: they have the most data, that data drives sales, and the market for that data is multi-billion dollar in scale.
Slide 1: Title Slide
The deck opens with a high-resolution aerial shot of terraced agriculture, immediately signaling the company's focus on the intersection of nature and industry. The HowGood logo, featuring stylized grains and flora, is centered. There is no tagline or mission statement here; the imagery does the heavy lifting for the brand's aesthetic.
Slide 2: The Core Offering
Slide 2 introduces HowGood as a 'premier sustainability market research and SaaS intelligence platform.' It makes a bold claim: they possess the 'world's largest product sustainability database.' The slide introduces the two-pillar business model: Impact Platform (the Latis software) and Impact Data (the raw intelligence). Crucially, it includes a teaser metric: their solutions lift sustainable product sales by more than 230%.
Slide 3: The Proof in Numbers
This is the 'Traction and Scale' slide. It uses five large callouts to establish authority: 15 years of supply chain mapping, 550+ data sources, 33K ingredients/materials, 247 sustainability metrics, and 2MM+ products assessed. The bottom of the slide features a 'trust bar' with logos including Walmart, Ahold Delhaize, Kraft Heinz, Chipotle, Danone, and Nestle, alongside major media outlets like Bloomberg and The Wall Street Journal. This slide effectively communicates that HowGood is not a startup experimenting with a new idea, but an established player with massive data moats.
Slide 4: Latis - Sustainability Intelligence
This slide focuses on the SaaS product, Latis. It lists three key features: ingredient/sourcing recommendations, competitive benchmarking, and evaluation of on-pack claims. A laptop mockup shows the interface, which appears to use a simple horizontal bar chart system to grade products on GHGs (Greenhouse Gases), Processing, Water Usage, Soil Health, Labor Risk, Biodiversity, Land Use, and Animal Welfare. This slide answers the 'How does it work?' question for a B2B buyer.
Slide 5: Beyond ESG Reporting
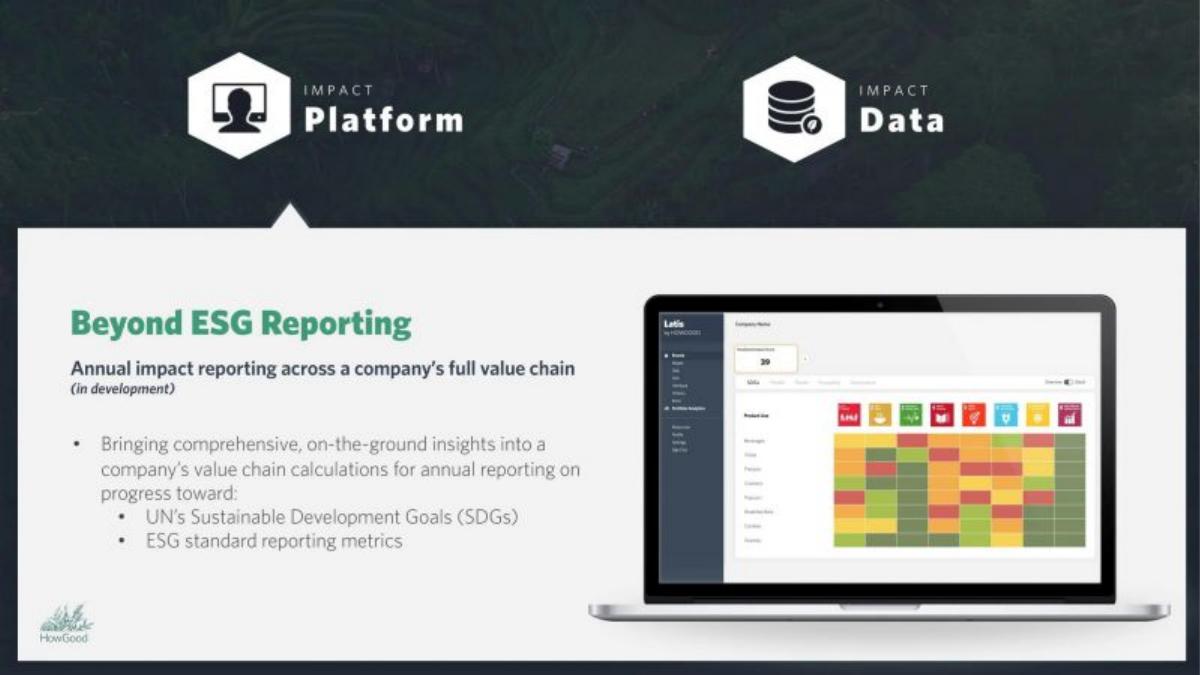
Slide 5 positions the company as a forward-looking tool rather than just a compliance checker. It mentions annual impact reporting across the full value chain (noting this is 'in development'). It specifically ties their metrics to the UN’s Sustainable Development Goals (SDGs) and ESG standard reporting metrics. This is a strategic move to capture the growing budget companies are allocating toward ESG compliance.
Slide 6: Sustainability Ratings & Attributes
This slide targets the retail and consumer angle. It shows how HowGood ratings appear in an e-commerce context (using a mockup of 'Ancient Grain Granola'). The slide repeats the impressive statistic that products rated 'Best' see a 234% sales increase. It also shows a physical price tag mockup with a 'Best' HowGood seal, demonstrating the omnichannel utility of their data.
Slide 7: Quantitative Impact Analysis
Using Chipotle’s 'Real Foodprint' as a case study, this slide shows how HowGood powers transparency in brand communications. The mobile mockup displays specific savings: '179.6 grams less carbon,' '1.7 gallons water saved,' and '13.2 sq feet improved soil health.' This slide proves the platform's ability to turn complex data into consumer-friendly marketing assets.
Slide 8: Total Addressable Market (TAM)
HowGood provides a very specific TAM calculation, totaling $16,617,520,722 . They break this down by revenue stream. The Impact Platform TAM ($11.9B) includes segments like CPG-Food, Retailers, and Apparel. The Impact Data TAM ($4.7B) includes Retailers, Food Service, and ESG. Providing these hyper-specific numbers (down to the dollar) suggests a bottom-up calculation that gives investors confidence in the market opportunity.
Slide 9: Product Development Plan
This slide is a combined roadmap and growth chart. It shows how the TAM expands over time as new modules (Nutrition, Procurement, Marketing, Packaging) and new verticals (CPG, ESG, Cleaning Supplies, Apparel) are released. A 'Today' line sits in the middle of the chart, showing that the company is currently entering its most aggressive growth phase. This is a classic Series B slide designed to show how the new capital will unlock larger market segments.
Slide 10: Key Differentiators
The penultimate slide summarizes the competitive advantage into six buckets: Unparalleled Industry Coverage, Comprehensive Impact Analysis, Unique Market Positioning, Best in Class Data, Industry Thought Leaders, and First to Market. It serves as a summary of the preceding slides, reinforcing the 'data moat' narrative.
Slide 11: Closing Slide
The deck ends simply with the HowGood logo on a white background. There is no contact information or 'Thank You' text on this slide, maintaining the minimalist aesthetic of the presentation.
What HowGood Does Well
The HowGood deck excels at quantifying the unquantifiable . Sustainability is often viewed as a 'soft' metric, but HowGood uses hard numbers—15 years, 2 million products, 234% sales lift—to treat it like any other supply chain or fintech problem. By focusing on the sales lift for retailers, they move the conversation from 'doing good' to 'making money,' which is essential for a Series B pitch.
The bifurcation of the business model into Platform and Data is also a strong move. It shows investors that the company has multiple ways to monetize the same core asset (their database), increasing the potential for high-margin recurring revenue.
What Is Missing from the Deck
The most notable omission is a Team Slide . For a Series B, investors typically want to see the leadership team's pedigree, especially in a data-heavy field. While the catalogue facts mention the round was successful, the absence of the founders' backgrounds in the deck is unusual.
There is also a lack of Unit Economics . While the TAM is large, the deck does not disclose Customer Acquisition Cost (CAC), Lifetime Value (LTV), or current Annual Recurring Revenue (ARR). For a Series B, these are usually mandatory. It is highly likely these were presented in a separate financial model or a more detailed version of the deck not included in this 11-slide summary.
Finally, there is no Competition Slide . While they claim to be 'First to Market,' the ESG and sustainability data space is crowded with players like EcoVadis or Carbon Trust. Explaining why HowGood’s UPC-level data is superior to these competitors would have strengthened the 'defensibility' argument.
Founder Takeaways
Lead with your moat: If you have spent years building a proprietary database, make that the star of the show. HowGood’s 15-year head start is their strongest defense against new entrants. · Tie impact to revenue: Don't just say your product is better for the planet; prove it sells more units. The 234% sales lift metric is likely the single most important data point in this deck. · Segment your TAM: Instead of one giant, vague number, break your market down by vertical and product line. It shows you have a sophisticated understanding of your sales pipeline. · Visual consistency: The use of high-quality mockups (laptops, phones, and even physical price tags) helps investors visualize exactly how the product exists in the real world.
Frequently asked questions
- What is the primary value proposition of the HowGood platform?
- HowGood positions itself as a sustainability intelligence platform that helps brands develop and market sustainable products. According to slide 4, their Latis platform provides ingredient sourcing recommendations, competitive benchmarking, and evaluation for on-pack sustainability claims. This allows companies to move beyond simple reporting and into active product optimization based on environmental and social impact metrics.
- How does HowGood quantify its market impact for retailers?
- On slide 6, the company provides specific performance data: their ratings prompt the sale of 624,000 more sustainable products every day. Furthermore, they claim that products receiving their 'Best' rating experience an average sales lift of 234% over a three-month period. This transforms sustainability from a compliance cost into a documented revenue driver for retail partners.
- What industries does HowGood plan to expand into?
- While currently focused on food and ingredients, slide 9 outlines a clear expansion path. The product development plan shows the company moving into Personal Care, HABA (Health and Beauty Aids), Cleaning Supplies, and Apparel. The TAM for the 'Platform' side of the business in these new verticals is estimated at $11.9 billion, significantly larger than the initial food-focused segments.
- What specific data points power the HowGood database?
- As detailed on slide 3, the database is built on 15 years of mapping global supply chains. It incorporates over 550 data sources and certifications, covering 33,000 ingredients, chemicals, and materials. This results in 247 distinct sustainability metrics and attributes that can be applied to over 2 million individual products at the UPC level.
- Is there a team or financial slide in this deck?
- No. This specific 11-slide version of the deck omits a team slide, detailed historical financials (such as ARR or burn rate), and a specific 'Ask' slide detailing the terms of the round. It focuses almost entirely on the product capability, data defensibility, and market size. Founders should note that these slides were likely part of a larger data room or a supplemental deck.