The HubSpot 4Q15 investor deck serves as a strategic roadmap for a company moving from a single-product tool to a multi-product platform. By late 2015, HubSpot had surpassed 18,000 customers and was aggressively targeting a $33 billion total addressable market across the US, Canada, and Europe. The deck leans heavily into the 'Inbound' methodology as a competitive moat, contrasting it against traditional 'interruption' marketing. Financially, the deck demonstrates impressive efficiency, showing gross margins climbing to 75% and average subscription revenue per customer increasing from $5,395…
Key takeaways
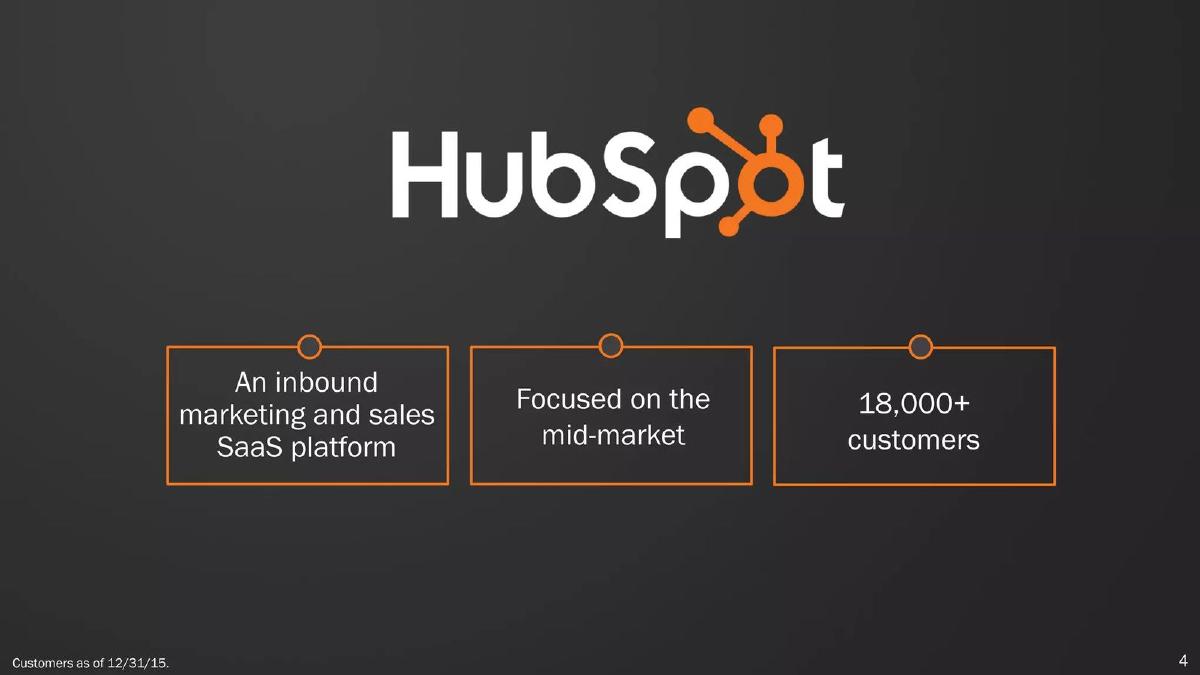
- HubSpot defined its core identity as an inbound marketing and sales SaaS platform focused specifically on the mid-market (Slide 4).
- The company reported a customer base of over 18,000 as of December 31, 2015 (Slide 4).
- A clear competitive dichotomy is established between 'Traditional' (Cold Calling, Spam, Ads) and 'Inbound' (SEO, Blogging, Social) (Slide 7).
- The platform is positioned as an 'All-In-One' solution covering the entire funnel from Visitor to Customer (Slide 10).
- Total Addressable Market is calculated at $33 billion, based on 3 million companies in the US, Canada, and Europe (Slide 16).
- The 'Inbound Movement' is quantified through ecosystem metrics, including 2.5 million monthly blog visits and 2,900+ certified partners (Slide 19).
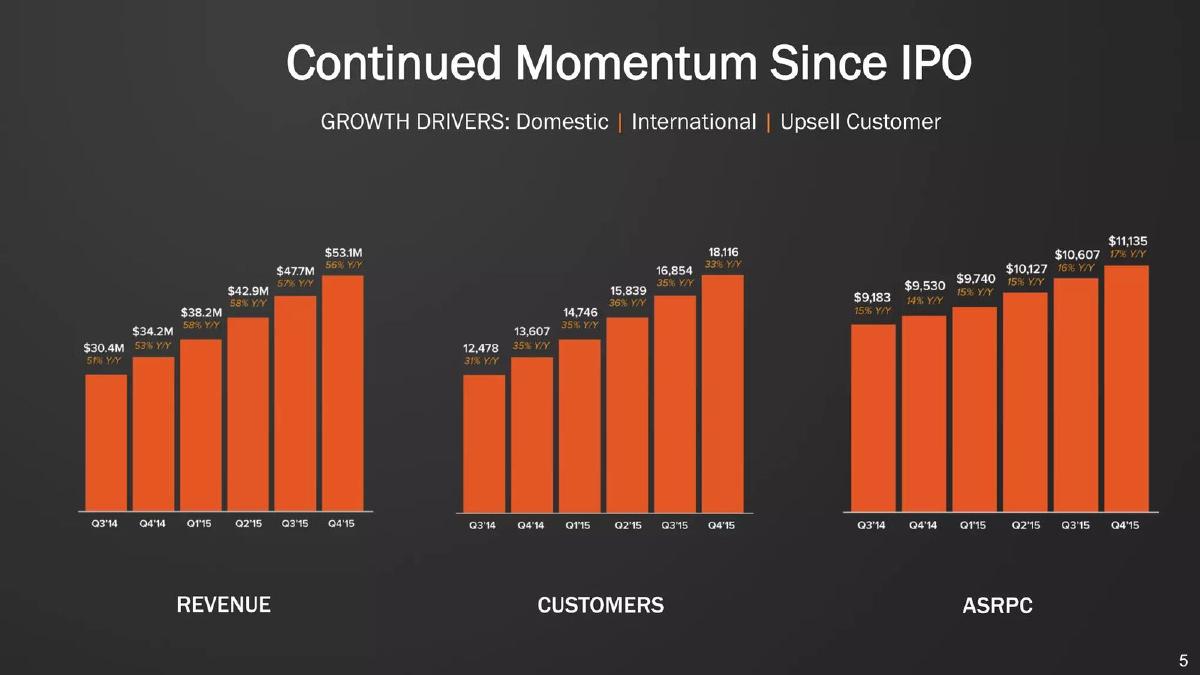
- Average Subscription Revenue Per Customer (ASRPC) saw a steady climb from $5,395 in 2011 to $11,135 in Q4 2015 (Slide 22).
- Gross margins improved significantly over time, reaching 75% by the end of 2015 compared to 61% in 2011 (Slide 26).
Executive Summary: The Category Creator's Playbook
The HubSpot 4Q15 Investor Marketing Deck is a definitive example of how a SaaS company communicates scale and efficiency to the public markets. By late 2015, HubSpot was no longer a startup; it was a publicly traded entity proving that its 'Inbound' philosophy could translate into a massive, sustainable business. The deck focuses on three core pillars: category dominance, platform expansion, and improving unit economics. With 18,000+ customers and a clear path toward a $33 billion market, the presentation serves to reassure investors that the company's high sales and marketing spend was successfully capturing a loyal, growing mid-market audience.
Slide 1: Title Slide
The deck opens with the iconic HubSpot logo on a dark, minimalist gradient background. There is no subtitle or date on the cover slide, relying entirely on brand recognition. The simplicity suggests a company that is confident in its identity and does not need to over-explain its purpose on the first page.
Slide 4: The HubSpot Value Proposition
This slide serves as the 'Company at a Glance.' It defines HubSpot as an 'inbound marketing and sales SaaS platform.' Crucially, it identifies their target segment as the 'mid-market.' By explicitly stating this, HubSpot differentiates itself from enterprise-focused competitors like Salesforce or small-business tools like Mailchimp. The slide also highlights a major milestone: 18,000+ customers as of December 31, 2015. This provides immediate proof of product-market fit and scale.
Slide 7: Traditional vs. Inbound
HubSpot uses this slide to reinforce its category-creation strategy. By contrasting 'Traditional' marketing (represented by a megaphone and tactics like cold calling and spam) against 'Inbound' marketing (represented by a magnet and tactics like SEO and blogging), they frame their product as the modern solution to an outdated problem. This is a classic positioning tactic that makes the competitor's approach seem not just different, but obsolete.
Slide 10: The All-In-One Platform
This slide introduces the concept of the 'Growth Platform.' It uses a funnel graphic to show how HubSpot manages the entire customer lifecycle: Visitor, Lead, Opportunity, and Customer. This transition from a 'marketing tool' to an 'All-In-One Marketing & Sales Growth Platform' is a key strategic shift. It signals to investors that HubSpot is expanding its footprint within each customer, increasing stickiness and potential lifetime value.
Slide 13: Product Visualization (Social Inbox + Inbound Database)
Instead of abstract feature lists, Slide 13 shows a real screenshot of the HubSpot product from March 2015. It demonstrates the 'Social Inbox,' showing how users can track interactions with specific leads and customers. The icons at the bottom (Visitor, Lead, Customer) tie back to the funnel shown on Slide 10, grounding the high-level strategy in actual software functionality.
Slide 16: Total Addressable Market (TAM)
HubSpot presents a $33 billion TAM. The calculation is transparent: 3 million companies (1.6M in North America and 1.4M in Europe) multiplied by an Average Subscription Revenue Per Customer (ASRPC) of $11,135. The slide also notes that international expansion and new products will continue to grow this number. Using a pyramid graphic, they suggest they are only scratching the surface of the available market opportunity.
Slide 19: The Inbound Movement
This slide quantifies the 'moat' HubSpot has built through content and community. It lists impressive figures: 130,000+ LinkedIn members, 14,000+ INBOUND conference attendees, 27,000+ certified professionals via HubSpot Academy, and 2.5 million monthly blog visits. For an investor, these aren't just vanity metrics; they represent a massive, low-cost lead generation engine and a high barrier to entry for competitors.
Slide 22: Average Subscription Revenue Per Customer (ASRPC)
This is one of the most important financial slides in the deck. It shows a clear upward trajectory in revenue per customer, nearly doubling from $5,395 in 2011 to $11,135 in Q4 2015. The chart attributes this growth to the shift from selling just 'Editions' to a model that includes 'Contacts' and 'Add Ons.' This demonstrates that as HubSpot's customers grow their own businesses, HubSpot captures a share of that growth automatically.
Slide 26: Key Financial Metrics
This table provides a multi-year look at the company's efficiency. Key data points include:
Gross Margin: Improved from 61% in 2011 to 75% in 2015. · S&M (Sales & Marketing): Decreased from 82% of revenue in 2011 to 58% in 2015, showing increasing sales efficiency. · Operating Loss: Narrowed from -69% in 2011 to -8% in Q4 2015. · CFFO (Cash Flow from Operations): Reached 0% for the full year 2015, a critical milestone for a high-growth SaaS company.
Slide 30: GAAP to Non-GAAP Reconciliation
The final slide in this selection is a dense financial table. It provides full transparency by reconciling GAAP losses to non-GAAP figures, stripping out stock-based compensation and amortization. This level of detail is standard for public companies but serves as a reminder of the rigor required when reporting to institutional investors. It shows that while the GAAP loss for 2015 was $46.4 million, the non-GAAP loss was a more manageable $25.0 million.
What HubSpot Does Exceptionally Well
HubSpot excels at category ownership . They don't just sell software; they sell a methodology ('Inbound'). By the time an investor reaches the financial slides, they are already convinced that the 'Inbound' way is the future of marketing. This makes the financial metrics feel like a foregone conclusion rather than a risky bet.
Furthermore, the deck is data-transparent . Many companies hide their revenue per customer or their sales efficiency metrics. HubSpot puts them front and center, showing the year-over-year improvements. This builds trust and demonstrates that management has a firm grip on the levers of their business model.
What is Missing from the Deck
Because this is an investor update deck rather than a seed-stage pitch, certain elements are omitted. There is no team slide in this selection, likely because the executive team was already well-known to the market. There is also no specific 'Ask' ; as a public company, this deck is intended for quarterly earnings or general investor relations rather than a specific funding round.
Additionally, while the deck mentions 'New Products,' it provides very little detail on the product roadmap . It focuses heavily on what has already been built and the current financial results, rather than the specific technical innovations planned for the next 24 months.
Lessons for Founders
1. Create a Dichotomy: If you are building something new, define the 'Old Way' vs. the 'New Way' as clearly as HubSpot does on Slide 7. Make the old way look painful and the new way look like an inevitable magnet.
2. Monetize Customer Success: HubSpot's ASRPC growth (Slide 22) is a masterclass in pricing strategy. By charging based on 'Contacts,' they ensured that their revenue would grow as their customers became more successful. Founders should look for 'value metrics' that scale with their users.
3. Build an Ecosystem: Slide 19 shows that HubSpot is more than a tool; it's a community. If you can train and certify your users, you create a workforce of advocates who will take your software with them to every new job they get. This is the ultimate defensive moat.
4. Focus on Gross Margin: The steady climb from 61% to 75% gross margin (Slide 26) is what allows a SaaS company to eventually become profitable. Founders should be able to explain how their margins will improve as they scale, even if they are currently losing money on an operating basis.
Frequently asked questions
- What was HubSpot's primary target market in 2015?
- As stated on Slide 4, HubSpot was explicitly focused on the mid-market. They defined their Total Addressable Market (Slide 16) by looking at 3 million companies across the US, Canada, and Europe, specifically highlighting 1.6 million mid-market businesses with a web presence in North America and 1.4 million in Europe.
- How did HubSpot differentiate itself from traditional marketing tools?
- HubSpot utilized a 'Us vs. Them' framework (Slide 7), branding traditional methods like cold calling and ads as 'interruption' marketing. They positioned their 'Inbound' approach—focusing on SEO, blogging, and social media—as a magnet that attracts customers rather than chasing them, effectively creating a new category of software.
- What were the key drivers of HubSpot's revenue growth per customer?
- Slide 22 illustrates that Average Subscription Revenue Per Customer (ASRPC) grew from $5,395 to over $11,000. This was driven by a transition from selling simple 'Editions' to a bundled model of 'Editions + Contacts + Add Ons,' allowing the company to monetize the growth of their customers' databases.
- How healthy were HubSpot's financial margins during this period?
- According to Slide 26, HubSpot's gross margins were robust and improving, hitting 75% in 2015. While the company was still reporting an operating loss (-8% non-GAAP in Q4 2015), their Cash Flow from Operations (CFFO) had reached a break-even point (0%) for the full year 2015, indicating a path to profitability.
- What role did the 'Inbound' community play in their business model?
- The community was a core part of their 'moat.' Slide 19 details an ecosystem consisting of 130,000+ LinkedIn group members, 14,000+ conference attendees, and 27,000+ certified professionals. This ecosystem provided a steady stream of low-cost leads and a network of 2,900+ partners who helped implement the software.