Parallel Learning’s Series A deck is a concise, 10-slide presentation that successfully navigated the intersection of EdTech and HealthTech during a period of significant market tailwinds. By focusing on the 'broken' status quo of neurodiverse student support—specifically citing a 6-month wait time for diagnosis—Parallel positioned itself as a high-efficiency alternative capable of delivering results in just two weeks (Slide 4). The deck is notable for its heavy emphasis on unit economics, dedicating two full slides to margins and cost reduction strategies, which likely provided the financial…
Key takeaways
- The deck highlights a massive market opportunity driven by COVID-19 tailwinds affecting over 15 million students with learning differences (Slide 3).
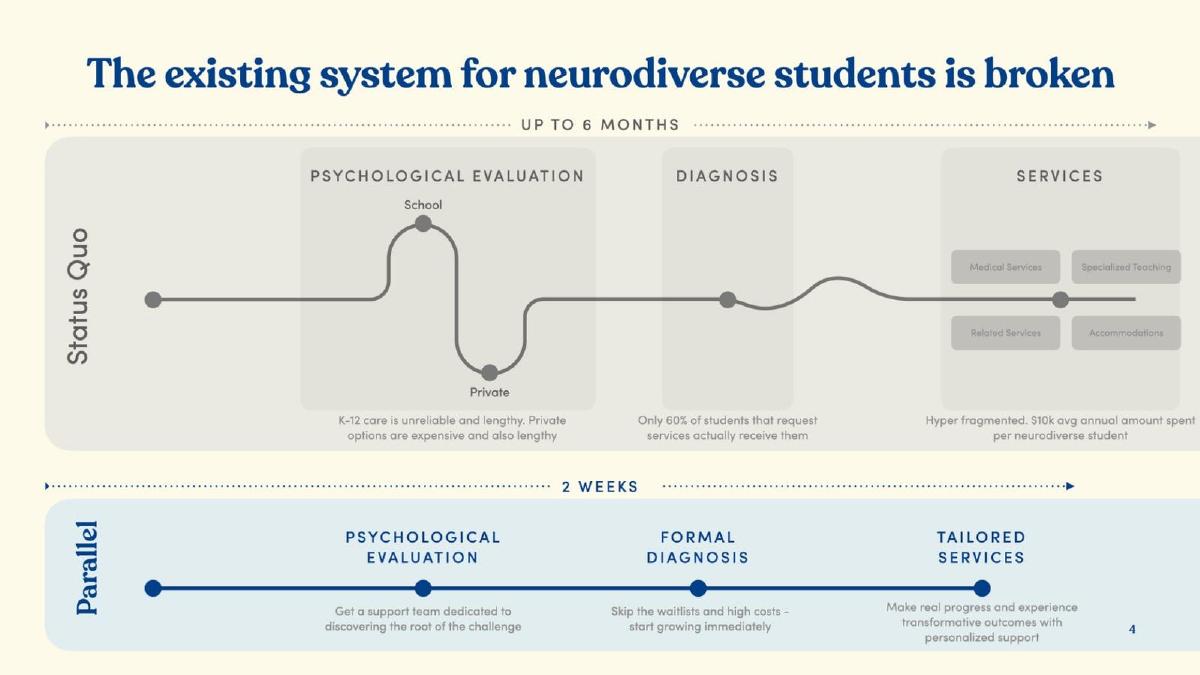
- Parallel positions its value proposition on speed, claiming to reduce the evaluation-to-diagnosis timeline from 6 months to 2 weeks (Slide 4).
- The business model is diversified across four payment pillars: Cash Pay, K-12 Schools, Government, and Insurance (Slide 3).
- Unit economics are central to the pitch, with Slide 8 detailing how geographic cost arbitrage and backend tools drive down the cost of care.
- The platform reports a high provider quality score of 96% and a selective 10% clinical acceptance rate to ensure service standards (Slide 9).
- Retention is a key metric, with the company reporting 93% provider retention to date (Slide 9).
- The deck identifies a $10k average annual spend per neurodiverse student in the legacy system, setting a high ceiling for their LTV (Slide 4).
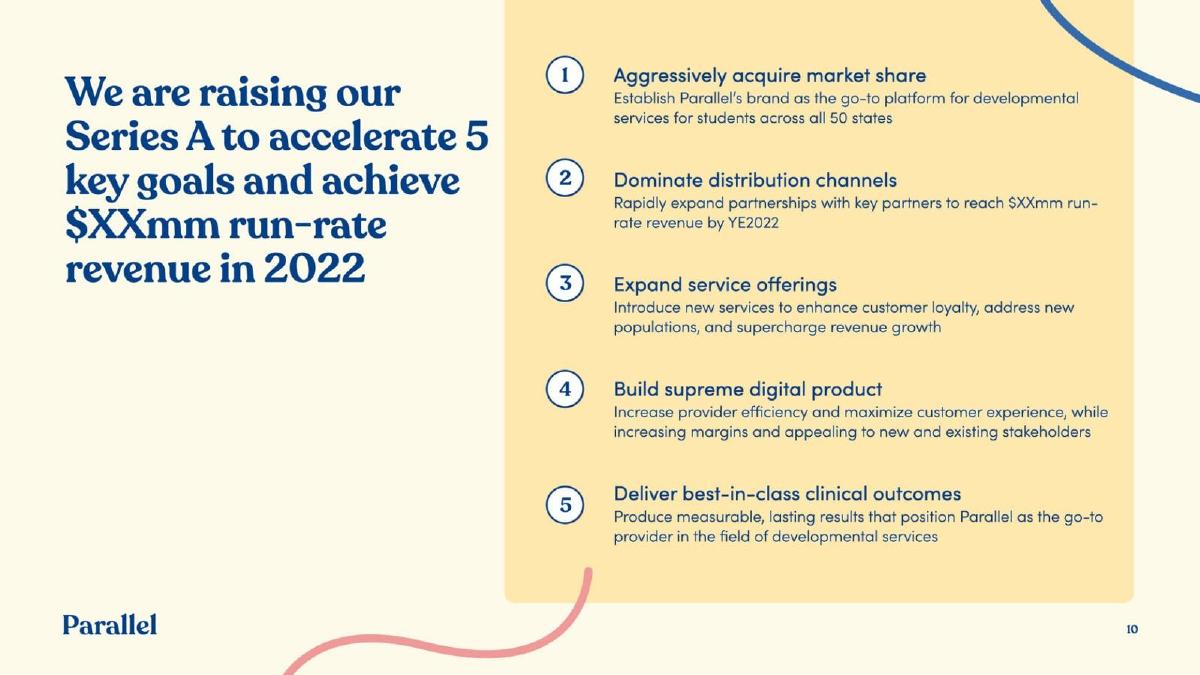
- The Series A 'Ask' is framed around five specific strategic goals, including reaching all 50 states and hitting a specific revenue run-rate by YE2022 (Slide 10).
The 10-Slide Series A Framework
Parallel Learning’s pitch deck is a lean, high-impact document that avoids the fluff often found in early-stage presentations. Raised in 2021, the $20M Series A round (as reported by Business Insider) came at a time when telehealth and remote education were seeing unprecedented adoption. The deck reflects this by focusing on scalability, unit economics, and clinical rigor. It is structured to move quickly from the macro problem to the micro-level financial efficiency of their specific solution.
Slide 1 & 2: Brand Identity and Traction Summary
The deck opens with a clean, friendly aesthetic using photography of children and young adults to humanize the healthcare aspect. Slide 2 serves as a 'Teaser' or 'Highlights' slide. It lists several key performance indicators (KPIs), though the specific dollar amounts for Annual Run-Rate Revenue and Monthly Revenue Growth are redacted as '$XX'. However, it explicitly states the company has served 200+ students and is active in 6 states. The inclusion of an LTV:CAC ratio (even if redacted in this version) indicates that the company was already tracking sophisticated unit economics at this stage. The slide defines the platform as offering 'live psycho-educational services' for children, teenagers, and young adults.
Slide 3: Market Opportunity and Payors
Slide 3 addresses the 'Why Now?' question. It cites 'Education, healthcare, & COVID tailwinds' as permanent shifts in how money is spent on the 15mm+ students with learning and thinking differences in the U.S. The market size is broken into two buckets: Pediatric Behavioral Health Services and Special Education Support Services, both noted as '$XXB' opportunities. Crucially, this slide identifies the four-pillar payor model: Cash Pay, K-12 Schools, Government, and Insurance. This diversification is a strong signal to investors that the company is not overly dependent on a single, potentially volatile revenue stream.
Slide 4: The Broken Status Quo
This is arguably the most important slide in the deck. It uses a timeline comparison to visualize the 'broken' existing system versus the Parallel solution. The 'Status Quo' is depicted as a jagged, unreliable path taking up to 6 months, where only 60% of students receive services. It also notes a $10k average annual spend per neurodiverse student, which serves as a benchmark for Parallel's potential revenue per user. In contrast, Parallel’s timeline is a straight line taking only 2 weeks from evaluation to tailored services. This 12x improvement in speed is a compelling hook for any Series A investor.
Slide 5 & 6: The Product and Care Delivery
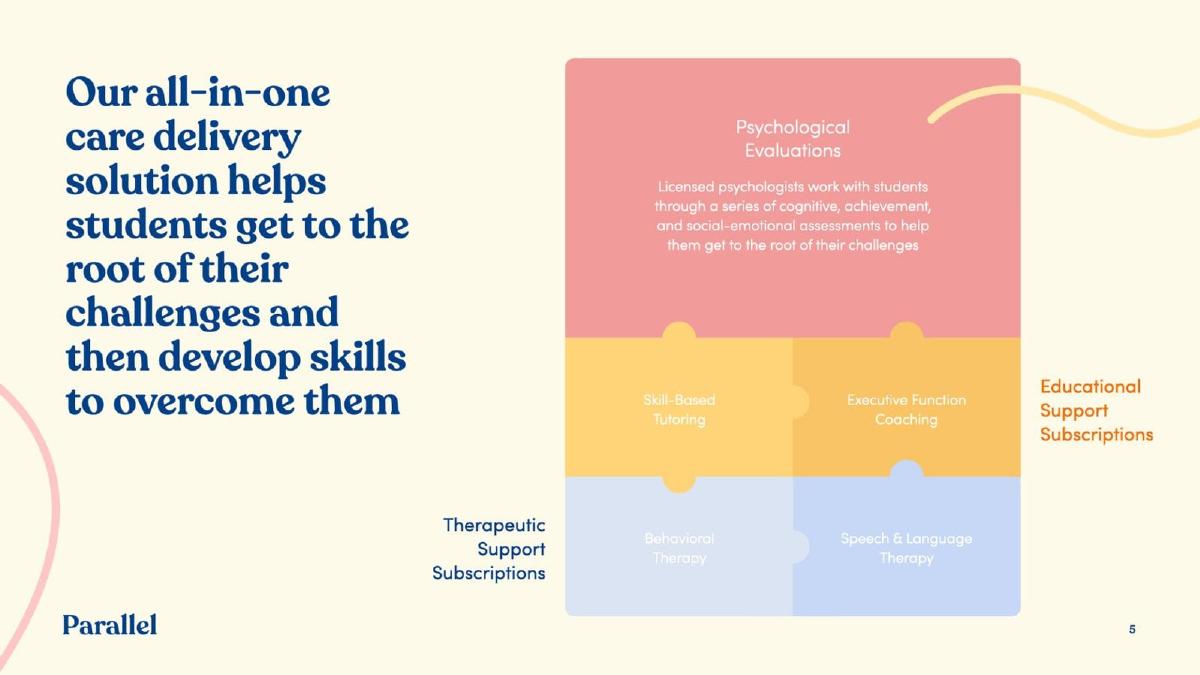
Slide 5 uses a puzzle-piece graphic to explain their 'all-in-one care delivery solution.' It categorizes services into Psychological Evaluations, Educational Support Subscriptions (Skill-Based Tutoring, Executive Function Coaching), and Therapeutic Support Subscriptions (Behavioral Therapy, Speech & Language Therapy). Slide 6 provides a product montage, showing the user interface, provider calendars, and diagnostic reports. This proves the 'Product' is not just a concept but a functional telehealth platform capable of handling complex clinical data and video sessions.
Slide 7 & 8: Deep Dive into Unit Economics
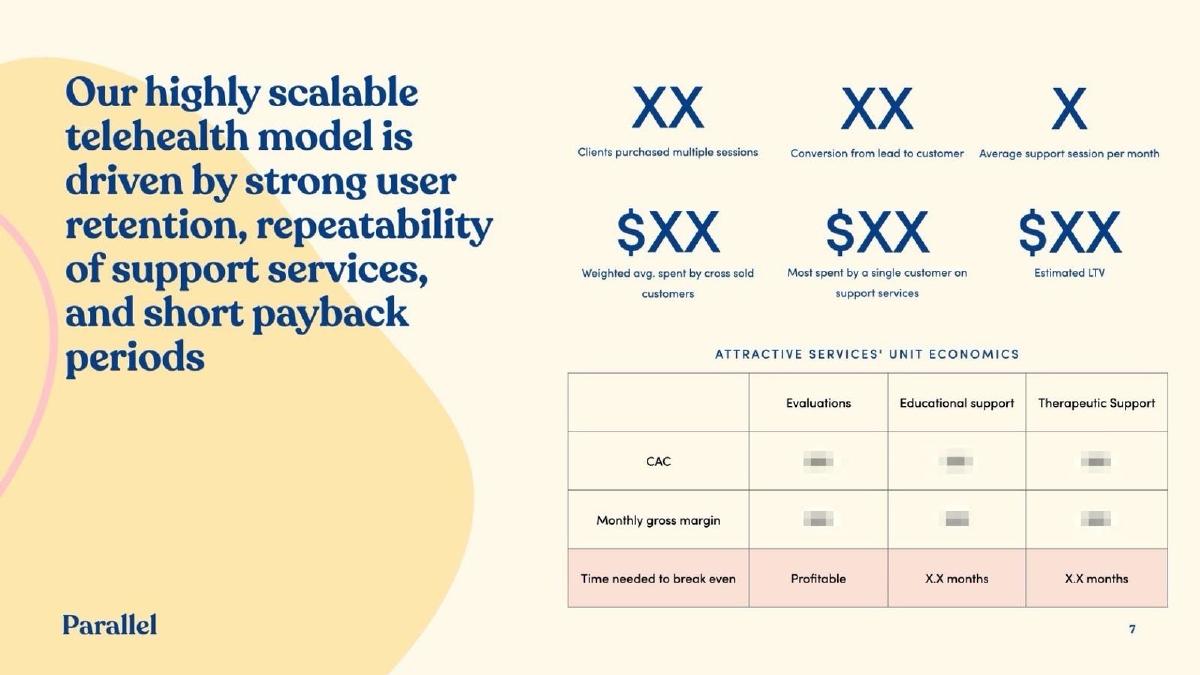
Slides 7 and 8 are heavily focused on the financial viability of the model. Slide 7 lists metrics such as 'Weighted avg. spent by cross sold customers' and 'Average support session per month.' It includes a table for 'Attractive Services Unit Economics' covering CAC, Monthly Gross Margin, and Time needed to break even. Slide 8 goes further into cost reduction, explaining how they use backend tools, geographic cost arbitrage, and collaborative staffing to drive down the cost of care. A bar chart compares 'Legacy Providers' to 'Parallel (Today)' and 'Parallel (Future),' showing a clear downward trend in the cost of providing psychological evaluations. This level of detail on margins is typical for a successful Series A deck, as it proves the business can scale profitably.
Slide 9: Clinical Credibility and Vetting
Instead of a standard 'Team Slide' featuring the CEO and COO, Parallel chooses to highlight its clinical leadership. This is a strategic move for a healthcare startup where credibility is paramount. The slide features Jordan Wright, Ph.D., and advisors from Stanford and UNC. It also shares impressive quality metrics: a 10% clinical acceptance rate (indicating high selectivity), 93% provider retention, and a 96% average provider quality score. This slide mitigates the risk of 'low-quality care' that often plagues rapidly scaling telehealth companies.
Slide 10: The Series A Ask and Future Goals
The final slide outlines the purpose of the raise. It sets a clear target to reach '$XXmm run-rate revenue in 2022.' The five key goals are specific: acquiring market share across all 50 states, dominating distribution channels through partnerships, expanding service offerings, building a 'supreme' digital product, and delivering clinical outcomes. By framing the ask around these five pillars, the founders give investors a clear roadmap of how their capital will be deployed to create value.
What Parallel Learning Does Well
The deck excels at quantifying the pain point . By citing the 6-month wait time and the $10k annual spend in the legacy system, they make the inefficiency of the current market undeniable. They also do an excellent job of diversifying their revenue narrative ; by showing four different payors, they demonstrate that they aren't just a D2C play or just a B2B school play, but a platform that can capture value from the entire ecosystem.
Furthermore, the focus on unit economics (Slides 7 and 8) is a masterclass for Series A founders. They don't just say they are 'efficient'; they show the table of margins and the specific levers (like geographic arbitrage) they use to achieve those margins. This transforms the pitch from a social mission into a high-growth financial opportunity.
What is Missing from the Deck
The most glaring omission is a traditional executive team slide . While the clinical advisors are impressive, there is no mention of the founders' backgrounds, their previous exits, or their operational expertise. Investors at the Series A level usually want to see who is steering the ship, not just who is advising on the medicine.
Additionally, there is no competitive landscape slide . While they contrast themselves against 'Legacy Providers,' they do not mention other emerging telehealth or EdTech competitors. In a crowded market, failing to acknowledge competition can sometimes be seen as a lack of market awareness, though in this case, the $20M outcome suggests their internal metrics were strong enough to overcome this.
Finally, the deck lacks a detailed case study or 'Patient Journey' . While Slide 4 shows a theoretical timeline, a real-world example of a student who went through the Parallel system and saw specific academic or behavioral improvements would have added an emotional layer to the clinical data.
Founder Takeaways: What to Copy
The Timeline Comparison: If your startup solves an efficiency problem, use a side-by-side timeline like Slide 4. It is the fastest way to communicate a 10x improvement. · Payor Diversification: Don't just list one customer type. If your product can be paid for by insurance, government, and private individuals, show all three to prove market resilience. · Margin Levers: Don't just state your gross margin. Explain how you are making it better (e.g., Slide 8's mention of backend tools and geographic arbitrage). · Clinical Vetting Metrics: If you are in a service-based industry, your 'acceptance rate' for providers is a proxy for quality. High selectivity (like their 10% rate) is a strong signal of a premium brand. · Goal-Oriented Ask: Instead of just saying 'We are raising $X for hiring,' use a numbered list of strategic milestones that the funding will unlock, as seen on Slide 10.
Frequently asked questions
- What is Parallel Learning's primary value proposition?
- Parallel Learning focuses on efficiency and access. According to Slide 4, the legacy system for neurodiverse students takes up to 6 months for evaluation and diagnosis, and only 60% of students who request services receive them. Parallel claims to compress this entire timeline into 2 weeks while providing tailored services that skip waitlists and high costs.
- How does Parallel Learning generate revenue?
- Slide 3 identifies four distinct payor groups: direct cash pay from families, K-12 schools, government entities, and insurance providers. Slide 5 further clarifies that they offer 'Educational Support Subscriptions' and 'Therapeutic Support Subscriptions,' suggesting a recurring revenue model alongside one-time psychological evaluations.
- How does the company manage its service costs?
- Slide 8 outlines three specific levers for decreasing the cost of care: backend tools for providers to increase efficiency, geographic cost arbitrage (hiring providers in lower-cost regions), and collaborative staffing models. They show a visual trajectory of reducing psychological evaluation costs from legacy levels to a lower 'Future' target.
- Who leads the clinical side of the business?
- Rather than a general executive slide, Slide 9 focuses on clinical credibility. It features Jordan Wright, Ph.D. (Head of Clinical) with ties to NYU, and Clinical Advisors Craig Pohlman, Ph.D., and Damon Korb, M.D., who bring credentials from institutions like Stanford University and the University of North Carolina.
- What were the stated goals for the Series A funding?
- As per Slide 10, the funding was intended to accelerate five goals: aggressive market share acquisition across all 50 states, dominating distribution channels to reach a specific revenue run-rate by YE2022, expanding service offerings, building a 'supreme' digital product, and delivering best-in-class clinical outcomes.