The Rows pitch deck is a masterclass in brevity and product-centric storytelling. Spanning just nine slides, it avoids the traditional bloat of team bios and financial projections to focus entirely on the 'why' and 'how' of their product. The narrative arc moves from the historical evolution of spreadsheets to a direct comparison with programming languages, ultimately landing on a vision of the spreadsheet as a DIY platform for business tools. By highlighting native integrations with REST APIs and the ability to publish sheets as web apps, Rows makes a compelling case for capturing a share of…
Key takeaways
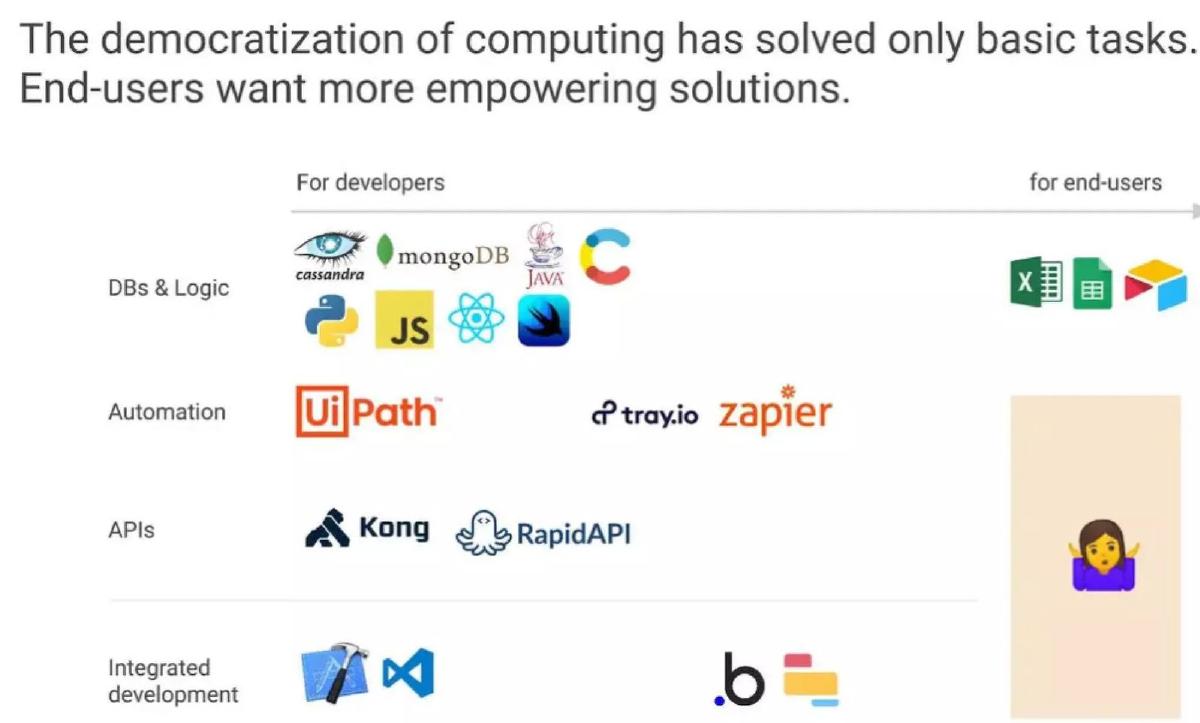
- The deck identifies a gap in the market where end-users lack the automation and API tools available to developers (Slide 2).
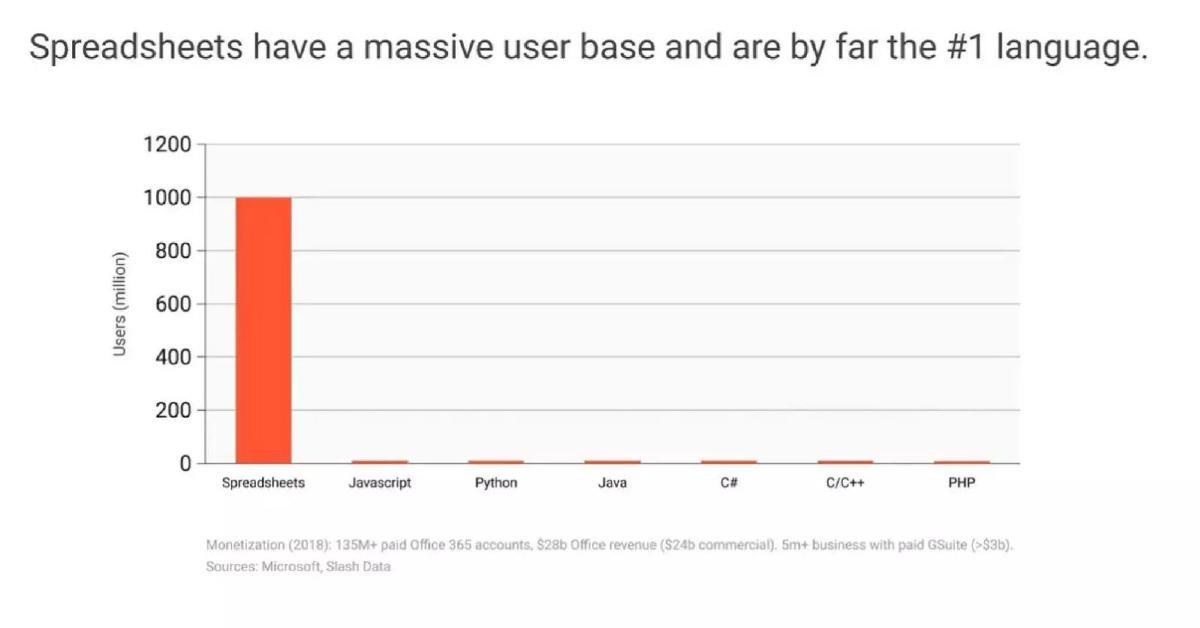
- Spreadsheets are framed as the world's #1 programming language with 1,000 million users, dwarfing Javascript and Python (Slide 4).
- The company cites 2018 monetization data showing $28 billion in Office revenue and over $3 billion for GSuite (Slide 4).
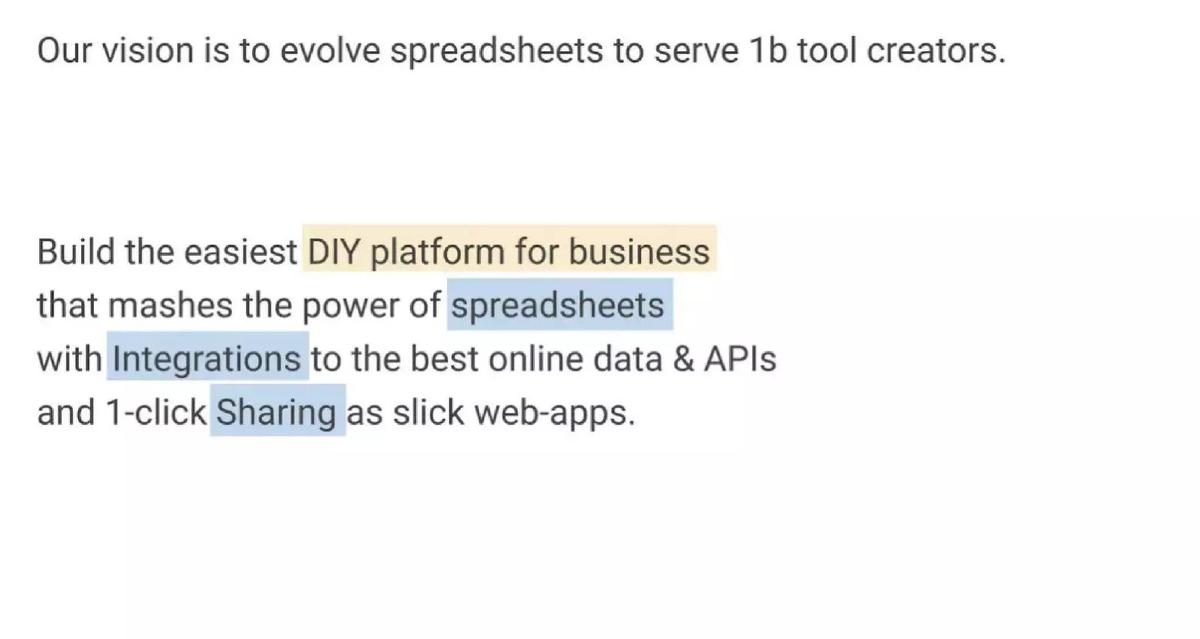
- The core product value proposition is defined as mashing spreadsheets with integrations and 1-click sharing (Slide 5).
- Product screenshots demonstrate native REST API functionality, such as the =GET_COMPANY_DETAIL function (Slide 7).
- The vision includes turning spreadsheets into functional web apps through a 'Live view' feature (Slide 8).
- The deck completely omits a team slide, financial history, and a specific capital request.
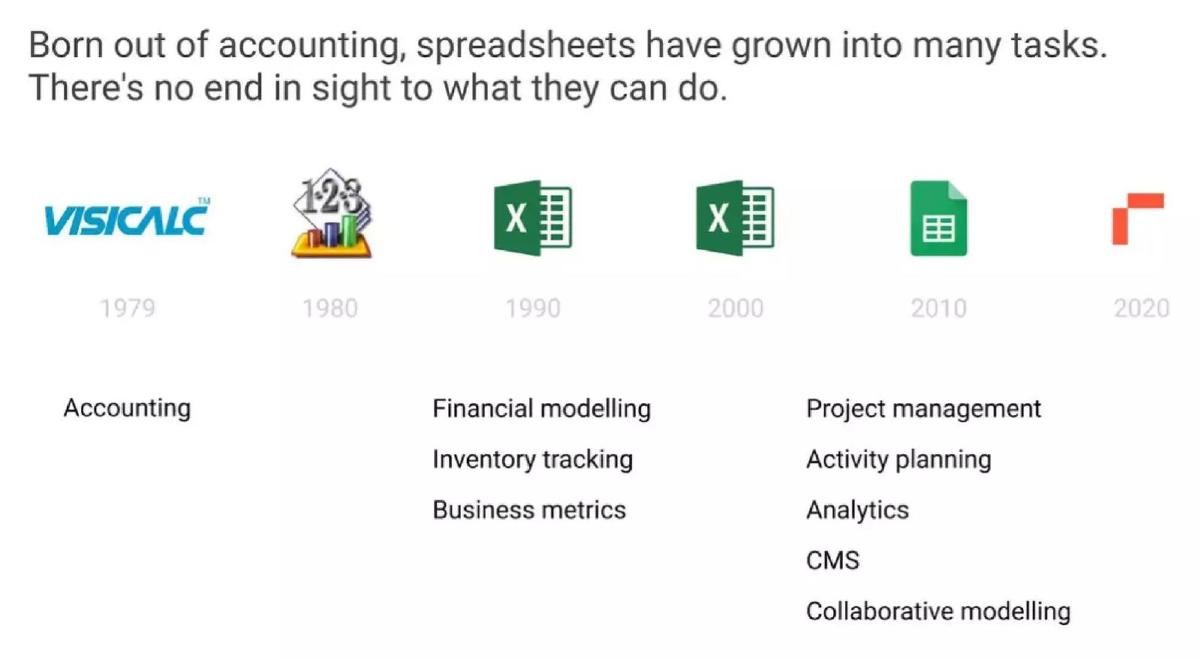
- Market validation is built on the historical trajectory of spreadsheets from VisiCalc in 1979 to the present (Slide 3).
The Product-First Manifesto: A Teardown of the Rows Deck
The Rows pitch deck is an anomaly in the world of venture capital presentations. At only nine slides, it ignores the standard Sequoia-style template in favor of a tight, product-led narrative. It does not lead with a team of ex-Google engineers or a chart showing 30% month-over-month growth. Instead, it leads with a philosophical argument about the democratization of computing. This teardown examines how Rows attempts to reframe one of the oldest software categories—the spreadsheet—as a modern development platform.
The Vision and the Gap (Slides 1-2)
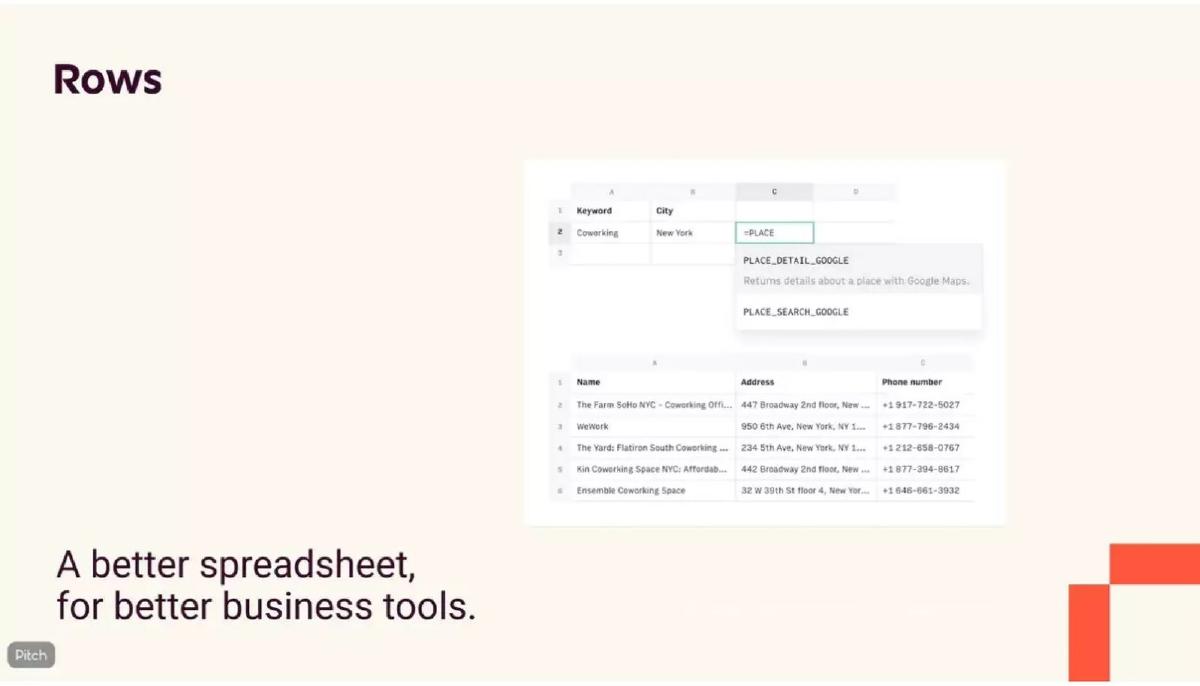
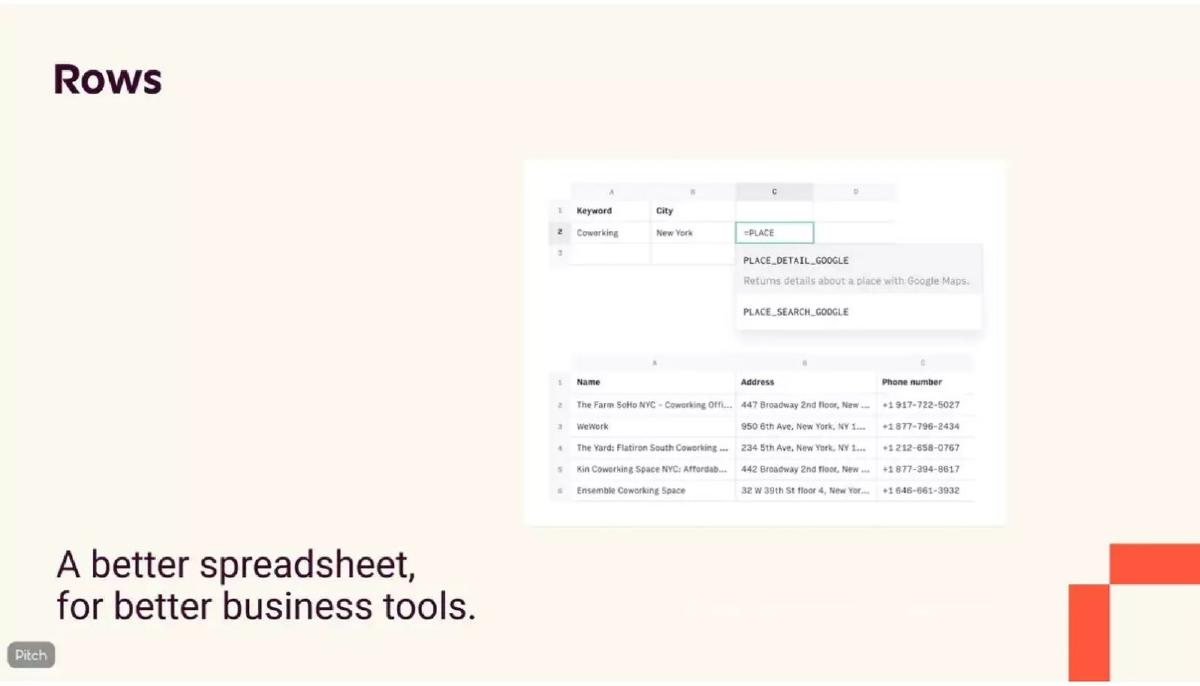
Slide 1: Title The deck opens with the company name 'Rows' and the tagline: 'A better spreadsheet, for better business tools.' The visual is a clean product crop showing a spreadsheet cell being populated with a Google Maps search function (=PLACESEARCHGOOGLE). This immediately signals that this is not just a grid for numbers, but a tool that interacts with the live web.
Slide 2: The Democratization Gap Slide 2 sets up the problem. It argues that while developers have seen an explosion in tools for databases, logic, automation, and APIs (listing logos like MongoDB, Zapier, and RapidAPI), end-users have been left behind. The slide uses a grid to show that for 'APIs' and 'Integrated development,' the end-user column is empty except for a shrugging emoji. This is a classic 'gap in the market' slide, positioning Rows as the bridge between developer-level power and end-user simplicity.
Contextualizing the Spreadsheet (Slides 3-4)
Slide 3: The Evolution of the Grid Rows provides a historical timeline of the spreadsheet, starting with VisiCalc in 1979, moving through Lotus 1-2-3 (1980), Excel (1990, 2000), and Google Sheets (2010). The final entry is the Rows logo at 2020. The slide lists how the use cases have expanded from simple accounting to project management, CMS, and collaborative modeling. The message is clear: the spreadsheet is a flexible medium that is overdue for its next structural evolution.
Slide 4: The #1 Language This is the 'Market Size' slide, but it is framed through the lens of user behavior rather than dollars. A bar chart shows 'Spreadsheets' with 1,000 million users, while programming languages like Javascript, Python, and Java appear as tiny blips at the bottom of the scale. Footnotes cite 2018 monetization metrics: 135M+ paid Office 365 accounts generating $28b in revenue, and 5m+ businesses paying for GSuite. By defining a spreadsheet as a 'language,' Rows expands its potential impact to every office worker on the planet.
Defining the Solution (Slides 5-7)
Slide 5: The Mission Statement Slide 5 acts as a transition, stating: 'Our vision is to evolve spreadsheets to serve 1b tool creators.' It defines the product as a 'DIY platform for business' that combines spreadsheets, integrations, and 1-click sharing. This slide is text-heavy but serves to anchor the technical demonstrations that follow.
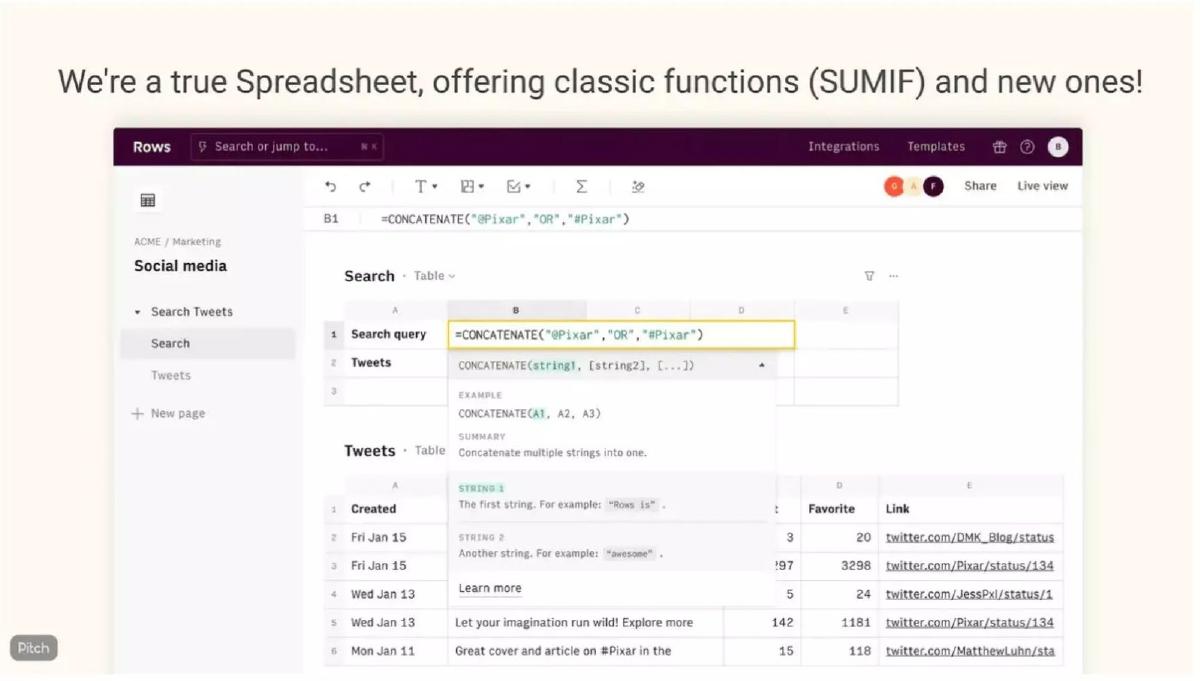
Slide 6: Familiarity Meets Innovation Rows addresses the 'switching cost' problem here. By stating 'We’re a true Spreadsheet, offering classic functions (SUMIF) and new ones!', they reassure the user that their existing skills are transferable. The screenshot shows a CONCATENATE function being used to build a Twitter search query, demonstrating how old logic can drive new data types.
Slide 7: Native Integrations This slide gets into the technical 'how.' It shows a spreadsheet enriching a list of domains (spotify.com, hubspot.com) with company data via a =GETCOMPANYDETAIL(A2) function. A side panel shows the raw JSON-style data being parsed into the grid. This is the core differentiator: Rows treats APIs as first-class citizens within the cell, removing the need for third-party connectors like Zapier for basic data enrichment.
Publishing and Scale (Slides 8-9)
Slide 8: From Grid to App Slide 8 introduces 'Live SHARING.' It shows a side-by-side comparison of the spreadsheet editor and a clean, button-driven web app. The headline claims this allows users to 'instantly turn spreadsheets into web apps.' This is a significant pivot from the 'spreadsheet as a document' to the 'spreadsheet as a software back-end,' allowing users to build internal tools for operations like 'Pickup orders' without writing code.
Slide 9: The Ecosystem The final slide focuses on templates. It shows a library of pre-built tools for Google Analytics, Twitter monitoring, and HubSpot lead generation. This slide suggests a 'land and expand' strategy where users come for a specific utility (e.g., 'Find LinkedIn profiles and emails') and stay for the platform. It also hints at a 'Rows Academy' with beginner, intermediate, and advanced courses, implying a commitment to user education and community building.
What Works in the Rows Pitch Deck
The most effective element of this deck is its category reframing . By calling the spreadsheet the 'world's #1 language,' Rows moves the conversation away from 'we are a slightly better Google Sheets' to 'we are a development platform for the masses.' This is a much more venture-scale argument.
The visual evidence is also strong. Instead of listing features, the deck uses high-fidelity screenshots that show exactly how the product looks and feels. The inclusion of specific function names like =GETCOMPANYDETAIL makes the value proposition tangible. A founder can see exactly how they would use this to save time, which is the ultimate goal of a SaaS product demo.
Finally, the historical context on Slide 3 is a clever way to build inevitability. By showing that the spreadsheet has reinvented itself every decade for forty years, the deck makes the case that a 2020 reinvention is not just possible, but expected.
What is Missing from the Rows Pitch Deck
While the product vision is crystal clear, the business case is almost entirely absent . A professional investor would immediately notice the following omissions:
Team: There is no information on who is building this. In a competitive space like productivity software, the pedigree of the engineering and product team is often a deciding factor for investors. · Traction: The deck contains zero internal metrics. We don't know if they have 10 users or 10,000. There is no mention of retention, engagement, or growth rates. · Business Model: While Slide 4 mentions Microsoft's revenue, it doesn't explain how Rows intends to charge. Is it a per-seat SaaS model, a usage-based API model, or a freemium play? · Competition: The deck mentions Excel and Google Sheets as predecessors, but it ignores modern competitors like Airtable, Coda, or Smartsheet, all of which are vying for the 'spreadsheet-as-an-app' market. · The Ask: There is no closing slide stating how much capital the company is seeking or what milestones that capital will help them achieve.
What a Founder Should Copy from this Deck
Founders should emulate the narrative density of this deck. Every slide serves a specific purpose in building a logical argument. There is no 'fluff' or filler content. If you are building a product in a well-established category, the strategy of showing a 'gap' in the current market (as seen on Slide 2) is a highly effective way to justify your existence.
The focus on 'Tool Creators' is another lesson in positioning. Instead of trying to be everything to everyone, Rows identifies a specific persona—the person who builds the tools for their team. By focusing on the 'creator' rather than the 'viewer,' they identify the high-leverage user who will drive adoption within an organization.
Lastly, the clean aesthetic and consistent branding make the company appear mature and professional. The use of a muted color palette and high-quality UI crops suggests a level of product polish that is often missing from early-stage decks. For a SaaS company, the deck is the first 'product' an investor sees; Rows ensures that the experience is seamless.
Final Analysis
The Rows deck is a 'Product Manifesto.' It is designed to get an investor excited about a vision of the future where the grid is the interface for the entire internet. It succeeds in making the spreadsheet feel exciting and modern. However, as a standalone fundraising tool, it is incomplete. It requires a significant amount of verbal supplementation regarding the team, the financials, and the go-to-market strategy. It is a deck built for a founder who already has the investor's ear and needs to prove that the product vision is big enough to return a fund.
Frequently asked questions
- What is the primary problem Rows is trying to solve?
- Rows addresses the 'empowerment gap' between developers and end-users. While developers have access to robust DBs, automation, and APIs, end-users are often stuck with basic spreadsheet functions. Slide 2 explicitly shows a 'shrug' emoji for end-users in the API and automation categories, suggesting that current tools like Excel and Google Sheets do not sufficiently democratize these advanced computing capabilities for non-technical business users.
- How does Rows justify the market size for a new spreadsheet tool?
- Instead of using traditional TAM/SAM/SOM slides, Rows uses a bar chart on Slide 4 comparing spreadsheet users to programmers. By claiming 1,000 million (1 billion) spreadsheet users compared to negligible numbers for languages like Python or C#, they position their market as the largest possible audience in computing. They also cite $28 billion in Microsoft Office revenue to prove the willingness to pay within this category.
- What are the key technical differentiators mentioned in the deck?
- The deck highlights three main technical pillars: native integrations with REST APIs (Slide 7), the ability to use classic functions like SUMIF alongside new API-driven functions (Slide 6), and '1-click Sharing' that transforms a grid into a clean, user-facing web app (Slide 8). This moves the spreadsheet from a static data repository to a functional back-end for custom business applications.
- What critical information is missing from this pitch deck?
- This is a 'vision' deck that lacks almost all standard investor due diligence materials. There is no slide introducing the founders or their expertise. There is no mention of current traction (users, revenue, or growth rates). Most importantly, there is no 'Ask' slide detailing how much money is being raised, the valuation, or the intended use of funds. It functions more as a product manifesto than a fundraising document.
- Who is the target user for Rows according to these slides?
- The deck targets 'tool creators'—business users who need to automate tasks like lead generation, social media monitoring, and Salesforce management but don't know how to code. Slide 9 showcases templates for LinkedIn profiling, Google Analytics dashboards, and HubSpot automation, indicating a focus on sales, marketing, and operations professionals who currently rely on manual spreadsheet work.