Rowan Companies' March 2018 investor presentation serves as a masterclass in defensive positioning during a sector-wide downturn. By emphasizing their 100% 7th-generation ultra-deepwater fleet and a unique 50/50 joint venture with Saudi Aramco (ARO Drilling), Rowan successfully differentiated itself from competitors burdened by older assets. The deck provides granular detail on capital allocation, showing a cash balance of $1.3 billion and a commitment to debt reduction. While the outlook for 2018 remained cautious, the presentation uses utilization data and technical achievements—such as dri…
Key takeaways
- Rowan maintains a 100% 7th-generation ultra-deepwater fleet, a significant differentiator compared to competitors like SDRL (20%) and RIG (12%) as shown on slide 13.
- The company holds a strong liquidity position with approximately $1.3 billion in cash and has retired ~$780 million in debt since late 2015 (slide 17).
- A strategic 50/50 joint venture with Saudi Aramco, named ARO Drilling, provides a stable growth engine and visible cash flow (slide 33).
- Technical capabilities are a core pillar, with the company ranking #1 for HPHT applications in seven of the last eight EnergyPoint Research surveys (slide 9).
- Market recovery is projected to be slow, with material pricing improvements not expected until marketed utilization returns to ~85% (slide 21).
- Global UDW utilization stood at 74% as of March 2018, with significant regional variance ranging from 25% in the Far East to 100% in the Mediterranean (slide 25).
- The ARO Drilling partnership resulted in an $88 million cash distribution to Rowan in 4Q 2017 (slide 33).
- Rowan's fleet is capable of operating in extreme environments, including temperatures up to 450 degrees Fahrenheit and pressures exceeding 20,000 psi (slide 9).
Executive Summary: The High-Spec Defensive Play
The March 26, 2018, investor presentation for Rowan Companies (RDC) arrived at a pivotal moment for the offshore drilling industry. Following years of depressed oil prices, the sector was grappling with oversupply and low dayrates. Rowan’s deck is a strategic document designed to convince institutional investors that the company is not just a survivor, but a premium operator positioned for the eventual upcycle. The narrative centers on three pillars: technical superiority, a fortress balance sheet, and a transformative partnership with Saudi Aramco.
Slide 1: Title and Brand Identity
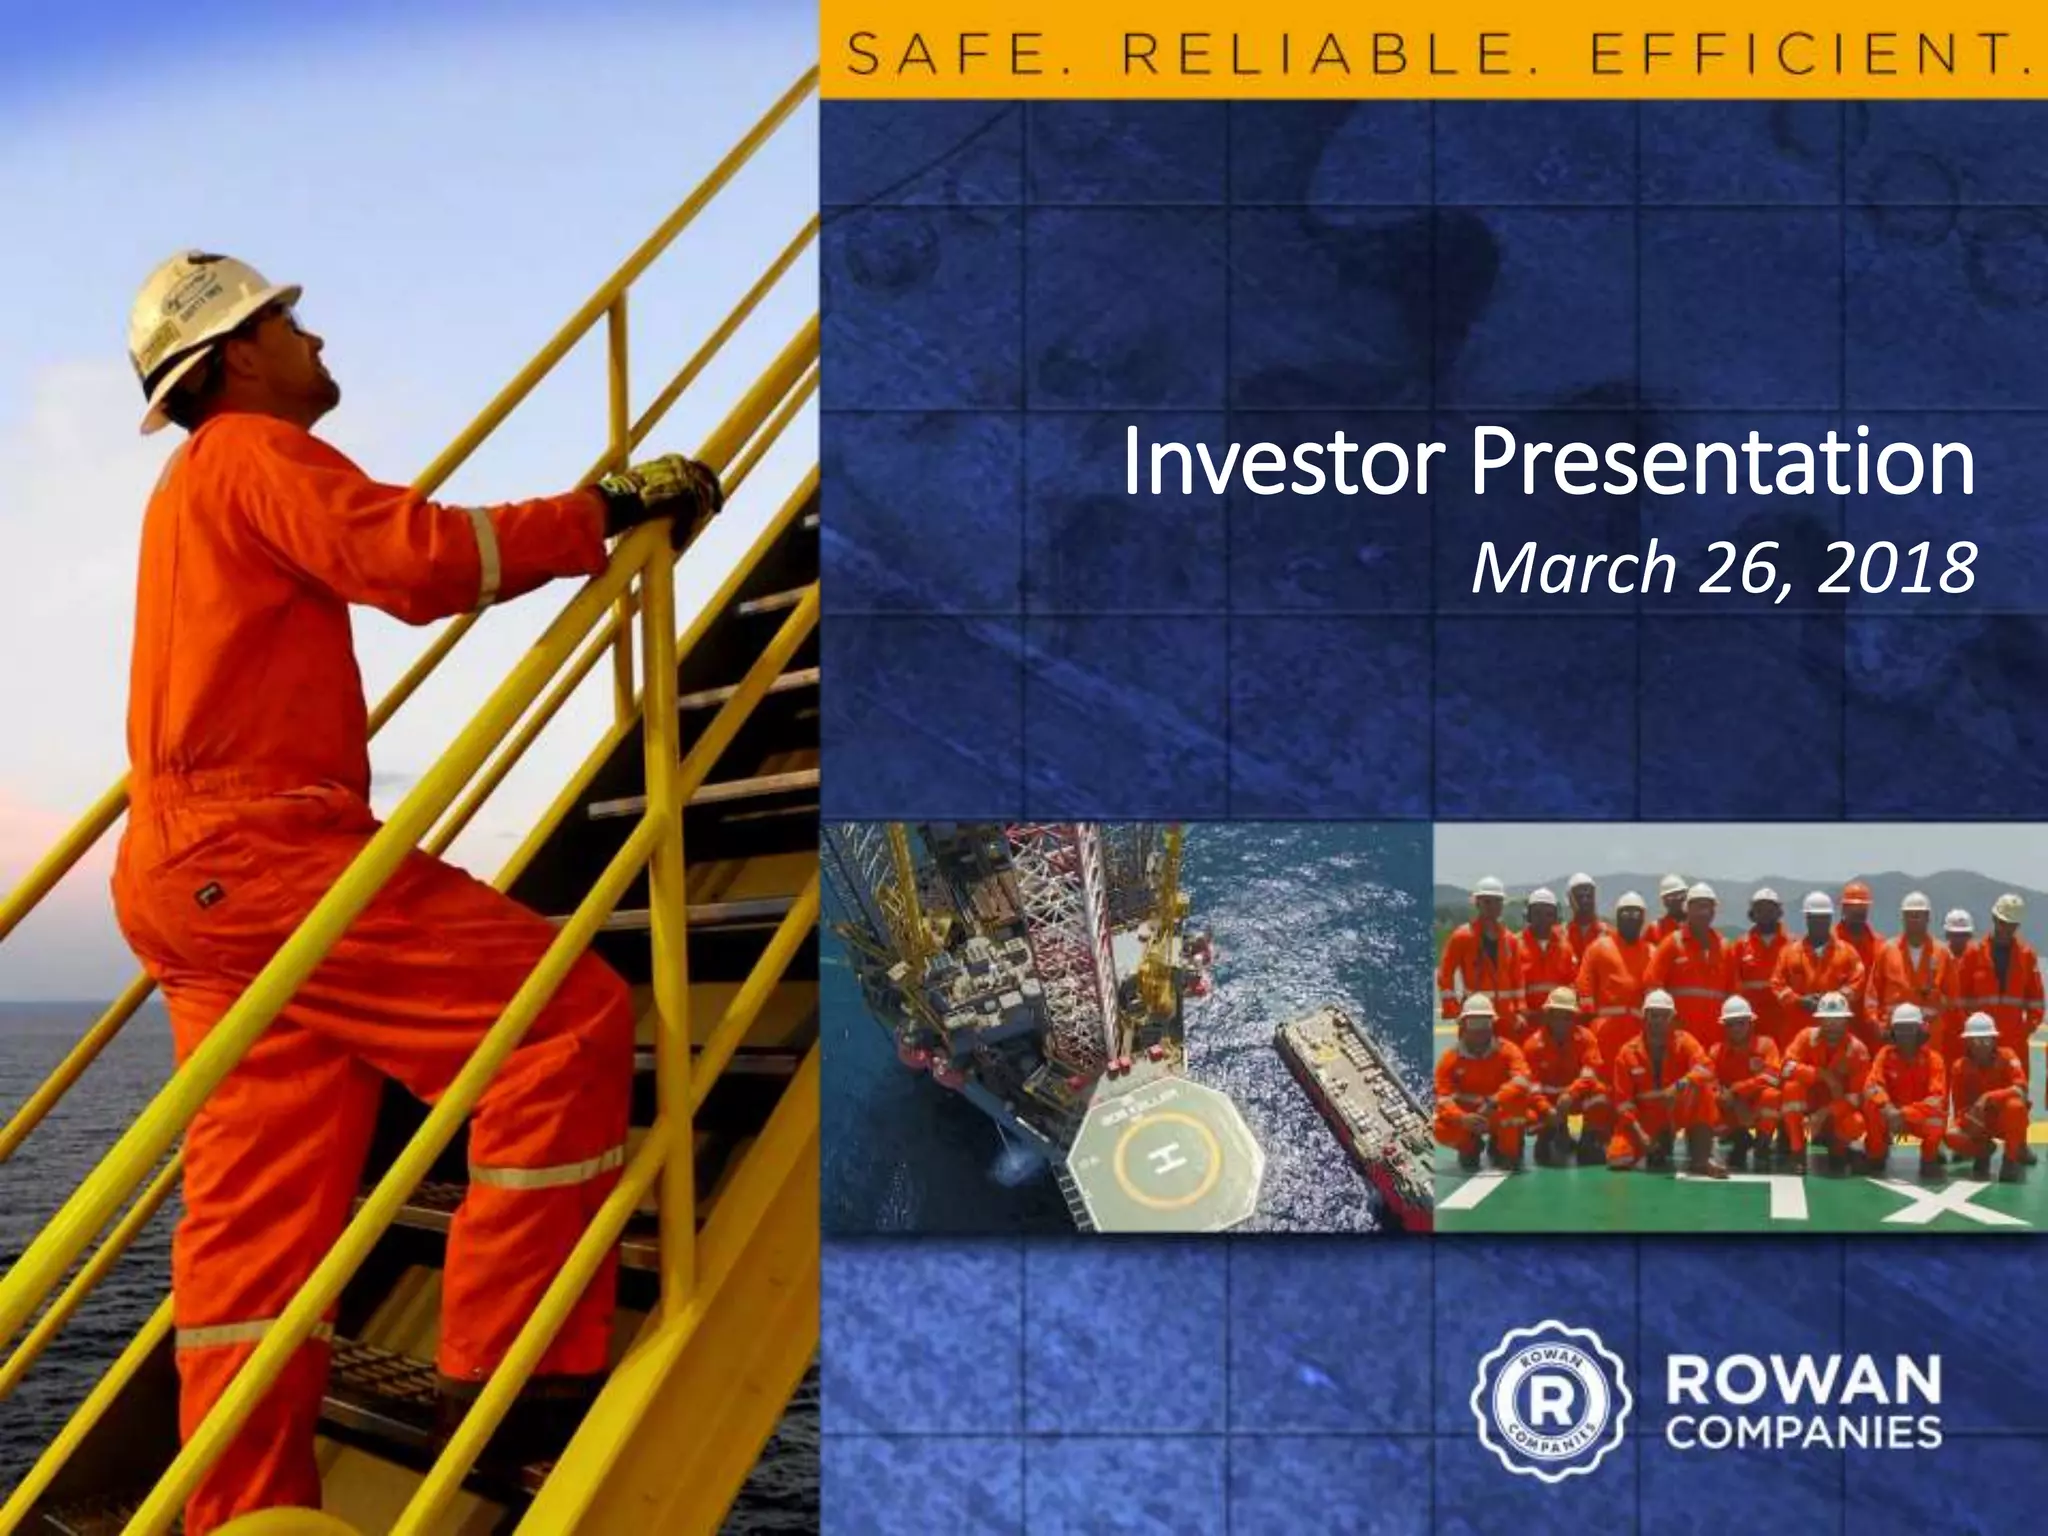
The cover slide establishes the company's core value proposition: "Safe. Reliable. Efficient." The imagery features offshore personnel and a helideck, grounding the presentation in the physical reality of high-stakes industrial operations. The date, March 26, 2018, places this deck in the context of a slowly recovering energy market.
Slide 2: Visible Growth Through ARO Drilling
This transition slide uses a high-angle shot of the "Bob Keller" jack-up rig alongside a supply vessel. The headline "Visible Growth Through ARO Drilling" immediately introduces the company's most significant strategic move—the joint venture with Saudi Aramco. It signals to investors that despite market headwinds, Rowan has a clear path to revenue through a captive partnership.
Slide 9: Technical Specialization and Global Footprint
Rowan positions itself as a specialist in "demanding drilling services." The slide features a global map dotted with logos of major oil companies (Total, ConocoPhillips, BP, Shell, Saudi Aramco, Petronas) to demonstrate a blue-chip customer base. A key highlight on this slide is Rowan's #1 ranking for HPHT (High Pressure High Temperature) applications in seven of the last eight EnergyPoint Research surveys. Below the map, five icons quantify their technical limits: drilling depths beyond 30,000 feet, temperatures up to 450°F, hook loads over 2,000,000 lbs, jack-up water depths exceeding 400 feet, and pressures over 20,000 psi.
Slide 13: Fleet Quality Benchmarking
This is arguably the most important slide for a competitive analysis. It compares the percentage of "7th generation rigs" in the ultra-deepwater fleets of major drillers. Rowan (labeled RDC) is highlighted in a dashed box showing 100% of its 4-floater fleet meets this standard. In contrast, SDRL is at 20%, RIG at 12%, ESV at 23%, NE at 31%, and DO at 17%. By focusing on the quality rather than the quantity of rigs, Rowan argues that its assets are less likely to be sidelined or scrapped during a downturn.
Slide 17: Capital Allocation and Liquidity
Rowan addresses the "challenging business environment" by detailing its financial discipline. The slide notes a cash balance of approximately $1.3 billion. It also highlights debt management: ~$780 million of debt retired since 4Q 2015, offset by a $500 million issuance of unsecured debt due in 2025. A flowchart shows the "Available Capital Allocation Options," prioritizing liquidity preservation and debt reduction over dividends or share repurchases, which are listed as the final, least prioritized option.
Slide 21: Market Outlook and Fundamentals
This slide provides a realistic, non-hyped view of the industry. For 2018, it notes "gradual improvement" and rising jack-up demand, but warns that floater demand will lag. For "2019+," the company states that dayrate improvements are not expected until marketed utilization returns to ~85%. It also explicitly mentions that "attrition is needed to improve the supply / demand balance," acknowledging that the industry must scrap older rigs to regain pricing power.
Slide 25: Worldwide Marketed UDW Utilization
A data-heavy map shows the utilization rates of Ultra-Deepwater (UDW) units globally. The total marketed supply is 127 units with an average utilization of 74%. The map highlights regional disparities: the Mediterranean and Australia/NZ are at 100%, while the Far East is at a dismal 25%. This slide serves to justify Rowan's geographic deployment strategy and provides context for their revenue expectations.
Slide 29: ARO Drilling Appendix Introduction
This slide marks the beginning of a deep dive into the Saudi Aramco joint venture. It lists the timeline of disclosures, from the initial announcement in November 2016 to the launch in October 2017. This serves as a reference point for investors to track the company's execution against its stated goals.
Slide 33: ARO Drilling Cash Flow Mechanics
This slide uses a detailed flowchart to explain the 2017 contributions and cash flow between Rowan, ARO Drilling, and Saudi Aramco. It notes that in 2Q 2017, both partners contributed $25 million in cash. In 4Q 2017, Rowan transferred three jack-ups while Aramco transferred two. The most significant figure here is the "$88MM received 4Q2017" by Rowan as a cash distribution from excess cash. This proves the JV is already yielding tangible financial returns.
Slide 37: Leased Rigs Financial Impact
The final slide in this set explains the economics of rigs leased to the ARO JV. It clarifies that Rowan receives a percentage of rig EBITDA as "bareboat charter revenue." It also delineates responsibilities: Rowan pays for five-year special surveys, while ARO pays for maintenance CAPEX. This level of granular detail is intended to help analysts model the company's future earnings from the JV more accurately.
What Rowan Companies Does Well
The deck excels at differentiation through asset quality . By using slide 13 to show a 100% 7th-generation fleet, they turn their smaller size into a competitive advantage. They aren't just another driller; they are the high-tech specialist. Furthermore, the transparency regarding the ARO Drilling JV is exceptional. Joint ventures are often "black boxes" in investor decks, but Rowan provides the specific dollar amounts ($88M distribution) and the exact mechanism for how money flows between the entities. Finally, the honesty regarding market recovery (slide 21) builds credibility. They don't promise a recovery next month; they tie it to a specific metric (85% utilization), which allows investors to track the industry and know when Rowan's thesis will play out.
What is Missing from the Deck
While the deck is comprehensive for an institutional audience, it lacks a detailed ESG (Environmental, Social, and Governance) section . In 2018, this was becoming a major requirement for institutional capital, yet the deck focuses almost exclusively on mechanical efficiency and financial returns. Additionally, there is no specific slide on the management team's track record . While Rowan is an established public company, a slide highlighting the leadership's experience in navigating previous cycles would have reinforced the "Safe and Reliable" theme. Lastly, the deck omits a clear 'Ask' or 'Use of Proceeds' because it is a general investor update rather than a specific fundraising pitch, though it functions as a tool to support the stock price and credit rating.
What a Founder Should Copy
Founders in capital-intensive or technical industries should emulate Rowan's benchmarking strategy . Slide 13 is a perfect example of how to use a single chart to make competitors look obsolete without mentioning them by name. If your startup has a 100% success rate or a 100% modern tech stack while incumbents are at 20%, that is your "hero chart." Additionally, the use of flowcharts for complex business models (slide 33 and 37) is a best practice. If your revenue comes from multiple streams or partnerships, don't just describe it in text—map the money. Finally, linking your success to macro milestones (like the 85% utilization target on slide 21) gives your investors a way to measure your progress against the broader market, which builds long-term trust.
Frequently asked questions
- What is the significance of the ARO Drilling joint venture?
- ARO Drilling is a 50/50 joint venture between Rowan and Saudi Aramco. As detailed on slide 33, it allows Rowan to localize its operations in Saudi Arabia, one of the world's most stable drilling markets. The JV involves contributing jack-up rigs and cash, resulting in shared excess cash distributions ($88 million in 4Q 2017) and a long-term contract pipeline that provides visibility through market cycles.
- How does Rowan's fleet compare to its industry peers?
- Rowan distinguishes itself by having a fleet comprised entirely of 7th-generation ultra-deepwater rigs. Slide 13 shows that while Rowan (RDC) is at 100%, major competitors like Transocean (RIG) and Seadrill (SDRL) have much lower percentages of these advanced rigs (12% and 20% respectively). This high-spec focus is intended to ensure higher utilization as customers prioritize the most efficient technology.
- What is Rowan's current financial health and capital allocation strategy?
- According to slide 17, Rowan is focused on 'preserving liquidity' and 'debt reduction.' The company reported a cash balance of $1.3 billion and successfully retired $780 million in debt since 2015. Their strategy favors opportunistic investments only if they are strategic and non-dilutive to fleet quality, while maintaining an attractive credit profile.
- What are the technical limits of Rowan's drilling equipment?
- Slide 9 outlines 'Demanding Drilling Achievements,' which include drilling depths beyond 30,000 feet, handling temperatures up to 450°F, hook loads exceeding 2,000,000 lbs, and pressures greater than 20,000 psi. These metrics are used to justify their #1 ranking in High Pressure High Temperature (HPHT) applications.
- When does Rowan expect the offshore market to recover?
- Slide 21 provides a cautious outlook. While 2018 showed gradual improvement in oil price stability and jack-up demand, Rowan noted that floater demand would likely bottom in late 2018. Material pricing improvements (dayrates) were not anticipated until 2019 or later, contingent on marketed utilization reaching approximately 85%.