Shopify's 29-slide January 2016 deck is an investor-relations presentation from an already-public company, not a fundraising pitch — slide 2 is a Safe Harbour legal disclaimer and there is no ask, no team slide, no competition slide and no problem slide anywhere in it. What makes it worth reading is its evidence discipline: the $46B global TAM is built from 46M merchants times roughly $1,000 of annualised revenue per merchant, sourced to AMI Partners and dated to the quarter ended 31 March 2015; MRR is defined by formula on the same slide it appears; the 2015 revenue figure is labelled as the…
Key takeaways
- Shopify's January 2016 deck is an investor-relations deck published after the May 2015 IPO, not a fundraising deck — slide 2 is a forward-looking-statements Safe Harbour page.
- The deck contains no ask, no team slide, no competition slide, no problem slide and no unit economics, which is normal for IR and disqualifying for a private round.
- Slide 10 builds the market bottom-up: roughly 10M merchants and a $10B TAM in core geographies inside 46M merchants and a $46B global TAM, sourced to AMI Partners, with merchants defined as retailers under 500 employees and revenue per merchant of about $1,000 based on the three months ended 31 Mar…
- Slide 12 dates one merchant's arc — DODOcase enters Build-a-Business in April 2010, hits 10,000 orders in 90 days, passes $3M in first-year sales, opens retail, adds channels and upgrades to Shopify Plus in 2014 — which proves expansion revenue without a cohort chart.
- Slide 21 prints the full MRR definition on the slide alongside $9.8M MRR at an 85% CAGR from 2012, removing an entire class of diligence question.
- Slide 20 labels the $195.0M 2015 revenue figure as the midpoint of management's forecast range as of 4 November 2015, so a projection is never presented as a result.
- Slide 24 shows sales and marketing, R&D and G&A as a percentage of revenue across four periods, which demonstrates operating leverage in a way absolute cost bars cannot.
- Slide 8 answers the low-end disruption objection unprompted — 'leaves little room for disruption from below' — rather than waiting for an investor to raise it.
What this deck actually is
Twenty-nine slides, published in January 2016 as Shopify Investor Deck January 2016 . This is the single most important thing to understand before you copy anything from it: this is not a fundraising deck . Shopify went public on the NYSE and TSX in May 2015. By the time this file was posted it was an investor-relations deck — the standing presentation a listed company gives to public-market analysts and institutional shareholders. Slide 2 is a Safe Harbour legal disclaimer, which is the tell. No seed or Series A deck on earth opens with forward-looking-statements language.
That distinction matters because the deck breaks almost every rule of a good venture pitch and is still excellent. There is no problem slide. There is no ask. There is no team slide, no competition slide, no use of funds, no valuation, no roadmap. Nobody is being asked to wire money into a risk. The audience already owns the stock, or is deciding whether to buy it on the open market at a quoted price, and can read the filings. What the deck has to do instead is answer one question: does this business compound, and why won't it stop?
So read it the way it was built. Slides 1–17 are the story — what Shopify is, who it sells to, why the market is bigger than it looks, and why the ecosystem is hard to copy. Slide 18 is a divider that says THE NUMBERS. Slides 19–24 are the financials. Slide 25 is growth vectors, slide 26 is the summary of the investment case, and slides 28–29 are an appendix with a GAAP reconciliation table.
Founders raising a seed round should not copy this structure. They should copy three specific things it does better than most private decks: it defines its market from the bottom up with a named source, it proves its moat with a customer story rather than an adjective, and it shows operating leverage as a percentage-of-revenue chart instead of claiming it in a bullet.
Slide-by-slide walkthrough
Slide 1 — Cover
The Shopify shopping-bag wordmark on a plain field. Nothing else — no date, no round, no descriptor.
A private company cannot get away with this. Shopify can, because the file travels with a title and a date attached to it in the IR channel it was published through, and because everyone in the room already knows what Shopify is. If your logo is not yet a sentence, your cover has to carry the sentence.
Slide 2 — Safe Harbour
A full page of dense forward-looking-statements language about management's estimates, beliefs and assumptions.
Legally required for a public issuer, and completely dead weight for a startup. Its only useful signal for a founder is diagnostic: if you see this slide, you are reading a public-company deck, and you should discount every structural lesson you take from it accordingly.
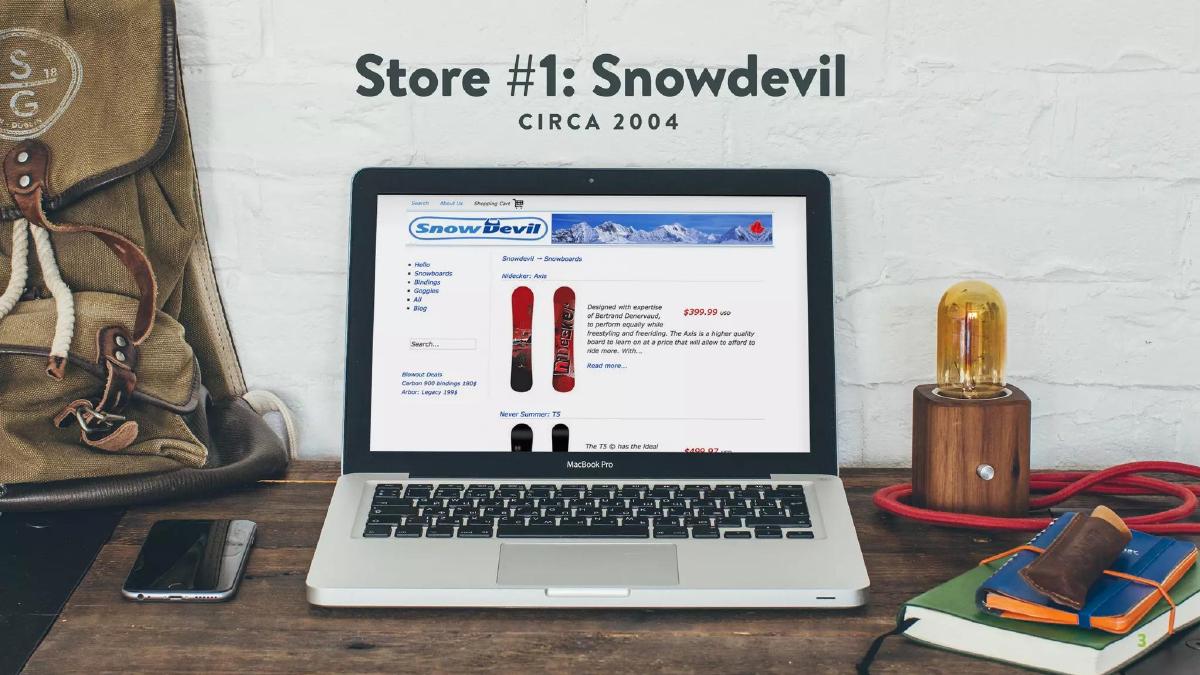
Slide 3 — Store #1: Snowdevil, circa 2004
A screenshot of the original Snowdevil snowboard store — product listings for Nidecker Axis and Never Summer T5 boards, a blog, a search box, a cart — rendered on a period MacBook Pro.
This is the origin story compressed into one image, and it is the best-constructed slide in the deck. Shopify exists because its founders tried to sell snowboards online in 2004, found the available software unusable, and built their own. The slide does not narrate that. It shows you store number one and lets you work it out.
The strategic function is credibility of insight: it establishes that the company's understanding of small merchants is not researched, it is lived. That is the one piece of this deck that a pre-seed founder can steal verbatim. If your product came out of a problem you personally had, show the artifact — the spreadsheet, the first ugly version, the workaround you were using before — rather than asserting "we deeply understand this customer."
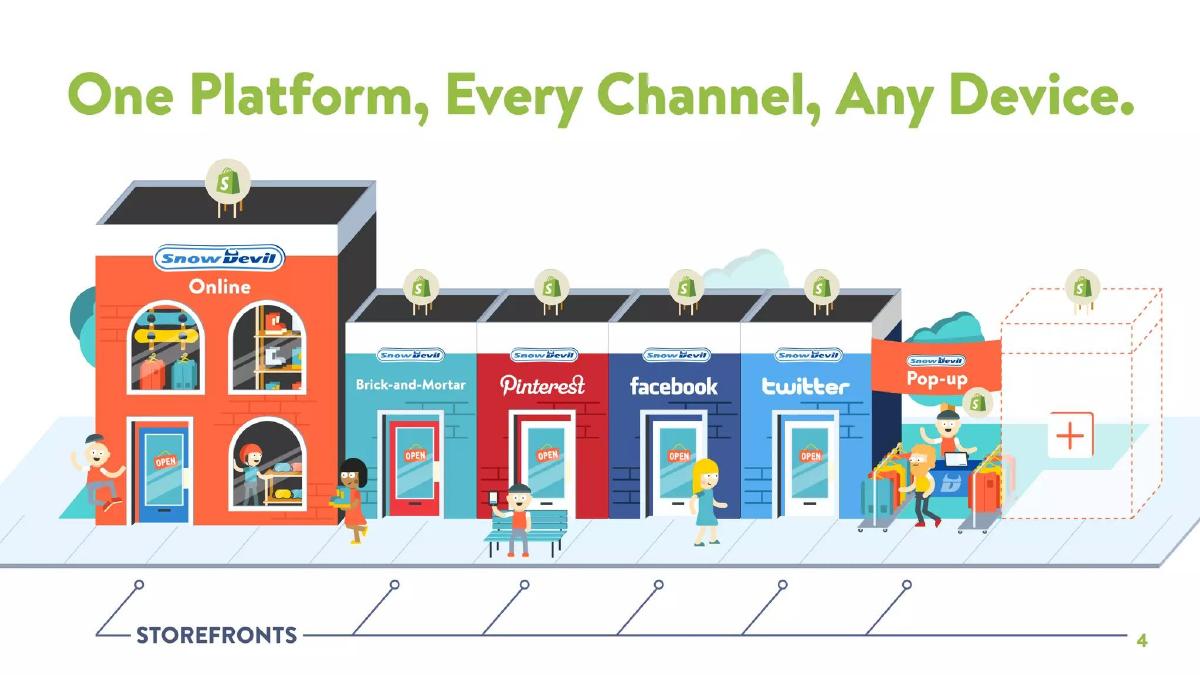
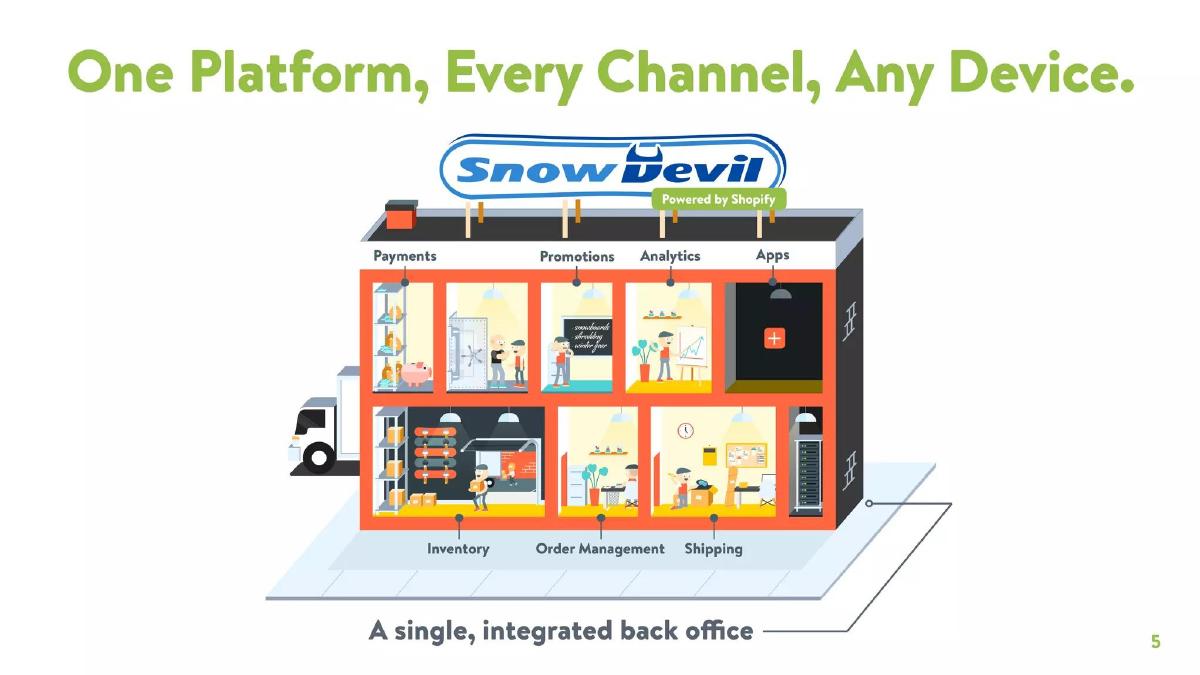
Slides 4 and 5 — One Platform, Every Channel, Any Device
Slide 4 puts the Snowdevil brand at the centre with online, mobile and in-person surfaces radiating from it. Slide 5 repeats the layout and drops in Powered by Shopify — a single, integrated back office .
A two-beat build: establish the fragmentation the merchant is living with, then reveal the single spine underneath it. Splitting one idea across two slides is a technique that reads as confident in a live presentation and wasteful in an emailed PDF — worth knowing which one you are making before you copy it.
The positioning line itself is the strongest sentence in the deck. "One platform, every channel, any device" is a claim about scope that a merchant can immediately test against their own mess of tools.
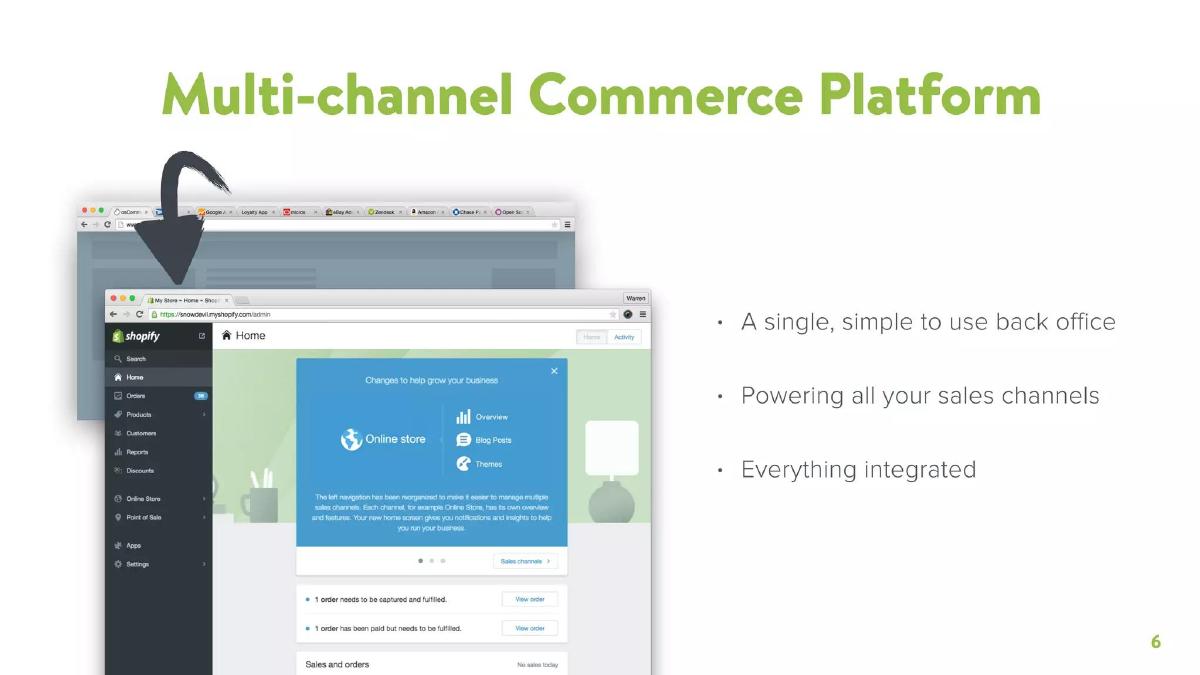
Slide 6 — Multi-channel Commerce Platform
Three bullets — a single, simple-to-use back office; powering all your sales channels; everything integrated — beside a real screenshot of the merchant admin, showing orders waiting to be captured and fulfilled and a "no sales today" state.
Note the choice of screenshot. It shows an empty sales day and two unfulfilled orders. A weaker deck would have shown a hockey-stick dashboard from the best merchant on the platform. Showing the ordinary state of the product for an ordinary merchant is what makes the claim of simplicity legible.
Slide 7 — Our Market
A pricing pyramid: Shopify Plus at the top, then Professional, then Basic, with Entrepreneurs as the base layer.
This is the segmentation slide, and it is doing quiet strategic work. It shows tiers, which shows a path: a merchant enters at the bottom and, if they succeed, climbs. That is the entire argument for why a business built on very small customers is not a bad business.
Slide 8 — Entrepreneurship: DID IT WORK?
A loop — IDEA, BUILD, DID IT WORK? — with three bullets: small merchants today can become the largest merchants tomorrow; completeness, reduced complexity and ease of use; leaves little room for disruption from below.
The third bullet is the most interesting line in the deck and the one most founders would never write. Shopify is explicitly answering the Innovator's-Dilemma question — what stops a cheaper, simpler product eating you from underneath? — by arguing that it already occupies the bottom. Naming the strongest objection to your own strategy, on your own slide, before anyone raises it, is the highest-leverage move available in a deck.
Slide 9 — Build-a-Business
Five celebrity mentors — Tim Ferriss, Seth Godin, Gary Vaynerchuk, Daymond John, Sir Richard Branson — with figures beside them ($35M, $2M, $56M–$100M, $250M, SOLD) and a Branson quote: "I'm biased, but I think being an entrepreneur is a pretty damn good thing."
This is the marketing-engine slide dressed as a logo wall. Build-a-Business was Shopify's flagship acquisition programme, and the celebrity row is evidence that the company could put famous operators to work recruiting merchants at scale.
It is also the weakest-labelled slide in the deck. The dollar figures next to each face are ambiguous — the slide does not say whether they are the mentor's own exit, the winning merchant's revenue, or something else. In an IR context the presenter fills that in verbally. In a PDF, an unlabelled number is a number the reader either discounts or mistrusts.
Slide 10 — Headroom on SMB TAM
Two nested circles: a $10B TAM across roughly 10M merchants in current core geographies, inside a $46B global TAM across 46M merchants. Footnotes name the source (AMI Partners), define a merchant as a retailer with fewer than 500 employees including sole proprietorships and home-based businesses, list the core geographies (U.S., Canada, U.K., Western Europe, Australia, New Zealand), and state the derivation: annualised revenue per merchant of approximately $1,000 based on the three months ended 31 March 2015.
This is the slide to copy, and it is the slide almost no private deck gets right. The market size is not one big number in a box. It is a count of businesses multiplied by a revenue per business that the company actually earns , with the definition of the unit spelled out, the geography stated, the source named and the measurement window dated. An analyst can rebuild it. So can you: 46M merchants × ~$1,000 = ~$46B.
Compare that with the way most seed decks handle TAM — a single unsourced figure lifted from a consultancy press release, with no path from the number to the company's own revenue line. Shopify's version is smaller and infinitely more persuasive, precisely because it is checkable.
Slide 11 — Larger Brands
A logo wall: Tesla, Goop, Patagonia, The Economist, Wikipedia, Budweiser, Strava, GitHub, Nestlé, Black Milk, DODOcase, The Chive and more.
The purpose is not social proof for its own sake — it is proof of the slide-7 thesis. If the pyramid climbs, there must be people at the top. These logos are the evidence that a platform sold to snowboard hobbyists also holds Tesla.
Slide 12 — Build-a-Business Success: DODOcase
A dated timeline for one merchant. April 2010: enters the competition. June 2010: 10,000 orders in the first 90 days. July 2010: wins Build-a-Business. April 2011: first-year sales over $3M. June 2011: opens a retail location. November 2011: Obama starts using a DODOcase. 2012: expands to iPhone cases. 2013: launches a Facebook store. 2014: upgrades to Shopify Plus. 2015: 22 full-time employees and growing.
This is the best argument in the entire deck, and it is made without a single company-level metric. The pyramid on slide 7 says merchants climb tiers. Slide 12 shows one merchant climbing every tier over five years — entering through a marketing programme, growing into retail, adding channels, and ending on the most expensive plan. Net revenue retention, expansion revenue and channel attach are all in there, told as a story a human can hold.
If you take one structural lesson from this deck into a seed pitch, take this one: pick a single customer and show their five-year arc with dates. It is worth more than a cohort chart to most readers, and you can build it with one customer.
Slides 13 and 14 — Partner Ecosystem and Strategic Partners
Slide 13 is a hub-and-spoke diagram with 200K merchants at the centre, surrounded by app developers feeding the Shopify App Store, agencies feeding Shopify Experts, and theme designers feeding the Theme Store. Slide 14 names strategic partners — Amazon, AdRoll — plus design and development agencies.
The flywheel argument, drawn rather than asserted: more merchants attract more developers, more apps make the platform more useful, which attracts more merchants. The 200K merchant count in the middle is the only place in the first half of the deck where a scale number appears, and it is placed where it does the most work — as the fuel for the loop, not as a vanity stat on its own slide.
Slide 26 later calls this ecosystem "difficult to replicate", which is the closest the deck comes to using the word moat. It has earned the right to that phrase by slide 13, which is the correct order.
Slides 15 and 16 — Distribution and Brand
Slide 15 is a collage of the acquisition machine: the Shopify blog, guides, SEO listings, physical events, drop-shipping content, customer success stories. Slide 16 is a Google Trends chart filtered for the USA from 2009 to 2015, plotting searches for "Ecommerce" against "Shopify", under the headline Synonymous with Ecommerce .
Slide 16 is a smart use of free third-party data. Google Trends is public, dated, independent and instantly credible, and the rising line against a flat category term makes the brand argument without a single self-reported figure. Any founder can pull the same chart today for their own category — and unlike a customer testimonial, nobody suspects you of choosing the flattering sample.
The one weakness: no axis labels or index values, which means the chart shows shape but not magnitude.
Slide 17 — Shopify's Unique Recipe
Three pillars: Great Technology (multi-tenant, scalable, high-availability architecture), Beautiful Design (simple, limitless customisation of gorgeous themes), Robust Ecosystem (hundreds of apps, themes and experts).
A summary slide for the qualitative half. Three pillars is the right number and the sub-lines are specific enough to be checkable ("multi-tenant" is an architecture claim, not an adjective). This is also the handoff into the numbers.
Slide 18 — THE NUMBERS
Underrated technique. A deck that runs 29 slides needs internal chapter breaks so a reader knows where they are, and a divider costs nothing. Most private decks over 15 slides would read better with one.
Slide 19 — Financial Highlights
Three headers: Growth (strong, consistent growth in revenue, MRR and GMV), Powerful Business Model (success-based revenue built on a large recurring subscription base), Long-Term Focus (track record of cash management and investing for the long term).
This is the thesis for the financial section stated before the charts, so the reader knows what each chart is meant to prove. Saying the argument first and then evidencing it is more effective than making the reader infer the argument from four bar charts in a row.
Slide 20 — Revenue growth
Stacked bars splitting merchant solutions from subscription solutions: $23.7M in 2012 , rising through 2013 and 2014, with $195.0M at the midpoint of management's 2015 forecast (as of 4 November 2015), and a nine-month 2014 versus nine-month 2015 comparison showing $69.8M for the 2014 period. Growth callouts of +86% and +109% sit on the chart. Drivers listed alongside: growing merchant base, expanding GMV, introduction and adoption of merchant offerings, robust partner ecosystem.
Three things worth stealing. First, the revenue is split by type , so a reader can see the subscription base underneath the transactional layer rather than one undifferentiated bar. Second, the forecast is explicitly labelled as the midpoint of a management range with the date the range was issued — the deck never lets a projection masquerade as a result. Third, the drivers are printed next to the chart, so the growth has a stated mechanism instead of being a shape.
Slide 21 — MRR growth
$9.8M MRR by the end of the period, on an 85% CAGR from 2012, with a full definition printed on the slide: MRR is calculated at period end by multiplying the number of merchants on subscription plans by the average monthly subscription plan fee in effect on the last day of that period, assuming they maintain their plans the following month.
Printing the formula is the move. Every company computes MRR slightly differently, and a definition on the slide removes an entire class of diligence question. If your deck shows ARR, MRR, GMV, active users or retention, define the metric on the same slide — it costs eight words and buys you credibility that no bar height can.
Slide 22 — GMV growth
$0.7B in 2012 rising to $3.8B for the nine months to 2014 and $4.9B for the nine months to 2015 , with a +128% callout, and drivers listed: more merchants, higher average GMV per merchant, introduction of POS.
GMV is the platform-health metric and it is correctly kept separate from revenue rather than blended into it. The three drivers again split volume growth into a supply effect, an intensity effect and a product effect — which is exactly how an analyst would decompose it.
Slide 23 — Gross profit
$18.9M (2012) → $36M (2013) → $62.1M (2014) , and $42.3M for nine months 2014 against a larger nine-month 2015 figure, with +68% and +80% callouts. Footnote: excludes stock-based compensation expense.
The footnote is the point. A non-GAAP presentation is fine as long as the exclusion is disclosed on the same page — and slide 29 then reconciles it line by line back to GAAP.
Slide 24 — Operating Leverage
S&M, R&D and G&A plotted as a percentage of revenue across 2012, 2013, 2014 and YTD 2015. Footnote: excludes SBC and sales-tax expense.
This is the most quietly powerful chart in the deck. Absolute cost bars would rise every year and prove nothing. Costs as a share of revenue, falling over four periods, is the whole argument that the model gets more profitable with scale — expressed in one chart with no adjectives attached.
Slide 25 — Growth Vectors
Six arrows around a wheel: more merchants, more GMV, more channels, more solutions, more partners, more international penetration.
The forward-looking slide, and notably it contains no numbers and no dates. For an IR audience that is deliberate — a public company does not hand out unguided targets. For a startup, this same slide with no timeline attached would be the weakest page in your deck, because in a private round the timeline is the plan.
Slide 26 — Investment Highlights
Five lines: Enormous Opportunity (multichannel commerce platform targeted at the SMB market); Powerful Business Model (rapidly growing SaaS and success-based model); World-class Product (well-crafted for simplicity and scalability); Vast Ecosystem (engaged and expanding partner ecosystem that is difficult to replicate); Vision (product-driven team with a long-term focus).
A clean five-point close that maps back to earlier slides one-for-one. Nothing new is introduced on the last content page, which is correct.
Slides 27–29 — Store grid, Appendix, GAAP reconciliation
Slide 27 is a grid of merchant storefronts. Slide 28 is an APPENDIX divider. Slide 29 is a reconciliation table walking GAAP gross profit, sales and marketing, and research and development to their non-GAAP equivalents by removing stock-based compensation, with percentages of revenue alongside — non-GAAP gross margin moving from 80% in 2012 down toward 56% in the latest period as lower-margin merchant solutions grow.
The reconciliation is the credibility anchor for the entire numbers section. It shows the company will hand you the adjustment rather than hide it. It also quietly discloses the least flattering fact in the deck — gross margin is compressing as the payments and shipping business grows — in a table, in an appendix, without spin.
What this deck does better than most startup pitch decks
TAM is built, not quoted. Merchant count × the revenue the company actually earns per merchant, with source, definition, geography and measurement window on the slide. · The moat is proved with a story. DODOcase's five-year, nine-milestone arc demonstrates expansion revenue better than any retention chart on the page. · Metrics carry their own definitions. MRR is defined in full on the MRR slide; non-GAAP figures name their exclusion and are reconciled in the appendix. · Forecasts are labelled as forecasts. The 2015 revenue figure is stamped as the midpoint of a management range and dated 4 November 2015. · Efficiency is shown as a ratio. Costs as a percentage of revenue over four periods proves leverage in a way absolute numbers never can. · The hardest objection is answered unprompted. "Leaves little room for disruption from below" tackles the classic low-end attack on slide 8, before anyone asks. · Third-party data does the branding. A public Google Trends chart makes the brand claim, so the reader is not asked to trust a self-reported number. · Every growth chart names its drivers. Revenue, GMV and MRR each list the mechanisms behind the shape.
Where this deck would fail in an investor meeting
There is no ask. No amount, no instrument, no use of funds. Correct for IR, fatal for a private round. · There is no team slide. At seed, the team is most of the decision. Here it appears only as "product-driven team" in a bullet on slide 26. · There is no competition slide. No BigCommerce, no Magento, no WooCommerce, no Amazon-as-a-threat — Amazon appears only as a partner logo. · There is no problem slide. The pain is implied by the Snowdevil screenshot and never stated. A private deck has to say the problem out loud. · Unlabelled numbers on slide 9. The dollar figures beside the celebrity mentors are never defined in the file. · No unit economics. No CAC, no payback period, no churn, no net revenue retention as a number — the DODOcase story implies expansion but never quantifies it. · Slide 25 has no timeline. Six growth vectors with no sequencing, sizing or dates. · Two slides for one idea. The slide 4 / slide 5 build works live and wastes a page in an emailed PDF. · Unlabelled chart axes. The Google Trends chart shows shape without magnitude.
Public-company IR deck vs. seed investor deck
Opening Logo, then a legal Safe Harbour page One line stating what you do and for whom
Problem Implied by a 2004 store screenshot Stated explicitly, with evidence it is expensive
Team One bullet on the summary slide A dedicated slide — often the deciding page
Market Bottom-up TAM, sourced and dated Identical approach; this transfers perfectly
Traction Four years of audited-grade financials Whatever is real, with the measurement window stated
Competition Absent Required, with an honest axis of difference
Forecast One dated management range midpoint A plan with dates, tied to the money being raised
Ask None Amount, instrument, runway bought, milestones unlocked
Length 29 slides plus appendix 10–15 slides, with the detail in an appendix
How you would rebuild this as a private fundraising deck
Open on the Snowdevil slide, not the logo. Lead with the artifact that proves you lived the problem, then name the problem in one sentence. · Cut slides 4 and 5 into one. "One platform, every channel, any device" with the integrated back office revealed in the same frame. · Add a team slide after the solution. Who built this, and why you specifically. · Keep slide 10 exactly as it is. Bottom-up TAM with source, unit definition, geography and date is the single most transferable page in the deck. · Keep slide 12 and make it your traction slide. One customer, dated milestones, tier upgrades — this is expansion revenue told as a story. · Add the competition slide the deck omits. Name the alternatives, including "does nothing / uses a spreadsheet", and state your axis of difference. · Keep slide 24 and put a number on it. Costs as a percentage of revenue, plus your actual CAC payback in months. · Give slide 25 a calendar. Six growth vectors becomes three sequenced bets with dates and the headcount each needs. · Close on the ask, not on highlights. Amount, instrument, months of runway, and the specific milestones that runway buys. · Move slides 27–29 to an appendix. Reconciliation tables and store grids are for the follow-up, not the first read.
The transferable lesson
The reason this deck works is that every claim is attached to something a reader can independently check: a named research source and an arithmetic path for the market size, a public Google Trends series for the brand claim, a dated milestone list for one real merchant, a printed formula for MRR, and a GAAP reconciliation for every adjusted figure. Shopify never asks to be believed. It hands you the derivation and lets you do the sum.
You do not need a public company's financials to do the same thing. You need one market number you can build from the bottom up, one customer whose arc you can date, one metric you are willing to define on the slide, and one honest note on where the model is weakest. Most decks that fail do not fail because the business is bad — they fail because every number in them is asserted, and an investor who cannot check anything defaults to no.
Go through your own deck one page at a time and ask, for each number on it: can the reader rebuild this without asking me a question? Every page where the answer is no is a page doing less work than it looks like it is doing.
Frequently asked questions
- Is the Shopify pitch deck a real fundraising deck?
- No. The file is Shopify's investor-relations deck from January 2016, published after the company's May 2015 IPO. Slide 2 is a Safe Harbour forward-looking-statements disclaimer, and the deck contains no funding ask, no instrument and no use of funds. It was built for public-market analysts and shareholders, not for venture investors deciding whether to write a cheque.
- How many slides is the Shopify investor deck?
- Twenty-nine slides. Slides 1 to 17 cover the story — origin, platform, market, ecosystem and brand. Slide 18 is a 'THE NUMBERS' divider, and slides 19 to 24 hold the financials. Slide 25 lists growth vectors, slide 26 summarises the investment case, and slides 27 to 29 form an appendix with a merchant grid and a GAAP reconciliation table.
- What is Shopify?
- Shopify is a cloud-based commerce platform that lets small and medium merchants run an online store, sell across multiple channels and manage everything from a single back office. It grew out of Snowdevil, a snowboard store its founders built in 2004 because the available e-commerce software was unusable. The company listed on the NYSE and TSX in May 2015.
- Which Shopify slides should founders copy?
- Three. Slide 10, because it derives the market bottom-up from a merchant count times the revenue the company actually earns, with source, definition and date printed on the page. Slide 12, because it proves expansion revenue by dating one customer's five-year climb through the pricing tiers. And slide 24, because it shows costs as a percentage of revenue, which is the only honest way to demonstrate operating leverage.
- How did Shopify present its market size?
- As nested circles with the arithmetic exposed: roughly 10 million merchants and a $10B TAM in current core geographies, inside 46 million merchants and a $46B global TAM. The footnotes name AMI Partners as the source, define a merchant as a retailer with fewer than 500 employees, list the core geographies, and state that revenue per merchant is about $1,000 annualised based on the three months ended 31 March 2015.
- What is missing from the Shopify deck that a seed deck needs?
- An ask, a team slide, a competition slide, a problem slide, a dated plan and unit economics. None of those are failures in an investor-relations context, where the audience already owns the stock and can read the filings. In a private round each one is load-bearing, and a seed deck copying this structure would leave an investor with no way to price the risk.