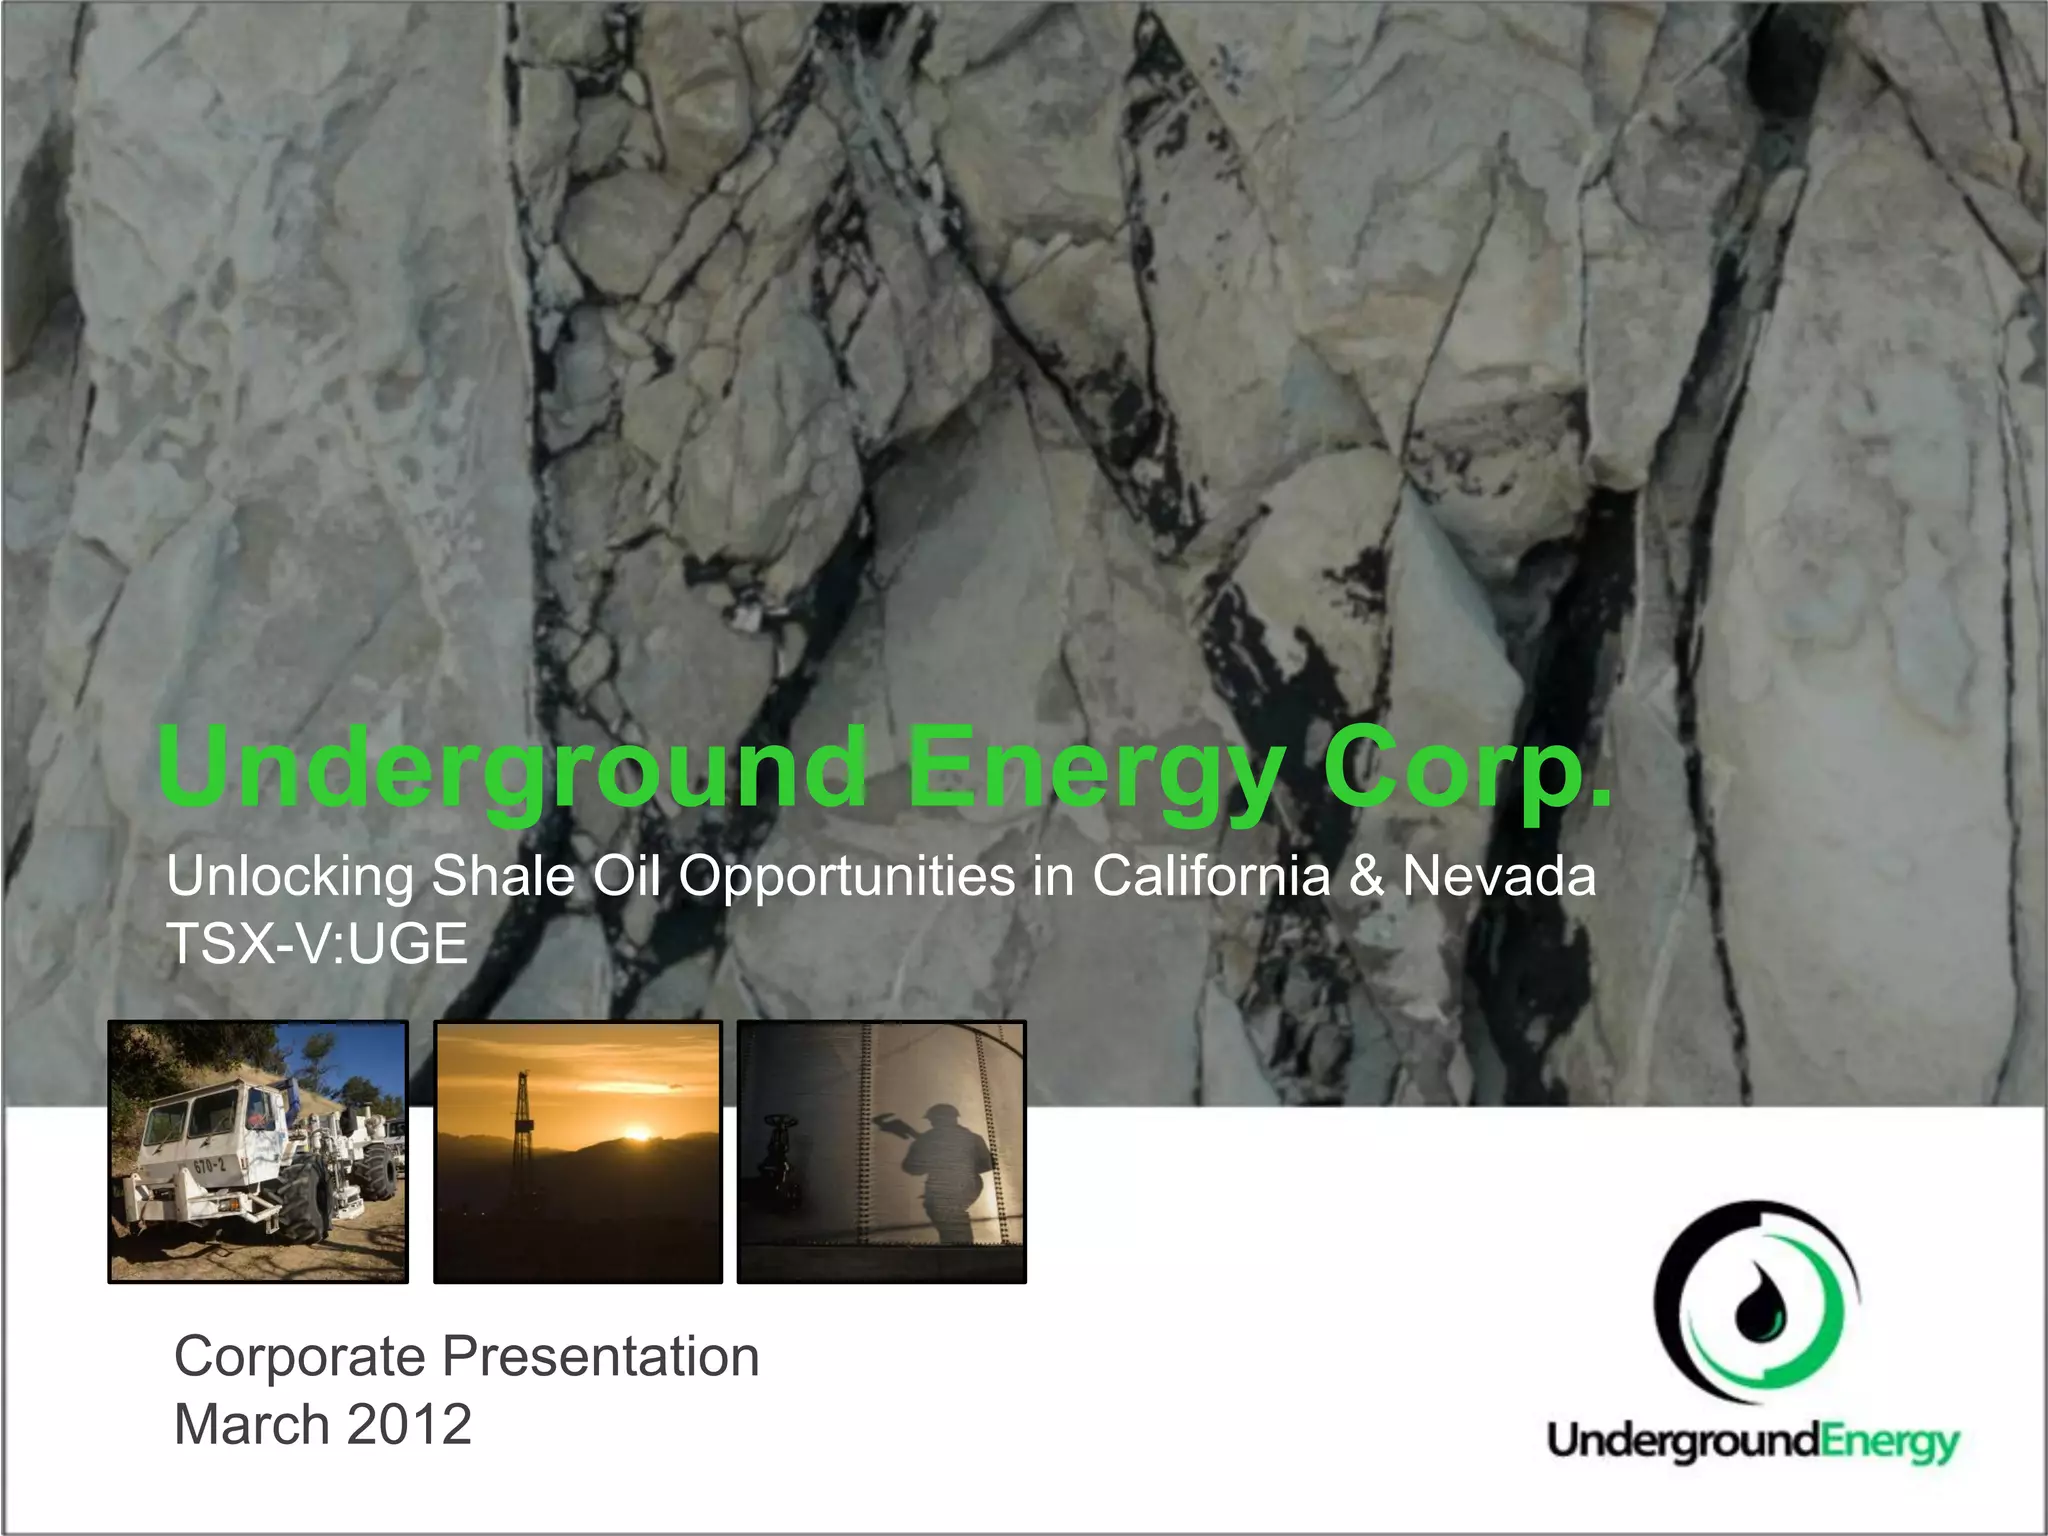
Underground Energy Corp. (TSX-V: UGE) presented this deck in March 2012 to update investors on its progress in unlocking shale oil opportunities in California and Nevada. Unlike a typical early-stage startup deck, this is a corporate update for a publicly traded entity that recently completed a Reverse Takeover (RTO). The presentation is heavily weighted toward technical geological data, seismic mapping, and long-term production modeling. With a reported asset base of over 70,000 net acres and a recent $25.5 million private placement, the company focuses on proving the economic viability of i…
Key takeaways
- The company is publicly traded on the TSX-V under the ticker UGE as of March 2012 (Slide 1).
- Recent achievements include a $25.5 million brokered private placement and the completion of an RTO (Slide 5).
- The asset base consists of 39,729 net acres in California and 31,286 net acres in Nevada (Slide 5).
- Initial production is stated at 80 barrels of oil per day (bopd) with drilling having commenced at Zaca in late February 2012 (Slide 5).
- The company projects an unrisked peak production of 22,300 boepd by 2020 for its Asphaltea prospect (Slide 17).
- Management estimates an overall unrisked project before-tax NPV 10% of $2.2 billion (Slide 17).
- Zaca Field vertical wells show an Estimated Ultimate Recovery (EUR) of 540 Mbbls compared to Oxy Monterey horizontal wells at 645 Mbbls (Slide 9).
- Historical recovery rates at Zaca are cited at 6.8% using primary recovery techniques only (Slide 13).
Underground Energy Corp. Deck Analysis
The March 2012 update for Underground Energy Corp. is a classic example of a natural resources sector investor presentation. It moves away from the narrative-driven storytelling of Silicon Valley startups and focuses instead on geological data, regulatory compliance, and capital-intensive infrastructure milestones. As a TSX-V listed company, the deck serves to maintain investor confidence following a successful capital raise and the commencement of new drilling operations.
Slide 1: Title and Positioning
The cover slide establishes the company's identity and its primary value proposition: "Unlocking Shale Oil Opportunities in California & Nevada." It prominently displays the TSX-V: UGE ticker, signaling to the reader that this is a public market vehicle. The imagery—seismic trucks, drilling rigs at sunset, and storage tanks—reinforces the industrial, asset-heavy nature of the business. The date, March 2012, is critical as it places the company in the midst of the North American shale boom.
Slide 5: Recent Achievements
This slide functions as the 'traction' slide. It lists several high-impact milestones that validate the company's transition from a shell or exploration-only entity to a producer. Key data points include:
Land Acquisition: 39,729 net acres in California and 31,286 net acres in Nevada. · Capitalization: A $25.5 million brokered private placement. · Operational Readiness: Completion of an RTO and commencement of trading. · Technical Investment: $3 million spent on seismic data acquisition and processing. · Production: Initial production of 80 bopd and the start of drilling at Zaca in late February 2012.
Slide 9: Monterey Shale Type Curves
Slide 9 provides the technical justification for the company's drilling strategy. By plotting "Type Curves" (production decline over time), the company compares its Zaca Field vertical wells against Occidental Petroleum (Oxy) Monterey wells. The chart shows that while Oxy's horizontal wells have a higher Estimated Ultimate Recovery (EUR) of 645 Mbbls, Underground Energy's vertical wells are competitive at 540 Mbbls. This data is intended to prove that the geology of their specific acreage is high-quality and predictable.
Slide 13: Underground’s Zaca Assets
This slide uses a detailed map to show the lease boundaries and geological structures identified by seismic data. It highlights a "Historic recovery rate" of 6.8% achieved through primary recovery. The core argument here is the "Potential to increase recovery rates further" using modern techniques. The slide lists deviated/horizontal drilling and Enhanced Oil Recovery (EOR) as the levers for future growth, referencing historical waterflooding and thermal testing from the mid-20th century as proof of concept.
Slide 17: Asphaltea Development Profile
This is the 'vision' slide, projecting the long-term potential of the Asphaltea prospect. It forecasts an unrisked peak production of 22,300 boepd by the year 2020. More importantly for investors, it estimates an unrisked before-tax NPV (Net Present Value) at a 10% discount rate of $2.2 billion. The bar chart visualizes the split between the South and North prospects, showing a steady ramp-up in production and cumulative free cash flow through 2025.
Slide 21: Initial Development Profile
While Slide 17 looks at the decade, Slide 21 focuses on the immediate calendar year (2012). It sets specific, measurable targets for the market:
Exit Production: 510 bopd by December 2012. · Cash Flow: An annualized operating cash flow of $9.1 million by year-end.
The chart shows a steep production ramp beginning in April, which likely corresponds to the expected results from the drilling that commenced in February.
Slide 25: Notes to Disclosure
In the world of public oil and gas companies, the disclosure slide is as important as the data slides. This slide contains seven detailed points regarding the estimation of prospective resources, compliance with National Instrument 51-101 (NI 51-101) standards, and the definition of "best estimates." It serves as a legal shield, clarifying that "unrisked" figures do not guarantee commercial discovery and that historical data is based on third-party reports from 1985 and 2011.
Slide 29: History of Monterey Shale
The final slide in this selection provides regional context. It traces the history of the Monterey Shale from the first production in 1895 through the various development phases by majors like Shell, Chevron, Mobil, and EOG. By placing themselves in this timeline, Underground Energy is positioning itself as the next logical step in a century-long history of successful extraction in the California basins.
What Works in This Deck
1. Technical Credibility: The use of type curves, seismic mapping, and EUR estimates provides a level of technical depth that institutional energy investors require. It shows the management team understands the geology, not just the finance. 2. Benchmark Comparisons: Comparing their assets to Occidental Petroleum (Slide 9) gives investors a familiar frame of reference for what 'success' looks like in this specific shale play. 3. Clear Short-term vs. Long-term Goals: By providing both a 2012 exit target (Slide 21) and a 2020 peak production target (Slide 17), the company gives investors a way to measure progress in the near term while maintaining a large-scale upside narrative.
What Is Missing
1. Team Slide: In the provided 8 slides, there is no mention of the management team or their specific experience in shale. In oil and gas, the 'track record' of the engineers and geologists is often the deciding factor for investors. 2. Detailed Use of Proceeds: While they mention a $25.5 million raise, the deck does not explicitly break down how the next tranche of capital will be spent (e.g., how many wells will $X million buy?). 3. Risk Mitigation: Beyond the legal disclosures, there is little discussion of environmental regulations in California, which are notoriously stringent, or the infrastructure required to transport the projected 22,300 boepd to market.
Founder Takeaways
Quantify the 'Unlocking' Potential: If your business relies on applying new technology to old assets (like shale oil or legacy software), you must clearly show the 'before and after.' Slide 13 does this effectively by contrasting the 6.8% historical recovery with the modern techniques that will drive future gains. Use Industry Standards: Underground Energy adheres to NI 51-101 reporting standards. For any startup in a regulated industry (FinTech, MedTech, Energy), using the specific language and reporting metrics of your regulators is non-negotiable for building trust. Visualizing the Ramp: The production charts in this deck are excellent because they overlay two different metrics (daily production and cumulative cash flow) on the same time axis. This helps investors visualize how operational success translates directly into financial health.
Frequently asked questions
- What is the current stage of Underground Energy Corp. in this deck?
- At the time of this presentation in March 2012, Underground Energy Corp. was a production-ready company trading on the TSX Venture Exchange. They had recently completed a Reverse Takeover (RTO) and secured a $25.5 million private placement. They were no longer in the 'idea' phase, having commenced drilling at their Zaca site and reporting initial production of 80 barrels of oil per day.
- How does the company justify its valuation and potential?
- The company uses 'type curves' and Net Present Value (NPV) projections. Specifically, they cite an unrisked before-tax NPV of $2.2 billion for the Asphaltea prospect. They compare their vertical well performance (540 Mbbls EUR) against industry leaders like Occidental Petroleum (645 Mbbls EUR) to demonstrate that their assets are competitive within the Monterey Shale region.
- What specific geographic areas is the company targeting?
- The focus is almost exclusively on California and Nevada. In California, they highlight the Zaca Field and the broader Monterey Shale, which has a production history dating back to 1895. Their land holdings total nearly 40,000 acres in California and over 31,000 acres in Nevada, positioning them as a significant regional player in shale oil.
- What technical methods are they using to increase oil recovery?
- The deck outlines a transition from historical primary recovery (which yielded 6.8%) to modern techniques. These include the use of 3D seismic data (processed at a cost of $3 million), deviated and horizontal drilling, and potential Enhanced Oil Recovery (EOR) methods such as waterflooding and thermal testing, which were historically tested in the 1950s and 60s.
- What are the primary risks associated with the projections in the deck?
- The projections are 'unrisked,' meaning they assume successful discovery and commercial viability. Slide 25 explicitly warns that there is no certainty that prospective resources will be discovered or be commercially viable. The economics are also highly sensitive to oil prices, based on October 2011 and January 2012 NYMEX Futures strip prices.