Vercel's 19-slide deck centers on the symbiotic relationship between the Next.js open-source framework and the Vercel deployment platform. The narrative moves quickly from a 'jeopardy' state of the web to a three-pillar solution: production infrastructure, an intelligent edge network, and cross-functional collaboration. The deck is notably light on traditional financial metrics like ARR or CAC, instead leaning heavily on adoption signals: 80,000 registrants for Next.js Conf (Slide 10), presence in 11 of the AlexaRank 100 (Slide 9), and a 27% Month-over-Month growth in deployments (Slide 16).…
Key takeaways
- The deck uses a high-impact quote from Paul Graham on Slide 2 to frame spontaneous customer recommendation as the primary engine for exponential growth.
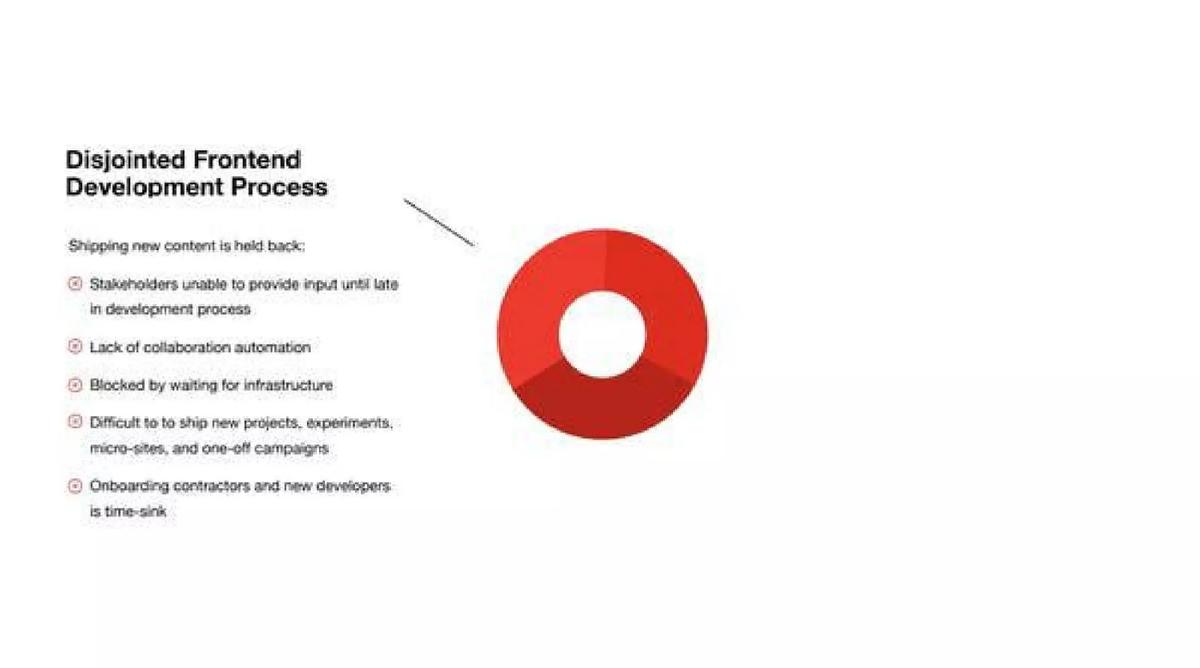
- Vercel identifies the core problem as a 'Disjointed Frontend Development Process' where stakeholders are unable to provide input until late in the cycle (Slide 4).
- Traction is anchored in Next.js, which is shown to be outperforming competitors like Gatsby in AlexaRank 10,000 penetration (Slide 9).
- The 'Develop, Preview, Ship' workflow is quantified with impressive infrastructure stats: 70 cities, 4.5B requests per week, and 99.99% uptime (Slide 14).
- Commercial validation is demonstrated by a timeline of enterprise logos, showing a significant acceleration in Q3 2020 following the February 2020 GTM launch (Slide 15).
- Growth metrics are presented as MoM percentages rather than absolute dollar values, with Monthly Active Teams growing at 17% MoM (Slide 16).
- The deck completely omits a team slide, a specific funding ask, and a detailed breakdown of unit economics or pricing tiers.
- Competitive analysis is limited to a single slide comparing Next.js adoption to Gatsby across the top 1 million sites (Slide 18).
The Momentum Play: Vercel's Narrative of Developer Dominance
Vercel’s pitch deck is a distinct example of a 'momentum deck.' Rather than leading with complex financial models or a dense competitive matrix, it leads with the sheer force of developer adoption. Founded in 2015, the company used this presentation to bridge the gap between their open-source success with Next.js and their commercial potential as an enterprise platform. The deck is minimalist, high-contrast, and focused on a single narrative: the web is changing, developers love our tools, and the enterprise is following suit.
Slides 1-3: The Hook and the Stakes
Slide 1 is a minimalist title slide featuring the Vercel logo and the three-word mantra: 'Develop. Preview. Ship.' This sets the stage for the workflow-centric approach the company champions. Slide 2 immediately moves to social proof, featuring a tweet from Paul Graham. The quote emphasizes that startups grow when they make something customers love enough to spontaneously recommend. By including a sub-tweet from a developer praising Vercel for removing the 'mind-numbing struggle' of React, Vercel validates their product-market fit through the lens of one of tech's most influential figures. Slide 3 introduces the 'Problem' phase with a stark, red-text warning: 'The web is in jeopardy.' This creates a sense of urgency without immediately defining the technical specifics, forcing the viewer to ask 'why?'
Slides 4-6: Defining the Friction
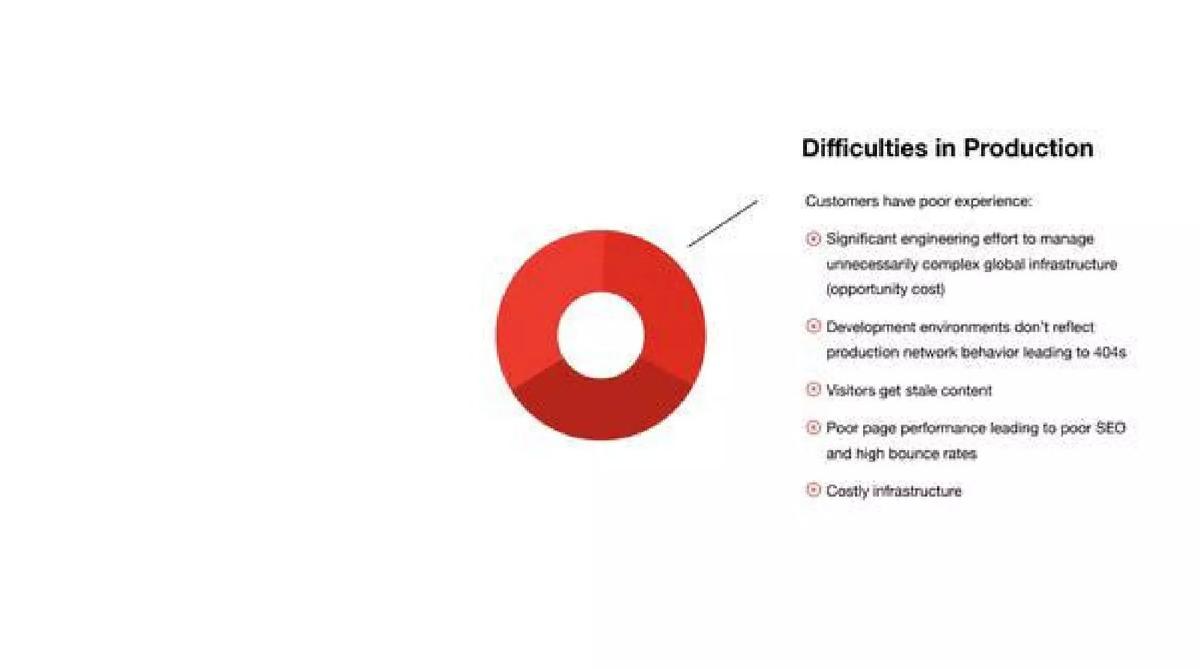
The deck breaks down the 'jeopardy' into three specific categories, each represented by a segment of a red ring icon. Slide 4 focuses on the 'Disjointed Frontend Development Process.' It lists specific pain points: stakeholders unable to provide input until late, lack of automation, and onboarding being a 'time-sink.' Slide 5 shifts to 'Difficulties in Production,' highlighting the 'opportunity cost' of managing complex global infrastructure and the technical failures (404s, stale content, poor SEO) that result from development environments not reflecting production. Slide 6 concludes the problem set by stating teams 'are not learning from prior work,' citing frequent regressions and a lack of insight into performance degradation. Together, these slides paint a picture of a fragmented, inefficient industry ripe for consolidation.
Slides 7-10: The Open Source Engine
Slide 7 is a simple transition to 'The Solution,' followed by Slide 8 , which places the Next.js logo alongside Vercel. This is a crucial strategic move; it tethers the commercial entity (Vercel) to the industry-standard framework (Next.js). Slide 9 provides the data to back this up. It shows a 2-year growth chart of downloads, claiming Next.js is used by 11 of the AlexaRank 100 and 493 of the AlexaRank 10,000. Slide 10 uses the 'Next.js Conf' as a metric for community scale, noting 16,000 registrants in the first 24 hours and a total of 80,000. This slide uses a wall of developer avatars to visually represent the scale of the community, reinforcing that Vercel isn't just a tool, but a movement.
Slides 11-14: The Vercel Platform Architecture
Having established the framework's popularity, the deck explains how Vercel monetizes and manages that traffic. Slide 11 introduces a three-layered diagram: Production Infrastructure, Intelligent Edge Network, and Cross-Functional Collaboration. Slide 12 drills into collaboration, promising to let business lines 'collaborate around digital experiences instead of code.' Slide 13 focuses on the 'Intelligent Edge Network,' highlighting 'framework-aware' delivery and 'zero-config' management. Slide 14 summarizes the 'Develop, Preview, Ship' workflow with concrete infrastructure metrics: 70 cities, 4.5 billion requests per week, 9 petabytes of data served, and 99.99% guaranteed uptime. These figures move the conversation from 'cool developer tool' to 'enterprise-grade infrastructure.'
Slides 15-19: Commercial Traction and Growth
Slide 15 is the 'Money Slide' for investors. It states, 'We turned on Enterprise GTM in February 2020, and are growing quickly.' It displays a timeline of logos including Airbnb, TripAdvisor, HashiCorp, and Scale, showing a clear acceleration of high-value customers in Q3. Slide 16 shows three growth charts for 'Paid product usage': Monthly Active Teams (17% MoM growth), Monthly Active Users (16% MoM growth), and Deployments (27% MoM growth). Slide 17 shows that Next.js adoption continues to expand in parallel, with 20% MoM growth in monthly builds. Slide 18 offers a rare competitive look, comparing Next.js to Gatsby. It shows Next.js growing at nearly double the rate of Gatsby in the 'Top 1m sites' category (23.5% vs 12.6%). The deck ends on Slide 19 with the simple Vercel triangle logo, a confident, minimalist finish.
What Works
The 'Framework as a Moat' Strategy: By showing the massive adoption of Next.js (Slide 9), Vercel positions itself as the natural and most efficient home for the world's most popular frontend framework. · Quantified Community: The conference registration numbers (Slide 10) are a powerful proxy for developer mindshare, which is often harder to quantify than revenue but equally important for long-term platform plays. · Clear GTM Inflection Point: Slide 15 clearly marks when the enterprise strategy started. Showing a cluster of major logos immediately following that date proves that the product was 'pulled' into the enterprise rather than forced. · Infrastructure Scale: The stats on Slide 14 (4.5B requests, 9PB data) remove any doubt about the platform's ability to handle massive, global scale.
What Is Missing
The Team: There is no slide introducing the founders or the engineering leadership. For a company so deeply rooted in open-source, the absence of the 'who' behind the 'what' is surprising. · The Financials: While MoM growth percentages are provided, there is no mention of absolute revenue, ARR, or average contract value (ACV) for the new enterprise customers. · The Ask: The deck does not state how much money is being raised or how the capital will be deployed (e.g., expanding the sales team vs. R&D). · Business Model Details: There is no explanation of the pricing tiers or how the company converts free Next.js users into paying Vercel customers.
What a Founder Should Copy
Use Social Proof Early: Don't wait until the end to show people love your product. The Paul Graham tweet on Slide 2 sets a high-authority tone immediately. · Proxy Metrics for Traction: If you don't have millions in revenue yet, use adoption metrics that matter in your industry. Vercel's use of AlexaRank penetration and conference sign-ups are excellent examples. · Visualizing the Workflow: Slide 14 does a great job of taking an abstract concept ('Develop, Preview, Ship') and giving it physical and technical weight through icons and large-scale numbers. · Direct Competitive Comparison: Slide 18 is effective because it doesn't just say 'we are better.' It uses third-party data to show 'we are growing faster in the segments that matter.'
Frequently asked questions
- What is the primary problem Vercel aims to solve according to the deck?
- Vercel identifies a 'disjointed frontend development process' as the central issue. On Slide 4, they detail how shipping new content is held back by a lack of collaboration automation and stakeholders being unable to provide input until late in the process. They also highlight 'Difficulties in Production' on Slide 5, noting that development environments often fail to reflect production behavior, leading to errors and poor performance.
- How does Vercel demonstrate market traction without sharing revenue figures?
- The deck relies on proxy metrics for market dominance. Slide 9 shows Next.js is used by 11 of the AlexaRank 100 and 493 of the AlexaRank 10,000. Slide 10 highlights community engagement with 80,000 registrants for their conference. Finally, Slide 16 shows consistent double-digit Month-over-Month growth across active teams (17%), active users (16%), and total deployments (27%).
- What are the three pillars of the Vercel solution?
- As shown on Slide 11, Vercel defines its platform through three layers: Production Infrastructure, an Intelligent Edge Network, and Cross-Functional Collaboration. Slide 13 elaborates on the Edge Network, emphasizing framework-aware delivery, zero-config cache management, and leading time-to-first-byte, while Slide 12 focuses on allowing business lines to collaborate around 'digital experiences instead of code.'
- How does the deck address competition?
- Competition is addressed narrowly through the lens of open-source framework adoption. Slide 18 provides a direct comparison between Next.js and Gatsby. It shows Next.js growing by 23.5% in the top 1 million sites between May and August, compared to Gatsby's 12.6% growth in the same category, positioning Next.js as the faster-growing and more widely adopted choice.
- What critical fundraising components are missing from this deck?
- This deck is highly focused on product and traction but lacks several standard slides. There is no 'Team' slide to establish founder-market fit, no 'Ask' slide detailing the amount of capital sought or its intended use, and no 'Business Model' slide explaining specific pricing or LTV/CAC ratios. It functions more as a momentum-building narrative than a comprehensive financial prospectus.