The Welify.com investment deck presents a vision for "redefining e-commerce" in the BPC industry, specifically targeting B2B opportunities in Thailand and Indonesia. The deck highlights a three-person management team with varied experience and outlines a multi-channel approach encompassing B2B Online, B2B Direct, Offline Stores, and Online Stores. It contrasts B2C and B2B unit economics, showing significantly higher average order baskets and customer lifetime value for B2B. The company positions itself as a solution to market entry barriers in the B2B BPC space and details its technology stac…
Key takeaways
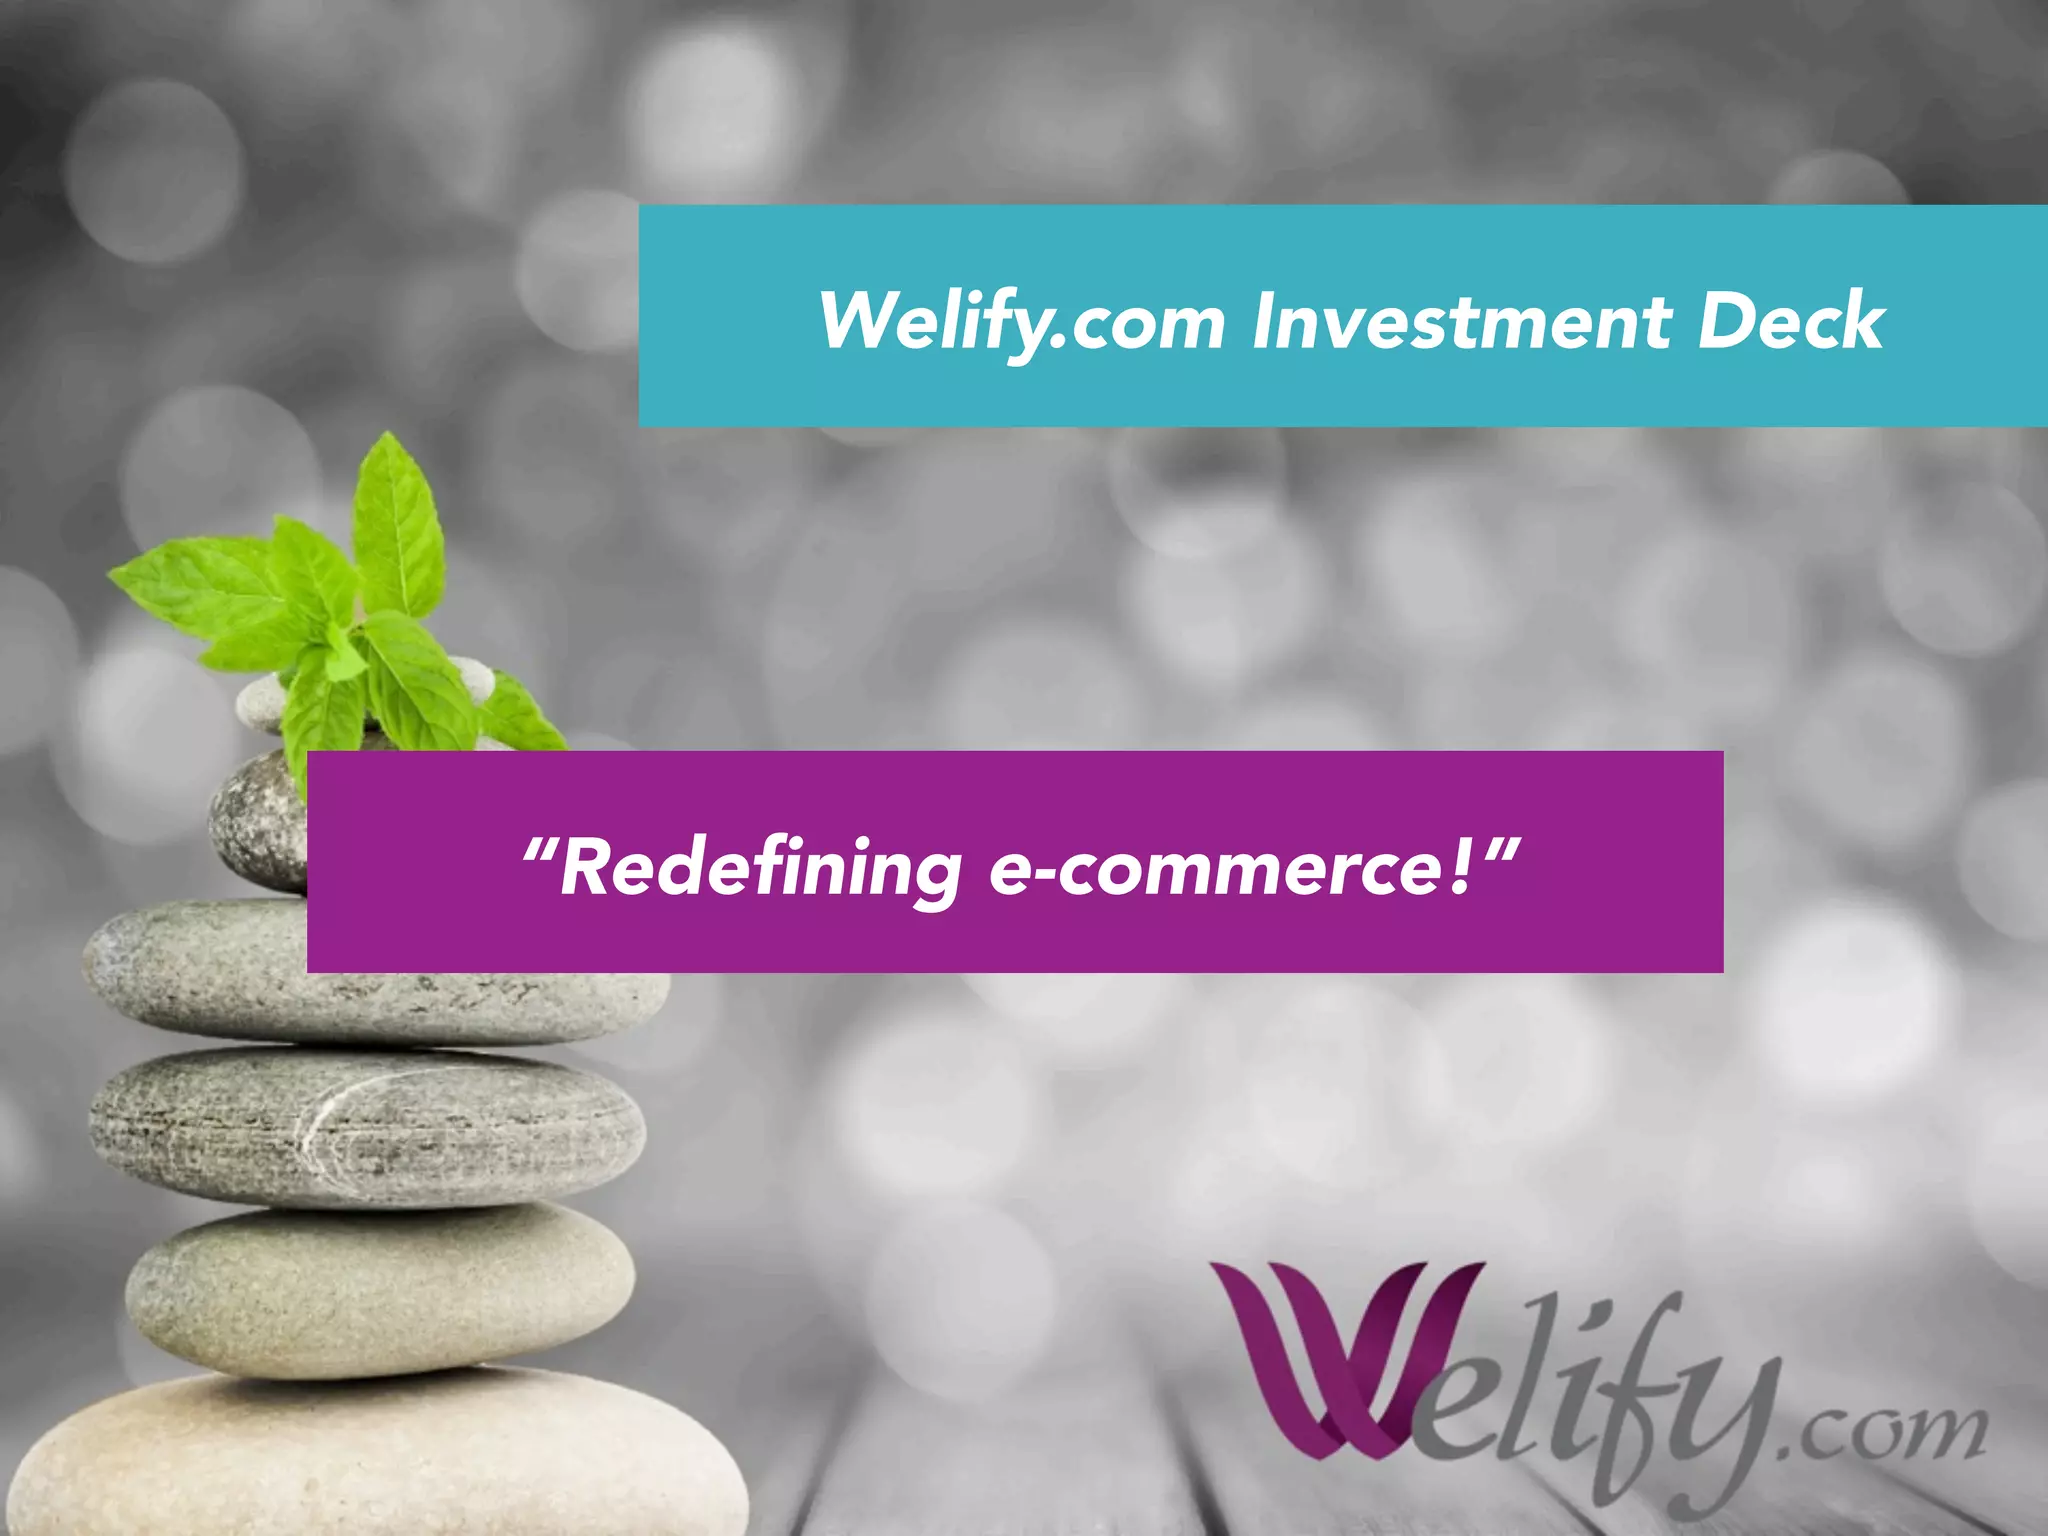
- The deck's title slide (Slide 1) declares the company's ambition to be "Redefining e-commerce!" and identifies itself as "Welify.com Investment Deck."
- Slide 2 introduces a three-person "key-management team" with titles like "Managing Master," "HR – Education Expert," and "Sales Specialist," along with hashtags describing their skills and experience.
- Welify.com aims to become "the regulator of a multi-billion USD industry!" (Slide 3) by engaging with B2B Online (Salons, Day Spas), B2B Direct (Resorts, Hotels, Corporations), Offline Stores (Beauty Stores, Beauty Departments), and Online Stores.
- Slide 4 presents a comparison of B2C vs B2B unit economics in the BPC industry in Thailand, showing B2B with a 340 USD Average Order Basket versus 35 USD for B2C, and 12+ Orders / Year Customer Lifetime Value versus 2-3 Orders / Year for B2C.
- The company positions itself as a solution to "Barriers to enter the B2B BPC space?" (Slide 5), listing terms like "Know-How," "Industry Connections," and "Exclusive Distribution."
- Welify.com's technology stack (Slide 6) includes Magento and WordPress for "Processing," and Acommerce and NetSuite for "Fulfillment."
- Financial projections on Slide 7 show figures growing from 30 to 954, with additional bars growing from (6) to 346, labeled as "Figures listed are in Mill THB. Thailand + Indonesia territory."
- The deck does not explicitly state the problem Welify.com solves for its customers or the market opportunity size.
Welify.com Pitch Deck Teardown: Unpacking a B2B E-commerce Vision in Thailand
This teardown provides a detailed analysis of the Welify.com investment deck, based solely on the seven slides provided. The deck aims to present Welify.com as an investment opportunity in the e-commerce sector, with a particular focus on the B2B segment within the Beauty, Personal Care (BPC) industry. We will examine each available slide in order, highlighting what is presented, what is implied, and what critical information is omitted from this partial deck.
Overall Impressions & Context
The deck, titled "Welify.com Investment Deck" from its source listing, positions the company as an ambitious player looking to "Redefine e-commerce!" (Slide 1). While the available slides offer glimpses into the team, market approach, technology, and some financial data, they represent an incomplete picture. The deck's focus appears to be on establishing the B2B opportunity and the company's foundational elements. The context provided by the source listing is minimal, stating only the title and that the published year is not stated. The listing description was not provided. The deck has 14 slides in total, but only 7 are available for review.
Slide-by-Slide Breakdown
Slide 1: Cover Slide
The first slide serves as the cover for the "Welify.com Investment Deck." It features a background image of stacked stones with a small green plant, suggesting themes of balance, nature, or growth. Two colored banners overlay the image: a teal banner at the top reads "Welify.com Investment Deck," and a purple banner in the middle contains the tagline ""Redefining e-commerce!"". The company logo, "Welify.com" in a stylized purple font, is positioned at the bottom right. This slide introduces the company and its bold ambition without providing any specific details about its operations or market.
Slide 2: Team Slide
Titled "The unstoppable IBS key-management team!" within a teal banner, this slide introduces three individuals. The company logo, "Welify.com," is at the top center. Each team member is presented with a black and white circular photo, their name, and a title, followed by a list of hashtags describing their experience and attributes. The team members are:
Maes Kevin: Managing Master #Belgian #28Years #Founder #BusinessDevelopment #Strategies #FundRaising #Expansion #Delegating #Creative #ProblemSolving · Sarah Gieghase: HR – Education Expert #Belgian #34Years #Founder #HR #ProductKnowledge #Recruitment #Administration #TreatmentKnowledge #EducatorOfTheYear2014 · Siva Ramalingam: Sales Specialist #Singaporian #26Years #Sales #ClosingDeals #ThaiSpeaker #Negotiation #ExProFootballPlayer #Ambitious #StraighLinePersuasion
The slide emphasizes the founders' origins, years of experience, and specific skill sets relevant to business development, HR, and sales. The use of hashtags is a notable stylistic choice for conveying competencies.
Slide 3: Market Approach & Vision
This slide features the Welify.com logo at the top and a teal banner stating, "Becoming the regulator of a multi-billion USD industry!". The core of the slide is an infographic illustrating Welify.com's multi-faceted market engagement. A central purple 'W' logo is connected to four distinct segments:
B2B Online: Salons, Day Spas · B2B Direct: Resorts, Hotels, Corporations · Offline Stores: Beauty Stores, Beauty Departments · Online Stores (depicted with various e-commerce icons)
The visual suggests Welify.com aims to serve various customer types across both online and offline channels, positioning itself broadly within the identified industry. The claim of becoming a "regulator" suggests a dominant or influential market position.
Slide 4: B2C vs B2B Unit Economics
The title banner on this slide reads, "B2C vs B2B in the BPC industry here in Thailand." The Welify.com logo is at the top. The left side of the slide features an image of a laptop with a shopping cart and a package, visually representing e-commerce. The right side presents a direct comparison of key metrics between B2C and B2B:
Average Order Basket: 35 USD (B2C) VS 340 USD (B2B) · Customer Acquisition Cost: 10 – 15 USD (B2C) VS 144 USD (B2B) · Customer Lifetime Value: 2-3 Orders / Year (B2C) VS 12+ Orders / Year (B2B)
A note at the bottom states, "Based on Welify.com existing and forecasted data." This slide highlights the perceived superior economics of the B2B model, justifying the company's focus on this segment within the BPC industry in Thailand.
Slide 5: Barriers to Entry & Solution
This slide, with the Welify.com logo at the top, asks, "Barriers to enter the B2B BPC space?" in a teal banner. The slide uses a word cloud style to list various challenges, with prominent words including "Industry," "Know-How," "Proven Track Record," "Exclusive Distribution," "Talent," and "System Development." A silhouette of a person stands behind a barrier that has a sign attached to it reading "Solution! Welify.com." This visual metaphor positions Welify.com as the key to overcoming these significant market entry barriers in the B2B BPC sector.
Slide 6: Technology Stack
The Welify.com logo is at the top, and the teal banner states, "Welify.com is powered by...". This slide outlines the core technologies used by the company. An image of a tablet displaying a website is on the left. On the right, two main categories are presented:
Processing: Represented by logos for Magento (Open Source eCommerce) and WordPress. · Fulfillment: Represented by logos for Acommerce (Powering eCommerce) and NetSuite.
Arrows connect the processing platforms to the Welify.com logo (the 'W' symbol) and then to the fulfillment platforms, illustrating a flow from front-end processing to back-end fulfillment. This slide indicates that Welify.com leverages established, third-party platforms for its e-commerce operations.
Slide 7: Financial Projections
This slide, titled "E-com to speed up growth delivering strong EBITDA." in a teal banner, presents a bar chart with a green trend line. The Welify.com logo is at the top. The chart displays five sets of two bars, with the taller, pink bars showing values of 30, 163, 409, 628, and 954. The shorter, purple bars show values of (6), 34, 145, 243, and 346. The green line connects the tops of the pink bars, indicating growth. A note at the bottom clarifies, "Figures listed are in Mill THB. Thailand + Indonesia territory." While the slide mentions "strong EBITDA," it does not explicitly label what each set of bars represents (e.g., revenue, profit, specific KPIs). The presence of a negative value for the first purple bar is also notable.
What Works
Clear Vision Statement (Slide 1, 3): The deck immediately establishes a bold ambition to "Redefine e-commerce!" and become a "regulator of a multi-billion USD industry!" This sets a high-level vision for investors. · Team Introduction (Slide 2): A dedicated slide introduces the key management team, providing their roles, nationalities, years of experience, and specific skills using hashtags. This offers a quick overview of the human capital. · B2B Focus Justification (Slide 4): The comparison of B2C and B2B unit economics clearly highlights the perceived advantages of the B2B model in terms of Average Order Basket and Customer Lifetime Value, providing a data-backed reason for their strategic focus. · Market Entry Barrier Acknowledgment (Slide 5): By identifying significant barriers to entry in the B2B BPC space and positioning Welify.com as the solution, the deck suggests a strategic understanding of the market challenges. · Technology Transparency (Slide 6): Listing the specific platforms (Magento, WordPress, Acommerce, NetSuite) used for processing and fulfillment provides clarity on the underlying technological infrastructure, indicating a reliance on proven solutions rather than custom builds. · Geographic Focus (Slide 4, 7): The deck specifies "Thailand" and "Thailand + Indonesia territory" as the operational regions, providing important geographic context for the market and financial data.
What is Missing
Problem Statement: There is no explicit slide or section detailing the specific problem Welify.com is solving for its customers or the market. While Slide 5 mentions barriers, it doesn't articulate the customer pain point. · Market Size & Opportunity: Although Slide 3 mentions a "multi-billion USD industry," the deck lacks a specific market size analysis, total addressable market (TAM), serviceable available market (SAM), or serviceable obtainable market (SOM). · Business Model: The deck does not clearly articulate how Welify.com generates revenue beyond implying e-commerce transactions. Details on pricing, commission structures, or other revenue streams are absent. · Competitive Landscape: There is no mention of competitors, how Welify.com differentiates itself, or its unique selling proposition (USP) in the market. · Go-to-Market Strategy: While Slide 3 shows distribution channels, a detailed strategy for customer acquisition, sales, and marketing is not provided. · Traction/Milestones: Beyond the financial projections on Slide 7 and the "EducatorOfTheYear2014" mention on Slide 2, there is no clear overview of past achievements, key performance indicators (KPIs), or significant milestones. · Investment Ask: Crucially, the available slides do not include an "ask" slide, which would specify the amount of funding sought, how it will be used, and what valuation is being targeted. · Financial Details (Clarity): While Slide 7 shows projections, the specific metrics for the pink and purple bars are not labeled, making it difficult to fully interpret the financial performance. The mention of "strong EBITDA" suggests one of the metrics is related to profitability, but it's not explicit. · Legal/IP Information: There is no mention of patents, trademarks, or other intellectual property. · Exit Strategy: No potential exit opportunities or strategies for investors are presented.
What a Founder Should Copy
Clear Vision (Slide 1, 3): Articulating a bold and inspiring vision early in the deck can capture investor attention. · Dedicated Team Slide (Slide 2): Providing a clear overview of the founding team, their roles, and relevant experience is essential. The use of concise descriptors (even hashtags) can be effective for quick comprehension. · Justifying Strategic Focus with Data (Slide 4): Using comparative data to explain why a particular market segment (e.g., B2B over B2C) is being prioritized is a strong approach. Quantifying the difference in unit economics helps investors understand the rationale. · Acknowledging Market Challenges (Slide 5): Demonstrating an understanding of the industry's inherent difficulties and then positioning the company as the solution can build confidence in the founders' expertise. · Transparency in Technology Stack (Slide 6): Clearly outlining the core technologies used shows that the company has a foundational infrastructure and often implies leveraging existing, scalable solutions rather than building everything from scratch. · Geographic Specificity (Slide 4, 7): Clearly defining the target regions for market analysis and financial projections provides necessary context for investors.
Frequently asked questions
- What is Welify.com's stated mission or ambition?
- Welify.com states its ambition as "Redefining e-commerce!" on Slide 1. On Slide 3, it further elaborates on its goal to become "the regulator of a multi-billion USD industry!" These statements frame the company's high-level objectives for its operations.
- Who are the key members of the Welify.com team presented in the deck?
- Slide 2 introduces three key members: Maes Kevin, listed as "Managing Master"; Sarah Gieghase, listed as "HR – Education Expert"; and Siva Ramalingam, listed as "Sales Specialist." The slide provides brief descriptions and hashtags for each individual's experience.
- What is Welify.com's target market and distribution strategy?
- Welify.com targets the BPC industry in Thailand and Indonesia, as indicated on Slide 7. Its distribution strategy, shown on Slide 3, involves multiple channels: B2B Online (Salons, Day Spas), B2B Direct (Resorts, Hotels, Corporations), Offline Stores (Beauty Stores, Beauty Departments), and Online Stores.
- How does Welify.com differentiate B2C and B2B unit economics?
- Slide 4 provides a direct comparison. For B2B, the Average Order Basket is 340 USD, Customer Acquisition Cost is 144 USD, and Customer Lifetime Value is 12+ Orders / Year. In contrast, B2C shows a 35 USD Average Order Basket, 10-15 USD Customer Acquisition Cost, and 2-3 Orders / Year Customer Lifetime Value.
- What technology stack does Welify.com use?
- According to Slide 6, Welify.com is powered by Magento and WordPress for "Processing." For "Fulfillment," the company utilizes Acommerce and NetSuite. This indicates a reliance on established e-commerce and enterprise resource planning platforms.