BoostUp’s pitch deck is a highly structured argument for the necessity of a new software layer in the enterprise stack. By contrasting the 'biased, late, half-truth' nature of manual CRM data against their automated, real-time extraction of digital data, they create an immediate sense of urgency. The deck successfully navigates the transition from a single-use tool to a comprehensive 'Enterprise Revenue Data Platform.' While it lacks specific financial metrics like MRR or churn, it compensates with a powerful traction slide showing 3X growth since January 1st, 2020, and a sophisticated TAM br…
Key takeaways
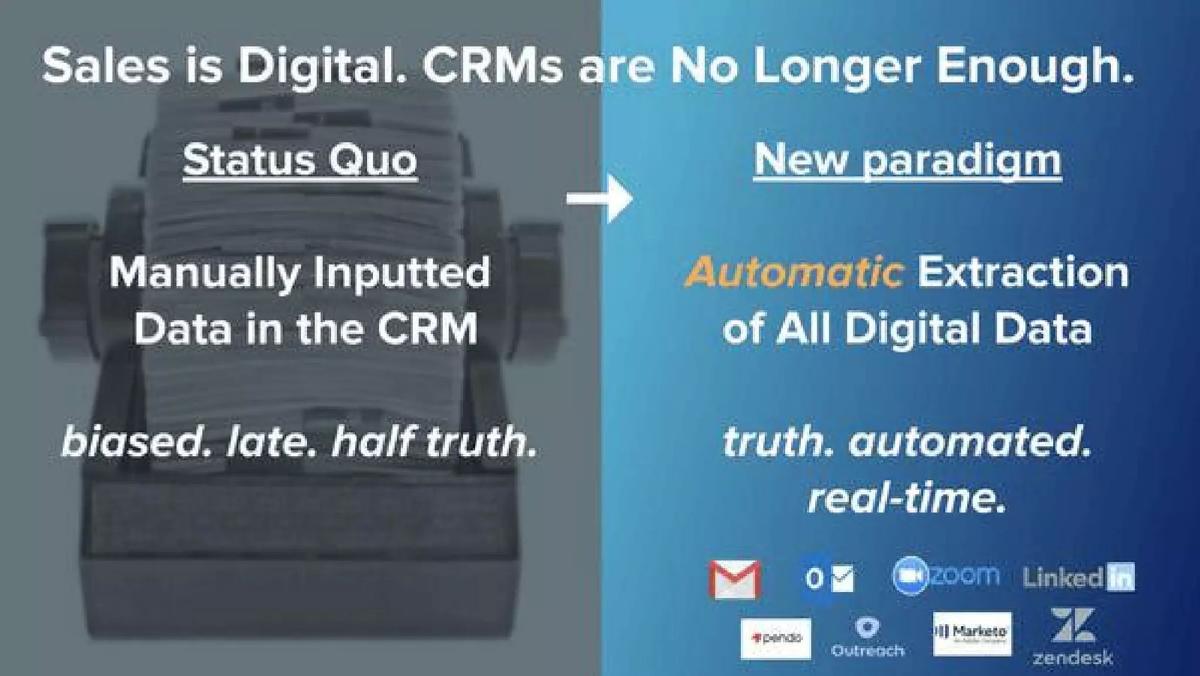
- The deck frames the problem as a paradigm shift from manual CRM entry to automatic extraction of digital data (Slide 2).
- BoostUp positions itself as an 'Analytical System of Record' that sits between engagement layers and transactional systems (Slide 9).
- The product is described as the 'First Remote Control Panel for Digital Sales,' highlighting specific risk signals like 'Weak relationship with IT' (Slide 10).
- Traction is demonstrated through a 3X growth claim since January 1st, 2020, supported by logos like NetApp and Iterable (Slide 14).
- The TAM is calculated at $6.6B, specifically targeting 38,000 B2B companies (Slide 15).
- Market segmentation is detailed, showing ACVs ranging from $75,000 for small teams to $1,000,000 for teams of 1000+ (Slide 15).
- The founding team highlights a 'Unique Consumer + Enterprise DNA' with backgrounds in search AI and large-scale data (Slide 16).
- The deck omits a specific 'Ask' slide, failing to mention the target raise amount or planned use of funds within the slides themselves.
The Narrative of the 'Analytical System of Record'
BoostUp’s Series B deck is a masterclass in category creation. Rather than fighting for space within the CRM market, they position themselves as a necessary evolution above it. The deck, totaling 16 slides, moves quickly from a macro-trend (the explosion of digital data) to a specific architectural solution. By the time the investor reaches the traction slide, the logic for a new 'Analytical System of Record' has been firmly established.
Slides 1-4: The Macro Shift and the Death of Manual Data
Slide 1 introduces the company as the 'First Contextual Revenue Intelligence Platform Powered by Unstructured Data.' The subtitle, 'Built for the Digital Sales Era,' sets the stage for a 'then vs. now' argument. Slide 2 is the most critical slide in the deck for establishing the 'Why Now.' It uses a visual of a Rolodex to represent the 'Status Quo' of manually inputted CRM data, which it labels as 'biased. late. half truth.' This is contrasted against the 'New paradigm' of automatic extraction, labeled as 'truth. automated. real-time.' This slide effectively attacks the reliability of the incumbent (Salesforce/Dynamics) without suggesting the user replace them, but rather augment them.
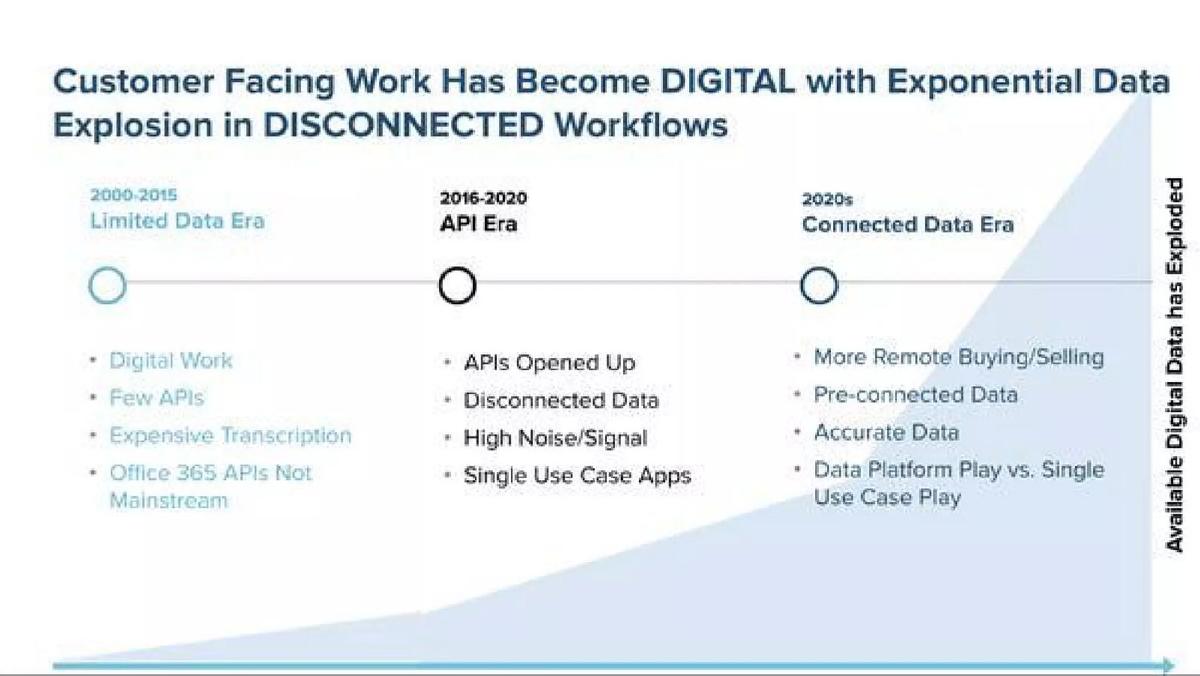
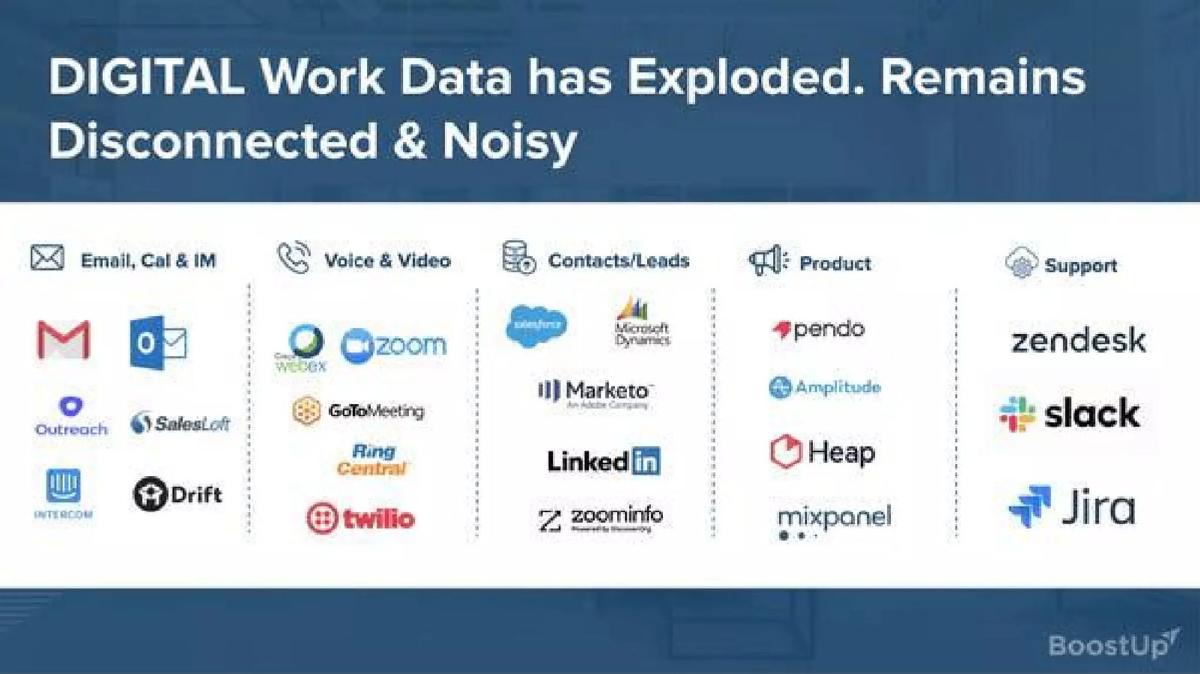
Slide 3 provides a historical timeline to justify the timing. It breaks the evolution into three eras: the 'Limited Data Era' (2000-2015), the 'API Era' (2016-2020), and the current 'Connected Data Era' (2020s). This framing suggests that BoostUp is the inevitable conclusion of technological progress. Slide 4 visualizes the 'Noisy' landscape, listing logos across Email, Voice/Video, Contacts, Product, and Support. It highlights the fragmentation that BoostUp intends to solve.
Slides 5-9: Defining the Architecture
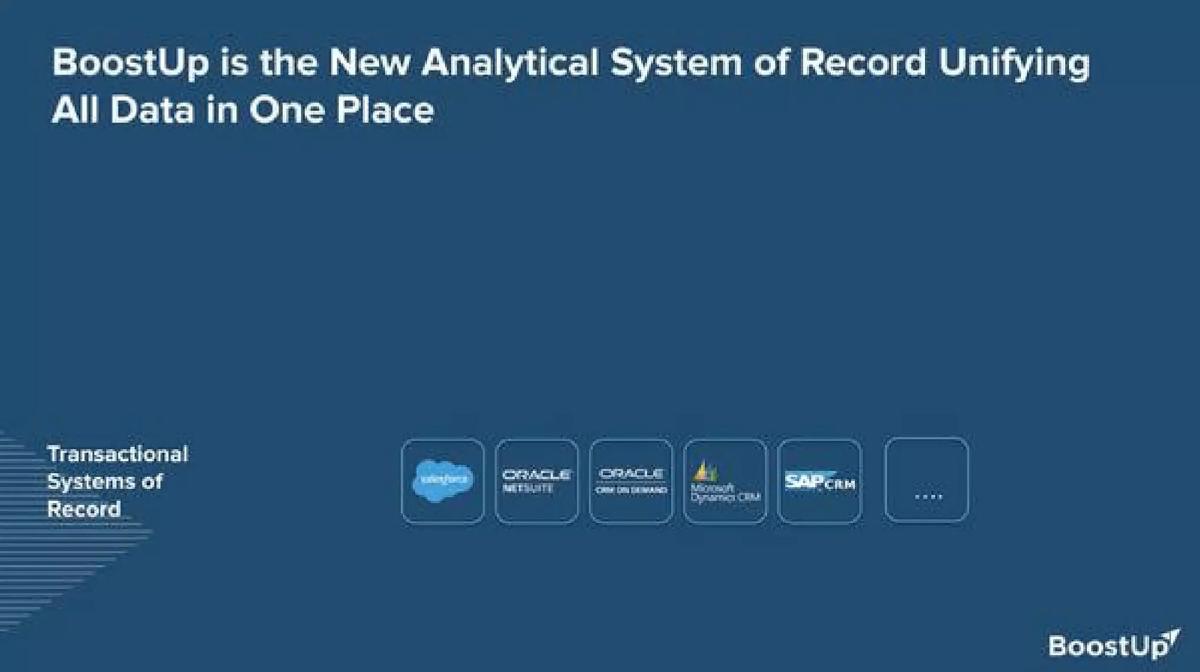
This sequence of slides (5 through 9) functions as a progressive build. The headline remains consistent: 'BoostUp is the New Analytical System of Record Unifying All Data in One Place.' Slide 6 shows the 'Transactional Systems of Record' (Salesforce, Oracle, SAP). Slide 7 adds the 'End User Engagement Layer' (Gmail, Zoom, Slack, LinkedIn). Slide 8 finally drops the 'BoostUp' block in the middle, acting as the connective tissue. This visual argument is powerful because it makes the product look like a structural necessity in a modern enterprise stack rather than just another app.
Slides 10-12: Product and Market Consolidation
Slide 10 moves into the UI, calling it the 'First Remote Control Panel for Digital Sales.' The slide uses callouts to show how the AI identifies specific risks, such as 'Recent Negative sentiment from the Decision Maker (CIO)' and 'Weak relationship with IT.' This moves the value prop from abstract 'intelligence' to concrete 'deal saving.' Slide 11 focuses on 'Forecasting AI,' showing waterfall charts and deal-by-deal changes. Slide 12 explains how BoostUp 'Consolidates Today’s Fragmented Revenue Intelligence Market,' listing four sub-categories: Forecast, Pipeline, Account, and Activity Intelligence. This is a strategic move to claim a larger share of the budget by replacing multiple point solutions.
Slides 13-16: Traction, TAM, and Team
Slide 13 lists the various CRO functions impacted, from QBRs to Annual Planning, broadening the internal user base. Slide 14 presents the traction: '3X Growth Since Jan 1st, 2020.' It features logos like NetApp, Branch, and Iterable. While '3X growth' is a relative metric, the quality of the logos for a Series B stage is high. Slide 15 breaks down the TAM. It estimates a total of 38,000 B2B companies representing a $6.6B opportunity. The table is highly specific, showing that they expect a $1,000,000 ACV from companies with 1000+ revenue reps. Slide 16 introduces the team, emphasizing their 'Unique Consumer + Enterprise DNA' with logos from Google, Yahoo, and VMware to back up their technical and commercial credibility.
What Works in the BoostUp Deck
The most successful element of this deck is its architectural positioning . By defining themselves as an 'Analytical System of Record' that sits between the engagement layer and the transactional layer, they avoid being categorized as a 'nice-to-have' tool. They make themselves the brain of the sales organization.
The TAM slide (Slide 15) is also exceptionally well-done. Many founders simply put a large number on a slide without justification. BoostUp breaks the market down by company size, count, and projected ACV. This level of granularity gives investors confidence that the founders understand their sales motion and their ceiling.
Finally, the problem-solution framing on Slide 2 is visceral. Every sales leader knows the pain of 'biased' and 'late' CRM data. By calling it a 'half truth,' BoostUp creates an emotional resonance with the buyer's (and investor's) frustration.
What is Missing from the BoostUp Deck
Despite raising $56.8 million, the deck has several notable omissions that are standard for a Series B pitch:
The Ask: There is no slide stating how much capital is being raised or the terms of the round. · Use of Funds: The deck does not explain how the new capital will be deployed (e.g., hiring, R&D, international expansion). · Unit Economics: There is no mention of CAC (Customer Acquisition Cost), LTV (Lifetime Value), or Net Revenue Retention (NRR). For a Series B, these metrics are usually mandatory. · Competitor Matrix: While they mention 'consolidating a fragmented market,' they do not name direct competitors like Gong or Clari, which were active in the space at the time. · Financial Projections: The deck shows past traction (3X growth) but does not provide a forward-looking roadmap for revenue targets over the next 3-5 years.
What Founders Should Copy
Founders should emulate the progressive build strategy used in Slides 5-9. If you are building a platform that integrates with other tools, don't just show a list of integrations. Show where your product sits in the hierarchy of the user's workflow. This helps investors visualize the 'stickiness' of the product.
The 'Era' framing on Slide 3 is another great tactic. By defining the history of your industry in 'Eras,' you can position your company as the leader of the current or upcoming era, making your competitors look like relics of the previous one.
Lastly, the specific risk callouts on Slide 10 are a great way to demonstrate product value. Instead of saying 'our AI finds risks,' show a screenshot of the AI saying exactly what the risk is. Specificity builds trust.
Frequently asked questions
- What is the core value proposition of BoostUp according to the deck?
- BoostUp positions itself as the 'First Contextual Revenue Intelligence Platform.' Its core value is automating the extraction of data from digital communication channels (email, calendar, Slack, Zoom) to provide a 'truthful' and real-time view of the sales pipeline, contrasting this with the 'biased' and 'half-truth' data manually entered into traditional CRMs.
- How does BoostUp define its market opportunity?
- The company identifies a $6.6 billion Total Addressable Market (TAM) consisting of 38,000 B2B companies. They segment this by revenue team size, projecting that companies with over 1,000 reps represent a $1.6 billion opportunity with an Annual Contract Value (ACV) of $1 million per customer.
- What specific product features are highlighted?
- The deck showcases a 'Remote Control Panel' that identifies deal risks, such as negative sentiment from decision-makers or budget objections. It also features 'Forecasting AI' that uses contextual data to track changes in deals closing within a specific quarter, providing a more granular view than standard CRM dashboards.
- Who are the key people behind BoostUp?
- The founding team includes Sharad Verma (CEO), previously of Yahoo and Bloomreach; Amit Sasturkar (CTO), a former search engineer at Google and Yahoo; and Neel Kamal (CCO), who held sales leadership roles at VMware and IBM. This mix is framed as 'Consumer + Enterprise DNA.'
- What is missing from this pitch deck?
- The deck is notably missing a slide detailing the specific 'Ask' (how much money they are raising) and the 'Use of Funds.' It also lacks a detailed competition slide, choosing instead to focus on how it 'consolidates' a fragmented market rather than naming direct competitors in the Revenue Intelligence space.