Branch’s Series C deck is an exercise in data-driven confidence. With only nine slides, it bypasses the traditional 'problem/solution' narrative to focus almost entirely on comparative performance. By January 2022, Branch was reporting a 1,934% year-over-year sales growth, a figure that dwarfed both legacy incumbents like Allstate (0.24% CMGR) and high-profile insurtechs like Lemonade (4.77% CMGR). The deck’s core strength lies in its transparency regarding LTV:CAC across different distribution channels—Embedded, Direct, and Agency—proving that their model scales efficiently. While it lacks a…
Key takeaways
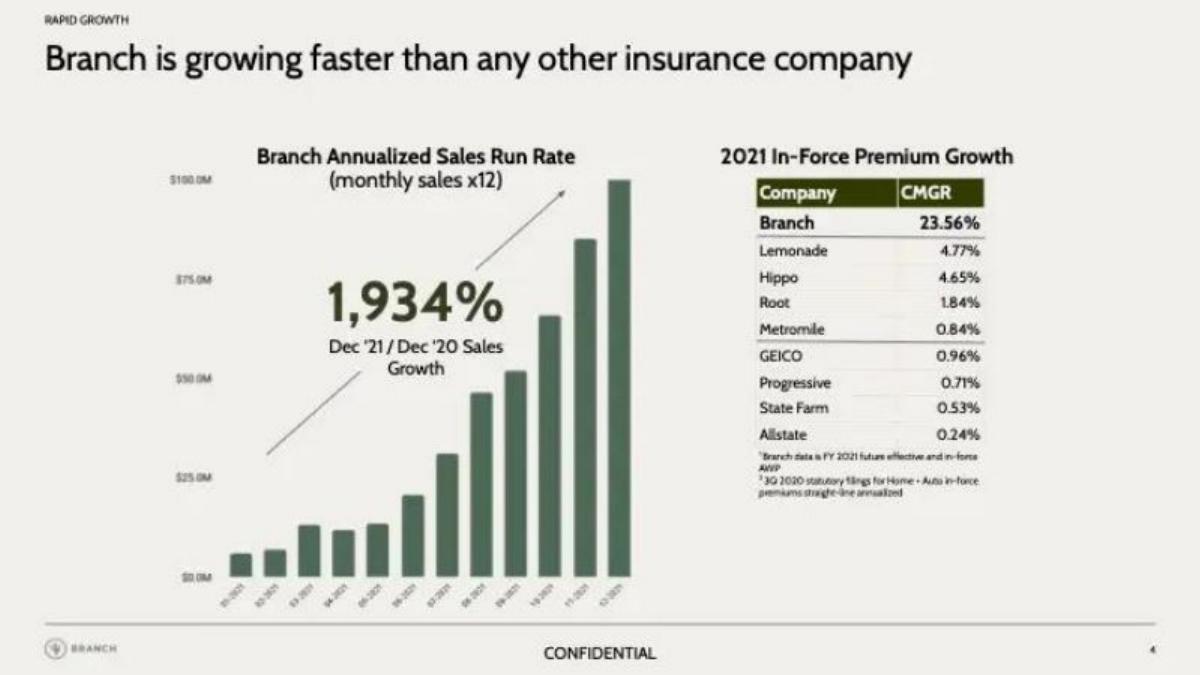
- The deck highlights a massive 1,934% sales growth between December 2020 and December 2021 on slide 4.
- Branch claims the highest CMGR in the industry at 23.56%, significantly higher than Lemonade's 4.77% as shown on slide 4.
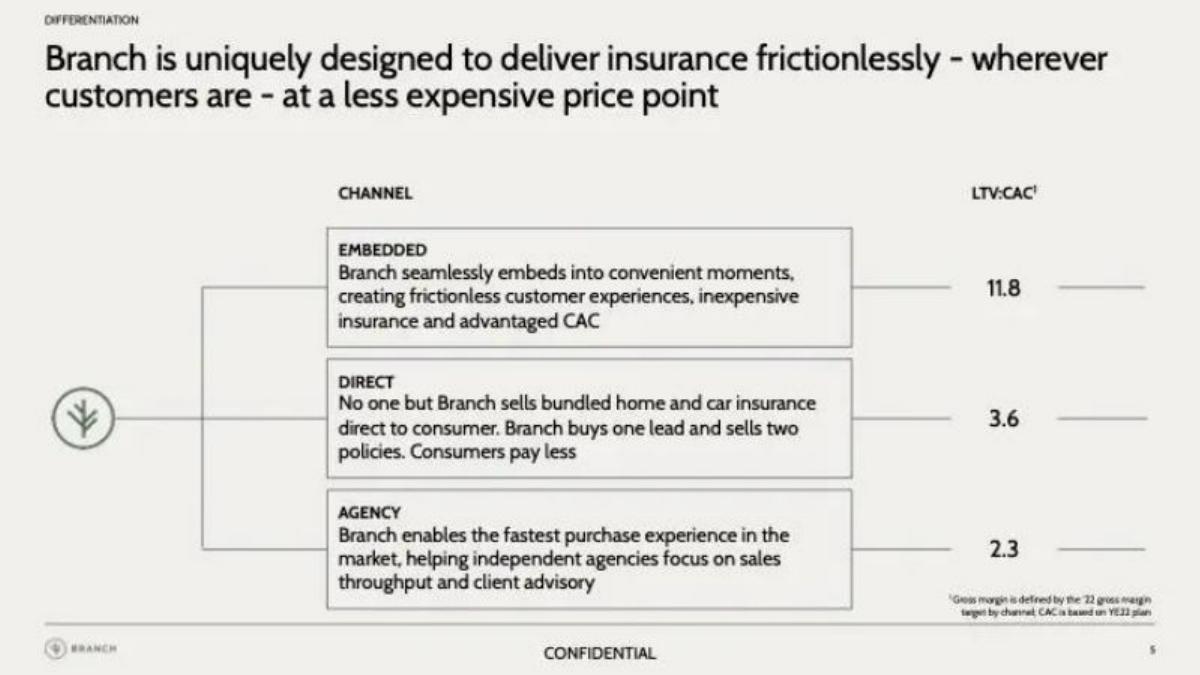
- The company utilizes a multi-channel distribution strategy with varying LTV:CAC ratios, peaking at 11.8 for embedded insurance on slide 5.
- Slide 3 identifies a $355 billion market for U.S. Home & Auto premiums as of 2020.
- Branch reports an account lifetime of 9.1 years, which is more than double that of Lemonade (4.3 years) and Root (2.4 years) on slide 8.
- The deck explicitly addresses 'Insurtech problems' like unsustainable loss ratios and overpaying for acquisition on slide 7.
- A bundle rate of 56% is cited on slide 8, compared to just 10% for Progressive and 8% for Lemonade.
- The presentation omits a team slide, a product roadmap, and a specific financial 'ask' or use-of-funds breakdown.
Executive Summary: The Efficiency Play
The Branch Series C pitch deck is a masterclass in late-stage fundraising through benchmarking. By 2022, the 'Insurtech' hype had begun to cool as public markets scrutinized the loss ratios and acquisition costs of first-generation players. Branch’s deck, titled "Built to win," addresses these concerns head-on by positioning the company not just as a fast grower, but as a structurally superior operator compared to both legacy giants and modern peers.
Slide 1: Title and Positioning
The cover slide is minimalist, featuring the tagline "Built to win" and the date "January, 2022." It uses clean, modern illustrations of a home and a car, reinforcing the company's focus on bundled insurance. The branding is subtle, letting the bold claim of the title set the tone for the data-heavy slides that follow.
Slide 2: The Core Thesis
Slide 2 serves as an executive summary in a single sentence. It defines Branch as the "fastest growing insurance company in the United States" and attributes this to four pillars: sophisticated underwriting, unique distribution, low CAC, and high lifetime customer value. This slide acts as a roadmap for the metrics presented in the rest of the deck.
Slide 3: Market Opportunity
Branch identifies its Total Addressable Market (TAM) with a single, massive figure: "$355b" in 2020 U.S. Home & Auto premiums. The slide argues that insurance is one of the last large industries "unmarked by technological innovation." By focusing on the combined home and auto market, Branch highlights the scale of the opportunity in bundling, which is central to their business model.
Slide 4: Hyper-Growth Metrics
This is the 'money slide' of the deck. It features a bar chart showing "Branch Annualized Sales Run Rate" with a staggering "1,934%" growth from December 2020 to December 2021. To the right, a table compares Branch’s 2021 In-Force Premium Growth (CMGR) against nine competitors. Branch sits at the top with 23.56% , while the next closest competitor, Lemonade, is at 4.77%. Legacy players like State Farm (0.53%) and Allstate (0.24%) are shown to be nearly stagnant in comparison. This slide effectively argues that Branch is not just growing; it is accelerating at a pace the industry has rarely seen.
Slide 5: Unit Economics and Distribution
Slide 5 provides a rare look into the efficiency of different insurance distribution channels. Branch breaks its LTV:CAC ratios down as follows:
Embedded: 11.8 (Frictionless experiences at the point of sale). · Direct: 3.6 (Selling bundled policies for the cost of one lead). · Agency: 2.3 (Enabling independent agencies with a fast purchase experience).
By showing an 11.8 ratio for embedded insurance, Branch proves it has found a highly scalable, low-cost acquisition engine that differentiates it from competitors who rely solely on expensive direct-to-consumer marketing.
Slide 6: Solving the Incumbent Problem
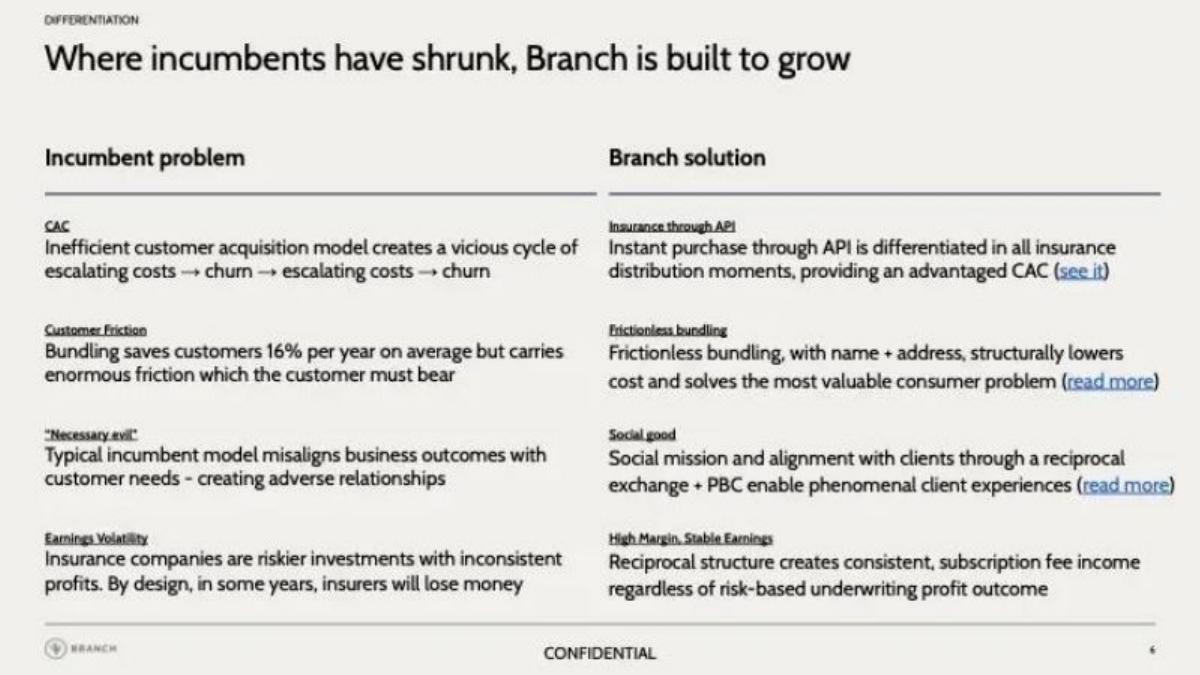
This slide uses a two-column format to contrast "Incumbent problems" with "Branch solutions." It identifies issues like inefficient CAC cycles, customer friction in bundling, and earnings volatility. Branch counters these with "Insurance through API," "Frictionless bundling" (requiring only name and address), and a "Reciprocal structure" that creates consistent subscription fee income regardless of underwriting outcomes. This positions Branch as a more stable, tech-forward investment than traditional insurers.
Slide 7: Differentiating from Failed Insurtechs
In a bold move, Slide 7 addresses why Branch will succeed where other insurtechs have struggled. It lists "Unsustainable loss ratios" and "Overpaying for acquisition" as the primary failures of the first wave of insurtech. Branch claims to solve these through "Underwriting expertise" and "Price by origination," where the product price varies based on the cost of acquisition for that specific channel. This level of granular pricing is presented as a key driver of their superior unit economics.
Slide 8: Retention and Bundling Superiority
The final data slide focuses on the long-term value of the customer. Branch shows a "Bundle rate" of 56% , which is more than five times higher than Progressive (10%) and Lemonade (8%). This bundling leads directly to the second chart: "Account lifetime in years." Branch claims an average account lifetime of 9.1 years , significantly outperforming Progressive (6.1), Lemonade (4.3), and Root (2.4). This slide is crucial for a Series C round, as it proves that the growth shown on Slide 4 is high-quality and sustainable.
Slide 9: External Reference
The final slide is a placeholder for the deck source, bestpitchdeck.com, and does not contain company-specific information. The actual deck concludes without a traditional 'Ask' slide or a 'Team' slide, which is common in highly competitive late-stage rounds where the data speaks for itself.
What Branch Does Well
The Branch deck is exceptionally effective at comparative benchmarking . Instead of stating their metrics in a vacuum, they constantly place themselves next to household names (Allstate, Progressive) and high-growth peers (Lemonade, Root). This provides immediate context for how impressive their 23.56% CMGR actually is. Furthermore, the transparency regarding LTV:CAC by channel on Slide 5 demonstrates a sophisticated understanding of their own unit economics, which is exactly what Series C investors look for to de-risk a large check.
What is Missing
The most glaring omission is a Team Slide . While the founders are well-known in the industry, a standard pitch deck usually highlights the leadership's pedigree. Also missing is a Product Roadmap ; the deck explains how they sell (API, Direct, Agency) but doesn't detail what new features or insurance lines are coming next. Finally, there is no Financial Ask or use-of-funds breakdown. While the catalogue facts state they raised $147M, the deck itself doesn't specify how much they were seeking or how they intended to spend it (e.g., geographic expansion vs. new product development).
What Founders Should Copy
Founders should emulate Branch’s "Problem/Solution" evolution . In early rounds, you define the problem for the consumer. In later rounds (Series B and C), you must define the problem with the industry's current business models . Slide 7 is a perfect example of this: it doesn't talk about customers needing insurance; it talks about why the business model of other insurtechs is broken and why Branch's model is the fix. Additionally, the use of specific, cited benchmarks (referencing 1Q21 Investor Calls and William Blair reports) adds a layer of institutional credibility that is vital for securing nine-figure rounds.
Final Verdict: This deck is a clinical, data-driven argument for market dominance. It ignores the fluff of 'vision' and 'mission' to focus on the cold, hard reality of acquisition costs and retention years, making it a perfect example of a late-stage growth deck.
Frequently asked questions
- What is Branch's primary competitive advantage according to the deck?
- Branch emphasizes its ability to bundle home and auto insurance frictionlessly. Slide 8 shows a 56% bundle rate, which is significantly higher than competitors. This bundling leads to higher retention (9.1 years) and better unit economics, as they can sell two policies for the cost of one lead in their direct channel.
- How does Branch's growth compare to other insurtech companies?
- According to slide 4, Branch's Compounded Monthly Growth Rate (CMGR) of 23.56% in 2021 far outpaced its peers. For comparison, the deck lists Lemonade at 4.77%, Hippo at 4.65%, and Root at 1.84% during the same period.
- What are the specific LTV:CAC ratios for Branch's distribution channels?
- Slide 5 breaks down unit economics by channel: Embedded insurance leads with an 11.8 LTV:CAC, followed by the Direct channel at 3.6, and the Agency channel at 2.3. This transparency demonstrates a diversified and efficient acquisition strategy.
- How does Branch address the common pitfalls of the insurtech industry?
- Slide 7 specifically contrasts 'Insurtech problems' with 'Branch solutions.' It addresses unsustainable loss ratios through underwriting expertise and claims that its vertically integrated, fixed-fee reciprocal structure prevents the expense complications that have hindered other startups.
- What is missing from this Series C pitch deck?
- The deck is notably brief for a Series C. It lacks a team slide, a detailed technology/product roadmap, a breakdown of the $147M ask, and a slide dedicated to the board of directors or existing investors. It relies almost entirely on growth and efficiency metrics.