Brandvee’s 14-slide deck from 2015 presents a solution to the 'death' of organic social reach through predictive analytics and chatbot-driven content promotion. The company positions itself against traditional analytics tools like Google Analytics and Chartbeat by claiming to track the 'viral effect' of traffic rather than just clicks. With a specific case study showing a 30% ROI increase for FourFourTwo and a clear financial roadmap projecting break-even by Q1 2016, the deck is a textbook example of a mid-2010s seed pitch. The ask is a modest £100,000 bridge round to reach their first enterp…
Key takeaways
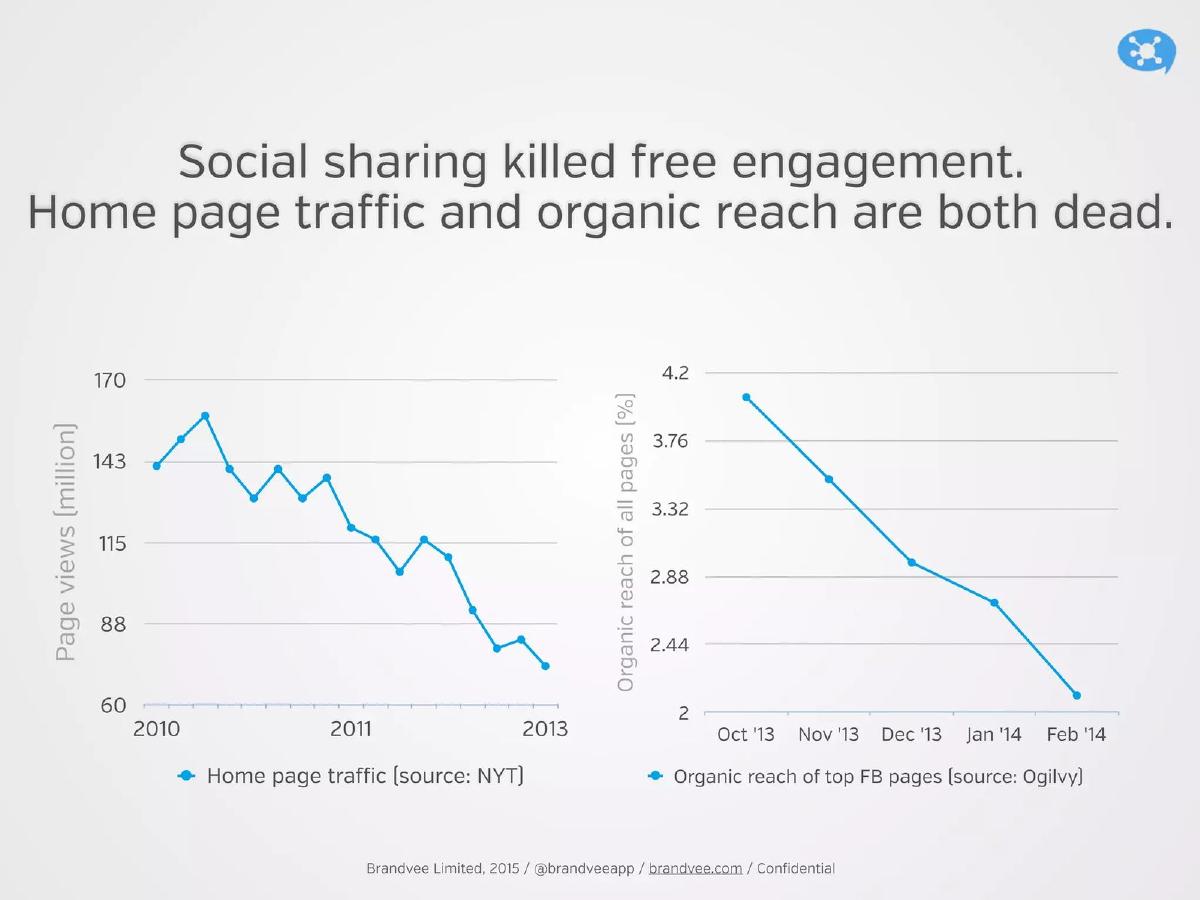
- The deck identifies a specific market shift: the decline of organic Facebook reach from over 4% to approximately 2% between late 2013 and early 2014 (Slide 2).
- Brandvee differentiates its 'new school' approach by mapping social sharing as a network tree rather than siloed platform metrics (Slide 7).
- The product utilizes a chatbot named 'Maya' to proactively notify users when content is ready for promotion, aiming for a low-friction workflow (Slide 8).
- A case study for FourFourTwo claims an 83% increase in shares and $3,000 in free viral traffic for every $10,000 spent (Slide 9).
- The team includes a 'Network Scientist' as an advisor, reinforcing the technical focus on viral mathematics (Slide 11).
- The deck lists high-profile 'upcoming' partnerships including BBC Worldwide, MasterCard, and Paramount, though the nature of these relationships is not detailed (Slide 12).
- Financial projections show a clear path to break-even in Q1 2016, supported by a £100k bridge round (Slide 13).
- The investment ask is explicitly stated as £100,000 in equity to fund the transition to enterprise sales (Slide 14).
Brandvee Seed Pitch Deck: The Breakdown
Brandvee’s 2015 pitch deck is a artifact of the era when 'organic reach is dead' became the rallying cry for social media marketing startups. The deck is structured to move quickly from a macro-problem (the decline of free traffic) to a specific technical solution (predictive viral analytics). With 14 slides, it maintains a lean narrative focused on a bridge round to reach enterprise scale.
Slide 1: Title and Hook
The deck opens with the tagline 'Turn content into an epidemic.' This choice of language ('epidemic') is a direct nod to the viral marketing trends of the mid-2010s. It identifies the company as Brandvee Limited and introduces David Szabo. The footer notes the deck is from 2015 and is confidential.
Slides 2-5: The Problem Space
Slide 2 is the most data-heavy of the problem section. It uses two charts to prove 'Home page traffic and organic reach are both dead.' The first chart, citing The New York Times, shows page views dropping from 170 million in 2010 to under 88 million in 2013. The second chart, citing Ogilvy, shows Facebook organic reach dropping from 4.2% in October 2013 to roughly 2% by February 2014. This creates immediate urgency.
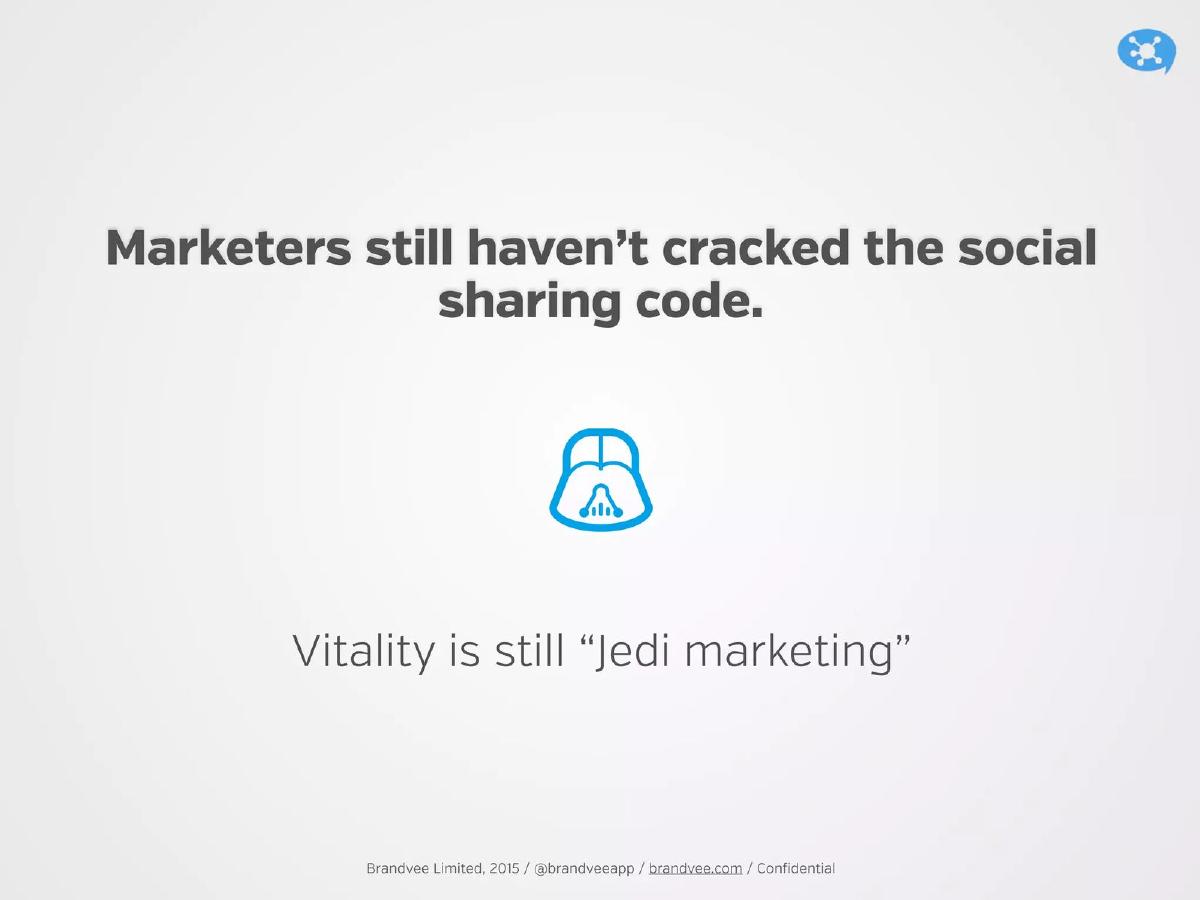
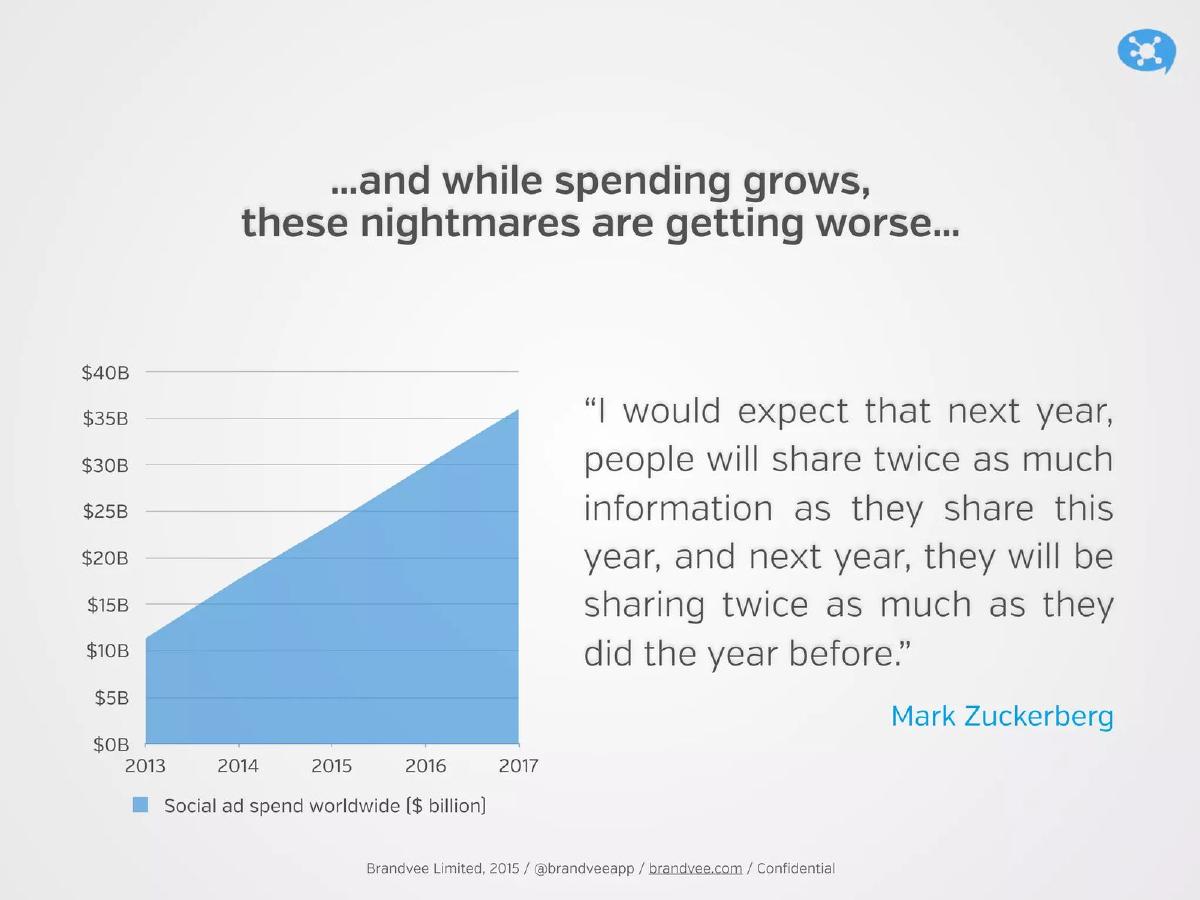
Slide 3 uses a Star Wars reference ('Vitality is still Jedi marketing') to suggest that most marketers are currently guessing rather than using science. Slide 4 and Slide 5 reinforce the scale of the problem, noting that social ad spend is projected to hit $35B by 2017 (Slide 5), yet the 'nightmares' for marketers are only getting worse as information sharing doubles annually, per a Mark Zuckerberg quote.
Slide 6: Competitive Landscape
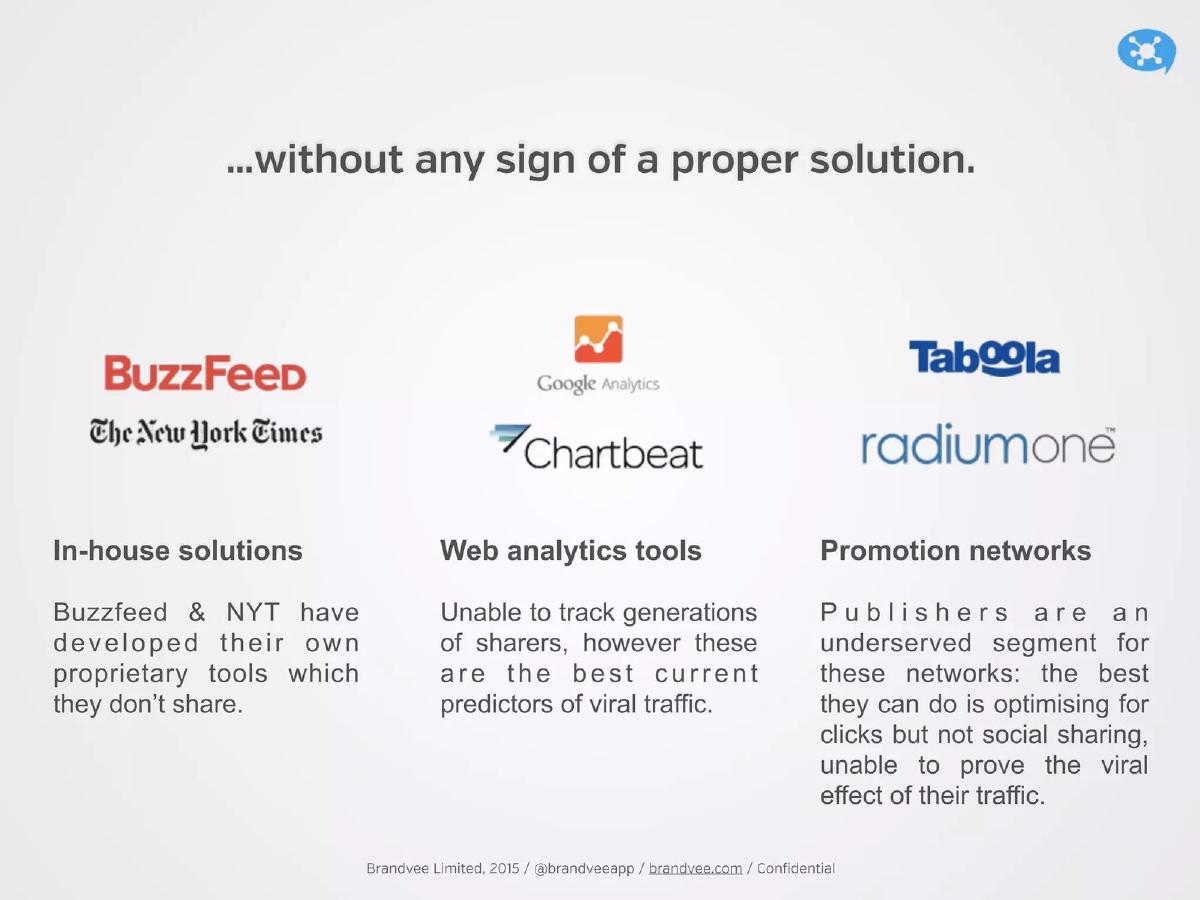
Brandvee categorizes the competition into three buckets: In-house solutions (Buzzfeed, NYT), Web analytics tools (Google Analytics, Chartbeat), and Promotion networks (Taboola, RadiumOne). Their critique is specific: in-house tools aren't shared, analytics tools can't track 'generations of sharers,' and promotion networks optimize for clicks rather than virality. This sets the stage for Brandvee to occupy the 'social intelligence' gap.
Slides 7-8: The Solution and Product
Slide 7 visualizes the 'New School' of social intelligence. Instead of looking at siloed bar charts of Facebook vs. Twitter clicks, Brandvee maps the sharing tree—showing how a share on one platform leads to a message on WhatsApp or Messenger. This is their core value proposition: mapping the hidden network effects.
Slide 8 introduces the product interface and 'Maya,' their chatbot. The workflow is automated: the bot tells you when to promote, the platform provides the insights, and the reports prove the ROI. By emphasizing a chatbot, they are pitching a 'low friction' user experience that doesn't require marketers to live in another dashboard.
Slide 9: Traction and Case Study
This is the 'proof' slide. Brandvee highlights a 30% increase in social ROI for the publication FourFourTwo. The slide claims that for every $10,000 spent, the client gets $3,000 in free traffic due to virality. They also note an 83% increase in shares. Crucially, a footnote specifies these gains are 'after deducting Brandvee’s costs,' which adds credibility to the ROI claim.
Slides 10-11: Unfair Advantages and Team
Slide 10 lists 'Proprietary technology,' 'No friction,' and 'Integration' as their advantages. While 'proprietary tech' is a common claim, the mention of 'network & data science' aligns with their earlier viral tree visualization. Slide 11 introduces the team. CEO David Szabo and CTO Zoltan Molnar are flanked by two team members and three advisors. The inclusion of Gyorgy Sagi, a 'Network Scientist,' is a strategic move to validate the technical claims made on Slide 7.
Slides 12-14: The Roadmap and Ask
Slide 12 displays logos for 'Upcoming partnerships & campaigns,' including BBC Worldwide, MasterCard, and Esso. While impressive, the deck does not specify if these are signed contracts, pilots, or merely targets. Slide 13 provides a detailed 'Milestones & financials' chart. It shows the history of investment from Collider (£50k then £100k) and projects ARR growth alongside cash in bank. The chart predicts breaking even in Q1 2016. Slide 14 concludes with the ask: £100,000 in equity. It provides direct contact information for the CEO and a dedicated investor URL.
What Brandvee Does Well
Specific Problem Definition: By using third-party data from NYT and Ogilvy to show the decline of organic reach, they ground the pitch in a pain point that every marketer in 2015 felt deeply. · Clear ROI: The FourFourTwo case study on Slide 9 is excellent. It doesn't just say 'engagement went up'; it attaches a dollar value ($3,000 of free traffic) to the viral lift. · Financial Transparency: Slide 13 is a rarity for seed decks. It shows the 'Cash in bank' vs. 'ARR' over time, giving investors a clear view of the runway and the expected impact of the bridge round.
What is Missing from the Deck
Business Model Details: While the deck mentions 'Brandvee's costs' in a footnote, it never explicitly states the pricing model. Is it a SaaS subscription, a percentage of ad spend, or a per-promotion fee? · Partnership Clarity: Slide 12 is a 'logo soup' slide. Without context on what an 'upcoming partnership' means, investors might view this as aspirational rather than tactical. · Market Size (TAM): The deck mentions social ad spend is $35B, but it doesn't define the specific addressable market for a social intelligence tool.
Founder Takeaways: What to Copy
The 'Old School vs. New School' Slide: Slide 7 is a masterclass in visual differentiation. It takes a complex technical concept (network graph theory) and makes it immediately understandable by comparing it to the standard bar charts everyone is tired of seeing. · The Bridge Round Context: If you are raising a bridge round, follow Slide 13’s lead. Show exactly where the previous money went (Beta tests, sales start) and exactly what the new money will achieve (First enterprise client, break even). · The Proactive Product: Pitching a 'chatbot' as a way to reduce friction (Slide 8) was ahead of its time in 2015. If your tool automates a task, emphasize how it fits into the user's existing workflow rather than forcing them to learn a new dashboard.
Frequently asked questions
- What problem is Brandvee solving?
- Brandvee addresses the 'death' of organic reach and home page traffic. According to Slide 2, organic reach on Facebook plummeted significantly in 2014, making content promotion a 'nightmare' for marketers. They argue that current tools like Google Analytics track clicks but fail to track the 'viral effect' or generations of sharers, leaving marketers unable to predict which content will actually go viral.
- How does the Brandvee product actually work?
- The product relies on a three-step predictive process shown on Slide 8. First, a chatbot named Maya alerts the user when a piece of content is ripe for promotion. Second, the user can access deeper insights through an online platform. Third, the system generates performance reports that serve as sales tools by proving the virality and influence of the promoted content.
- What are the key metrics mentioned in the deck?
- The primary success metric is a 30% increase in social ROI for their client FourFourTwo. Slide 9 also notes an 83% increase in shares on promoted content. Financially, the deck projects reaching an Annual Recurring Revenue (ARR) of approximately £438k by Q2 2016, coinciding with hiring more developers and sales staff.
- Who is behind the company?
- The company was founded by David Szabo (CEO) and Zoltan Molnar (CTO). Szabo has a background in sales, product, and data science, while Molnar focuses on tech architecture and applied mathematics. The team is supported by advisors from Haymarket and a 'Network Scientist,' Gyorgy Sagi, which aligns with their focus on viral mapping (Slide 11).
- What is the specific investment ask?
- Brandvee is seeking £100,000 in equity investment. Slide 13 labels this as a 'bridge round' intended to carry the company through the end of their beta tests and the acquisition of their first enterprise client. This follows previous investments from Collider totaling £150,000 (£50k initial and £100k follow-on).