Incentify’s 10-slide deck is a highly focused narrative on the inefficiency of the Credits & Incentives (C&I) market. By framing C&I as a neglected asset class rather than a back-office tax function, the company successfully raised $4.3 million. The deck relies on a proprietary 'Golden Ratio' metric to demonstrate value, claiming that optimized systems can yield a 25% return on CapEx. While the deck is visually polished and data-heavy regarding market opportunity, it notably lacks a team slide, a specific financial ask, and a detailed competitive landscape. It functions more as a high-level v…
Key takeaways
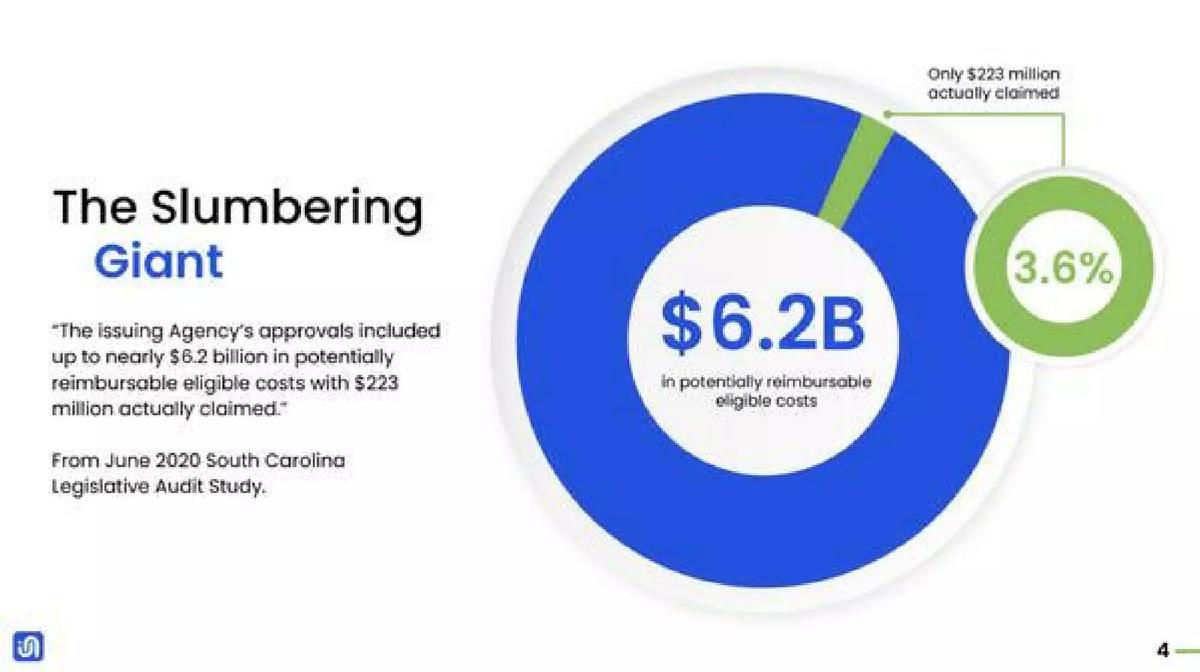
- The deck claims a massive market inefficiency, citing a South Carolina study where only $223 million was claimed out of $6.2 billion in eligible costs on slide 4.
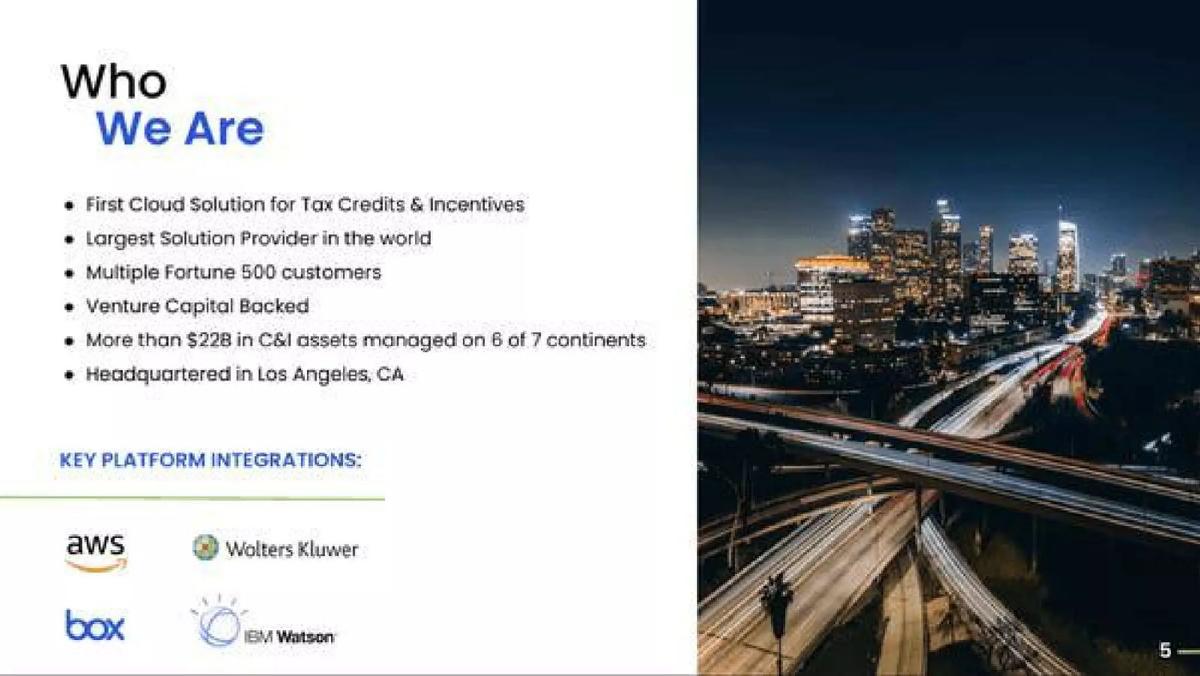
- Incentify positions itself as the first cloud solution for tax credits and incentives, managing $22B+ in assets across 6 continents as stated on slide 5.
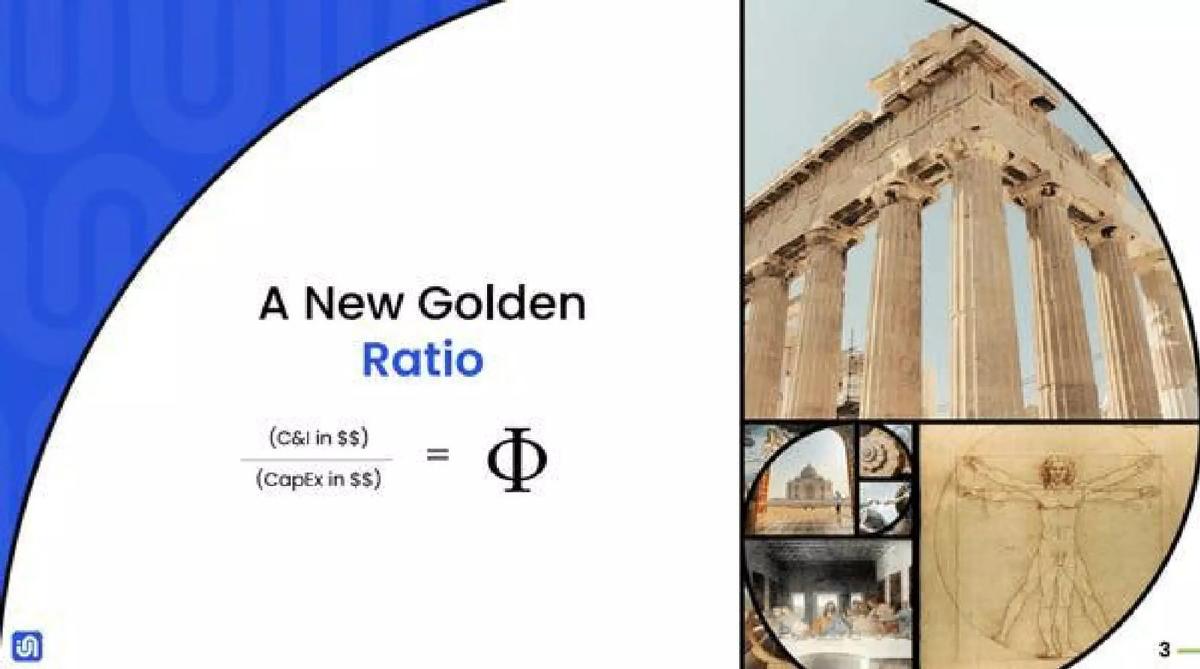
- The company introduces a 'Golden Ratio' (C&I divided by CapEx) to quantify the maturity of a firm's incentive management on slide 3 and slide 9.
- Value drivers are meticulously broken down on slide 8, showing a total benefit of $6.5 million for a client with $100 million in C&I.
- The platform highlights integrations with major enterprise players including AWS, Wolters Kluwer, Box, and IBM Watson on slide 5.
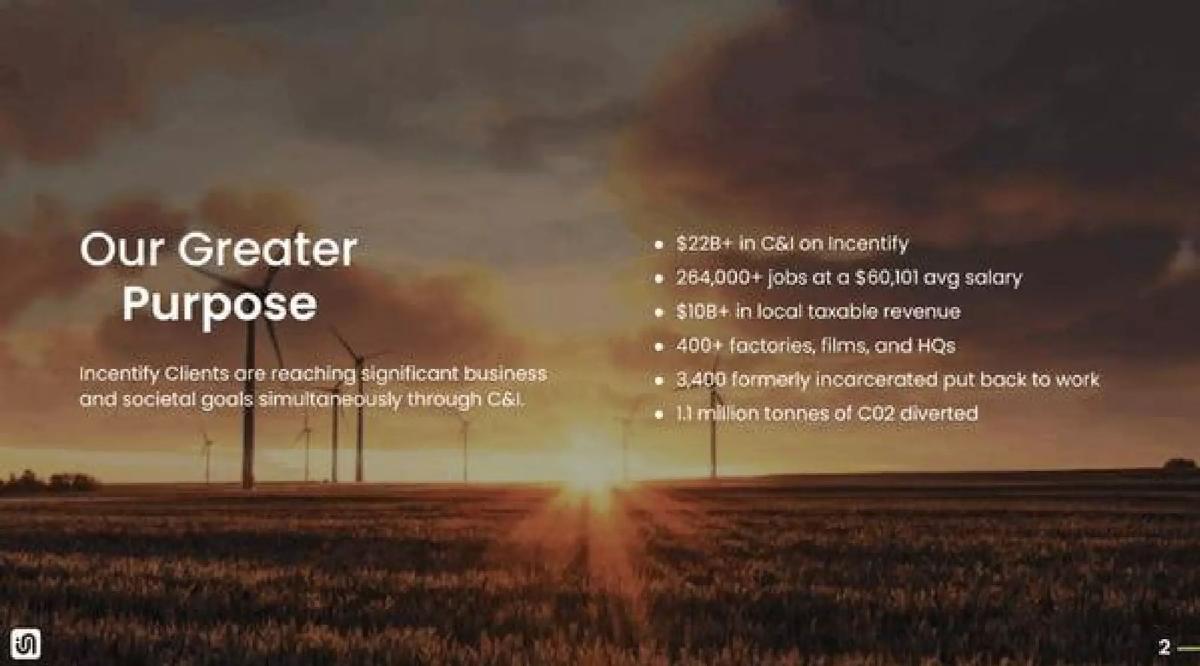
- Societal impact is used as a secondary hook, noting 264,000+ jobs supported and 1.1 million tonnes of CO2 diverted on slide 2.
- The deck completely omits a team slide, leaving the founders' backgrounds and expertise to be inferred or discussed elsewhere.
- There is no explicit 'Ask' or use of funds slide, which is unconventional for a fundraising deck.
Executive Summary: The Assetization of Tax Credits
Incentify’s pitch deck is a focused, 10-slide presentation that successfully raised $4.3 million in 2019. The core thesis of the deck is that Credits & Incentives (C&I) represent a massive, mismanaged asset class. Rather than focusing on the minutiae of tax law, the deck focuses on the financial outcomes of centralization and optimization. It uses a clean, corporate aesthetic and relies heavily on large-scale figures to establish authority.
Slides 1-2: The Hook and the Purpose
Slide 1 introduces the company as "The World’s Most Powerful Tax Credit & Incentive Platform." It is a standard title slide with a high-contrast city background, signaling an enterprise-grade focus. Slide 2, titled "Our Greater Purpose," attempts to align the company with ESG (Environmental, Social, and Governance) trends. It lists impressive aggregate metrics: $22B+ in C&I on the platform, 264,000+ jobs supported, and 1.1 million tonnes of CO2 diverted. This slide serves to show the scale of the platform's impact before diving into the mechanics of the business.
Slides 3-4: Defining the Problem and the Metric
Slide 3 introduces a conceptual framework called "A New Golden Ratio," defined as C&I in dollars divided by CapEx in dollars. By using the Greek letter Phi, the company attempts to elevate a business metric to a fundamental principle of financial health. Slide 4, "The Slumbering Giant," provides the data to back up the need for this ratio. It cites a South Carolina Legislative Audit Study showing that only 3.6% of eligible costs ($223 million of $6.2 billion) were claimed. This is a powerful use of a third-party data point to prove that the current manual system is failing.
Slide 5: Traction and Integration
Slide 5, "Who We Are," is the primary traction slide. It makes several bold claims: being the "First Cloud Solution" for this space and the "Largest Solution Provider in the world." The slide notes they manage assets on 6 of 7 continents and have multiple Fortune 500 customers. Crucially, it lists integrations with AWS, Wolters Kluwer, Box, and IBM Watson. These logos provide the technical validation necessary for an enterprise SaaS product, suggesting that Incentify is not a siloed tool but a connected part of the corporate ecosystem.
Slides 6-7: The Challenge and the Solution
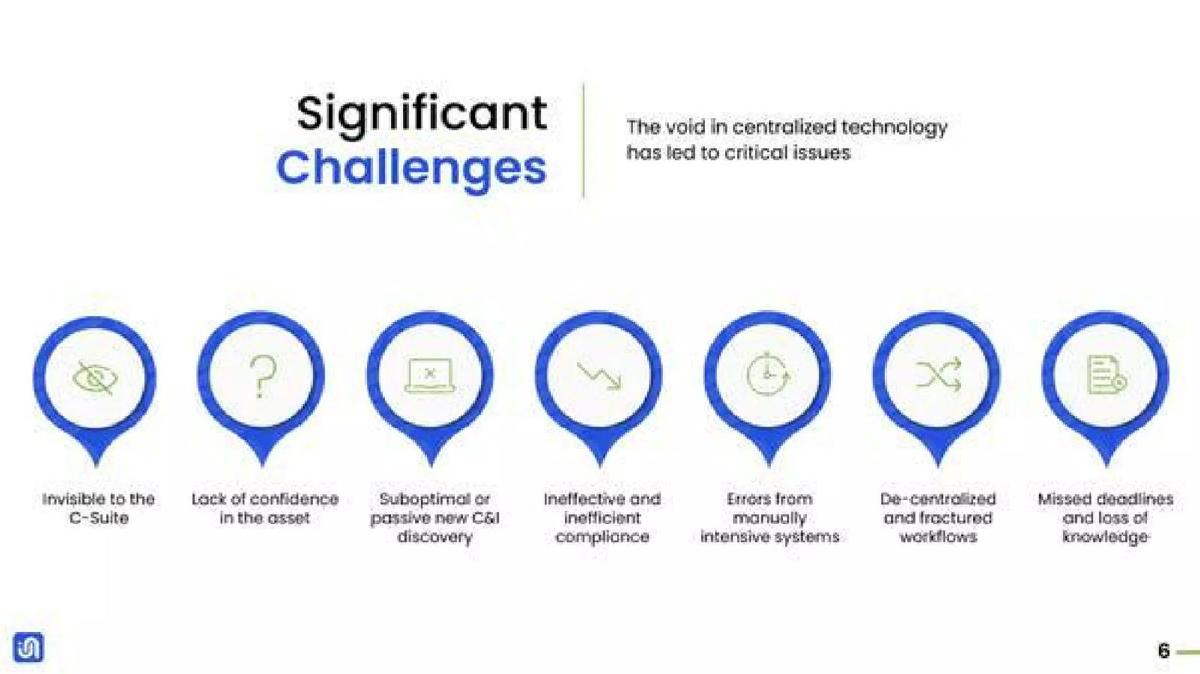
Slide 6 outlines "Significant Challenges" using seven icons. These include invisibility to the C-Suite, lack of confidence in the asset, and errors from manually intensive systems. It frames the problem as a "void in centralized technology." Slide 7 presents the Incentify solution through five pillars: Discovery, Centralization & Standardization, Workflow & Compliance, Team Collaboration, and Analytics & Reporting. This slide is the most descriptive regarding what the software actually does, moving from the 'why' to the 'how.'
Slides 8-9: Quantifying the ROI
Slide 8 is perhaps the most important slide for a CFO or an investor. It breaks down the "Key Value Drivers" for a hypothetical $100M C&I portfolio, showing a total benefit of $6.5 million. The largest chunk of this value ($2.3M) comes from reducing compliance errors like forfeiture and clawbacks. Slide 9 returns to the "Golden Ratio," showing a five-phase maturity model. It suggests that moving from a "Passive and externally driven" state (Phase 1) to an "Optimized single system" (Phase 5) can increase the C&I-to-CapEx ratio from under 10% to over 25%.
Slide 10: The Demo
The final slide is a simple "Incentify Demo" page featuring several screenshots of the platform. The screenshots show dashboards, maps of global incentives, and workflow timelines. This serves as proof of product, showing that the platform is built and functional, rather than just a conceptual framework.
What Works in the Incentify Deck
Quantification of Value: The deck does an excellent job of turning a vague administrative task into a hard financial metric. By creating the "Golden Ratio," Incentify gives investors a way to measure the success of the platform that feels objective and scalable. The breakdown of the $6.5M benefit on slide 8 is a masterclass in justifying enterprise software costs.
Scale and Authority: Stating that they manage $22B+ in assets on slide 5 immediately removes the "startup risk" in the eyes of an investor. It positions the company as a market leader rather than a newcomer, even if they are still in a growth stage.
Third-Party Validation: Using a government audit study on slide 4 to prove the market gap is much more effective than the company making the claim themselves. It provides a specific, verifiable example of the "slumbering giant" problem they are solving.
What is Missing from the Incentify Deck
The Team: There is no mention of the founders or the leadership team. In venture capital, the 'who' is often as important as the 'what.' The omission of a team slide is a significant gap, as it leaves investors wondering if the founders have the tax, legal, or software expertise required to navigate this complex industry.
Competitive Landscape: The deck claims to be the "Largest Solution Provider," but it doesn't mention who the other providers are. Investors want to know how Incentify compares to the Big Four accounting firms or other niche tax software players. Ignoring competition can sometimes signal a lack of market awareness.
The Ask and Financials: There is no slide detailing how much money is being raised, what the valuation expectations are, or how the funds will be spent. While this information is often handled in a separate document or conversation, its absence makes the deck feel more like a sales presentation than a fundraising tool.
What Founders Should Copy
The Maturity Model: Founders in complex enterprise spaces should copy the "Phase 1 to Phase 5" maturity model found on slide 9. It helps a potential customer or investor visualize the journey from their current "broken" state to a "future-proofed" state, making the purchase feel like an evolution rather than just a tool acquisition.
The ROI Waterfall: Slide 8's breakdown of value drivers is a great way to handle the "it's too expensive" objection. By showing exactly where the savings and gains come from (compliance, slippage, monetization), you make the ROI feel inevitable.
Focus on a Single Metric: Incentify’s obsession with the C&I/CapEx ratio is a smart way to own a category. Founders should try to identify or create a single, proprietary metric that their product optimizes, and then build the entire narrative around that metric.
Final Thoughts
Incentify’s deck is a highly professional, data-driven argument for the modernization of tax incentive management. It succeeds by framing a boring back-office function as a high-stakes financial asset. While it lacks the personal touch of a team slide and the transparency of a financial ask, the sheer weight of the $22 billion in managed assets and the clear ROI calculations likely provided enough momentum to secure their $4.3 million round. It is a prime example of how to sell to the C-suite by speaking the language of ratios and returns.
Frequently asked questions
- How does Incentify define its market opportunity?
- Incentify defines the market by the gap between eligible and claimed incentives. On slide 4, they use a South Carolina Legislative Audit Study to show that only 3.6% of potentially reimbursable costs ($223 million out of $6.2 billion) were actually claimed. This 'Slumbering Giant' narrative suggests that the majority of the market is currently unserved due to manual processes and lack of visibility.
- What is the 'Golden Ratio' mentioned in the deck?
- The 'Golden Ratio' is Incentify's proprietary framework for measuring the effectiveness of a company's tax credit strategy. It is calculated as the value of C&I divided by Capital Expenditure (CapEx). Slide 9 illustrates a maturity curve where 'Phase 1' companies achieve 0-10%, while 'Industry Leaders' in 'Phase 5' achieve 25% or more by using optimized, integrated systems.
- What specific value does the platform provide to a $100M C&I portfolio?
- Slide 8 provides a waterfall chart showing a $6.5 million total benefit. This is broken down into reducing compliance errors ($2.3M), reducing slippage ($1.69M), increasing monetization ($1.235M), continuity protection ($715K), and new incentive discovery ($512K). This quantification helps move the conversation from 'software cost' to 'ROI generator.'
- Who are Incentify's key partners and customers?
- While specific customer names are not listed to maintain anonymity, slide 5 states they have 'Multiple Fortune 500 customers.' The deck also highlights key platform integrations with AWS, Wolters Kluwer, Box, and IBM Watson, suggesting the software is designed to sit within a pre-existing enterprise tech stack.
- What is missing from this pitch deck that investors usually expect?
- The deck is missing several standard components: a team slide (crucial for early-stage trust), a competitor analysis (to show how they beat incumbents or manual consultants), a business model/pricing slide, and a clear financial ask. The absence of these suggests this deck may have been used as a teaser or alongside a more detailed data room.