EPC Tracker targets the massive inefficiencies in the Engineering, Procurement, and Construction (EPC) sector, specifically addressing the 'disparity of criteria' and 'manual paper-based processes' that plague large-scale projects (Slide 3). The deck utilizes a clear ROI calculation, suggesting that saving just one hour per day for 150 workers at 60 euros/hour results in a 3,285,000 euro annual productivity gain (Slide 7). While the deck excels at visualizing the communication flow between site supervisors, department chiefs, and managers (Slide 6), it relies heavily on visual mockups and lac…
Key takeaways
- The company identifies manual, paper-based processes as the primary friction point in construction management (Slide 3).
- EPC Tracker uses a specific ROI formula to quantify productivity: 150 workers x 365 days x 1 hour/day x 60 euros/hour = 3,285,000 euros (Slide 7).
- The product architecture supports three distinct user tiers: Supervisor, Chief of Department, and Site Manager (Slide 6).
- The platform is cross-device, featuring both a mobile app for field use and a web-based dashboard for office-based management (Slide 5).
- Competitive positioning uses a 'Blue Ocean Strategy' framework, contrasting EPC Tracker against incumbents like Primavera de Oracle and Microsoft Project (Slide 8).
- The deck includes a screenshot showing a real-world project example involving Iberdrola Renovables (Slide 9).
- The core value proposition focuses on keeping 'Projects always on track' through real-time activity and incident listing (Slide 1, Slide 5).
- There is a total absence of a team slide, financial history, or a specific funding request in the provided materials.
EPC Tracker: A Visual Journey Through Construction Digitization
The EPC Tracker deck, titled 'Investor info english 10 09 2013' in its source listing, is a 52-slide presentation that focuses heavily on the operational mechanics of the construction industry. While the full deck is extensive, the selected slides provide a clear window into the company's attempt to modernize the Engineering, Procurement, and Construction (EPC) workflow. The deck is characterized by a transition from identifying manual inefficiencies to presenting a digital, cross-platform solution with a quantified ROI.
Slide 1: Title and Branding
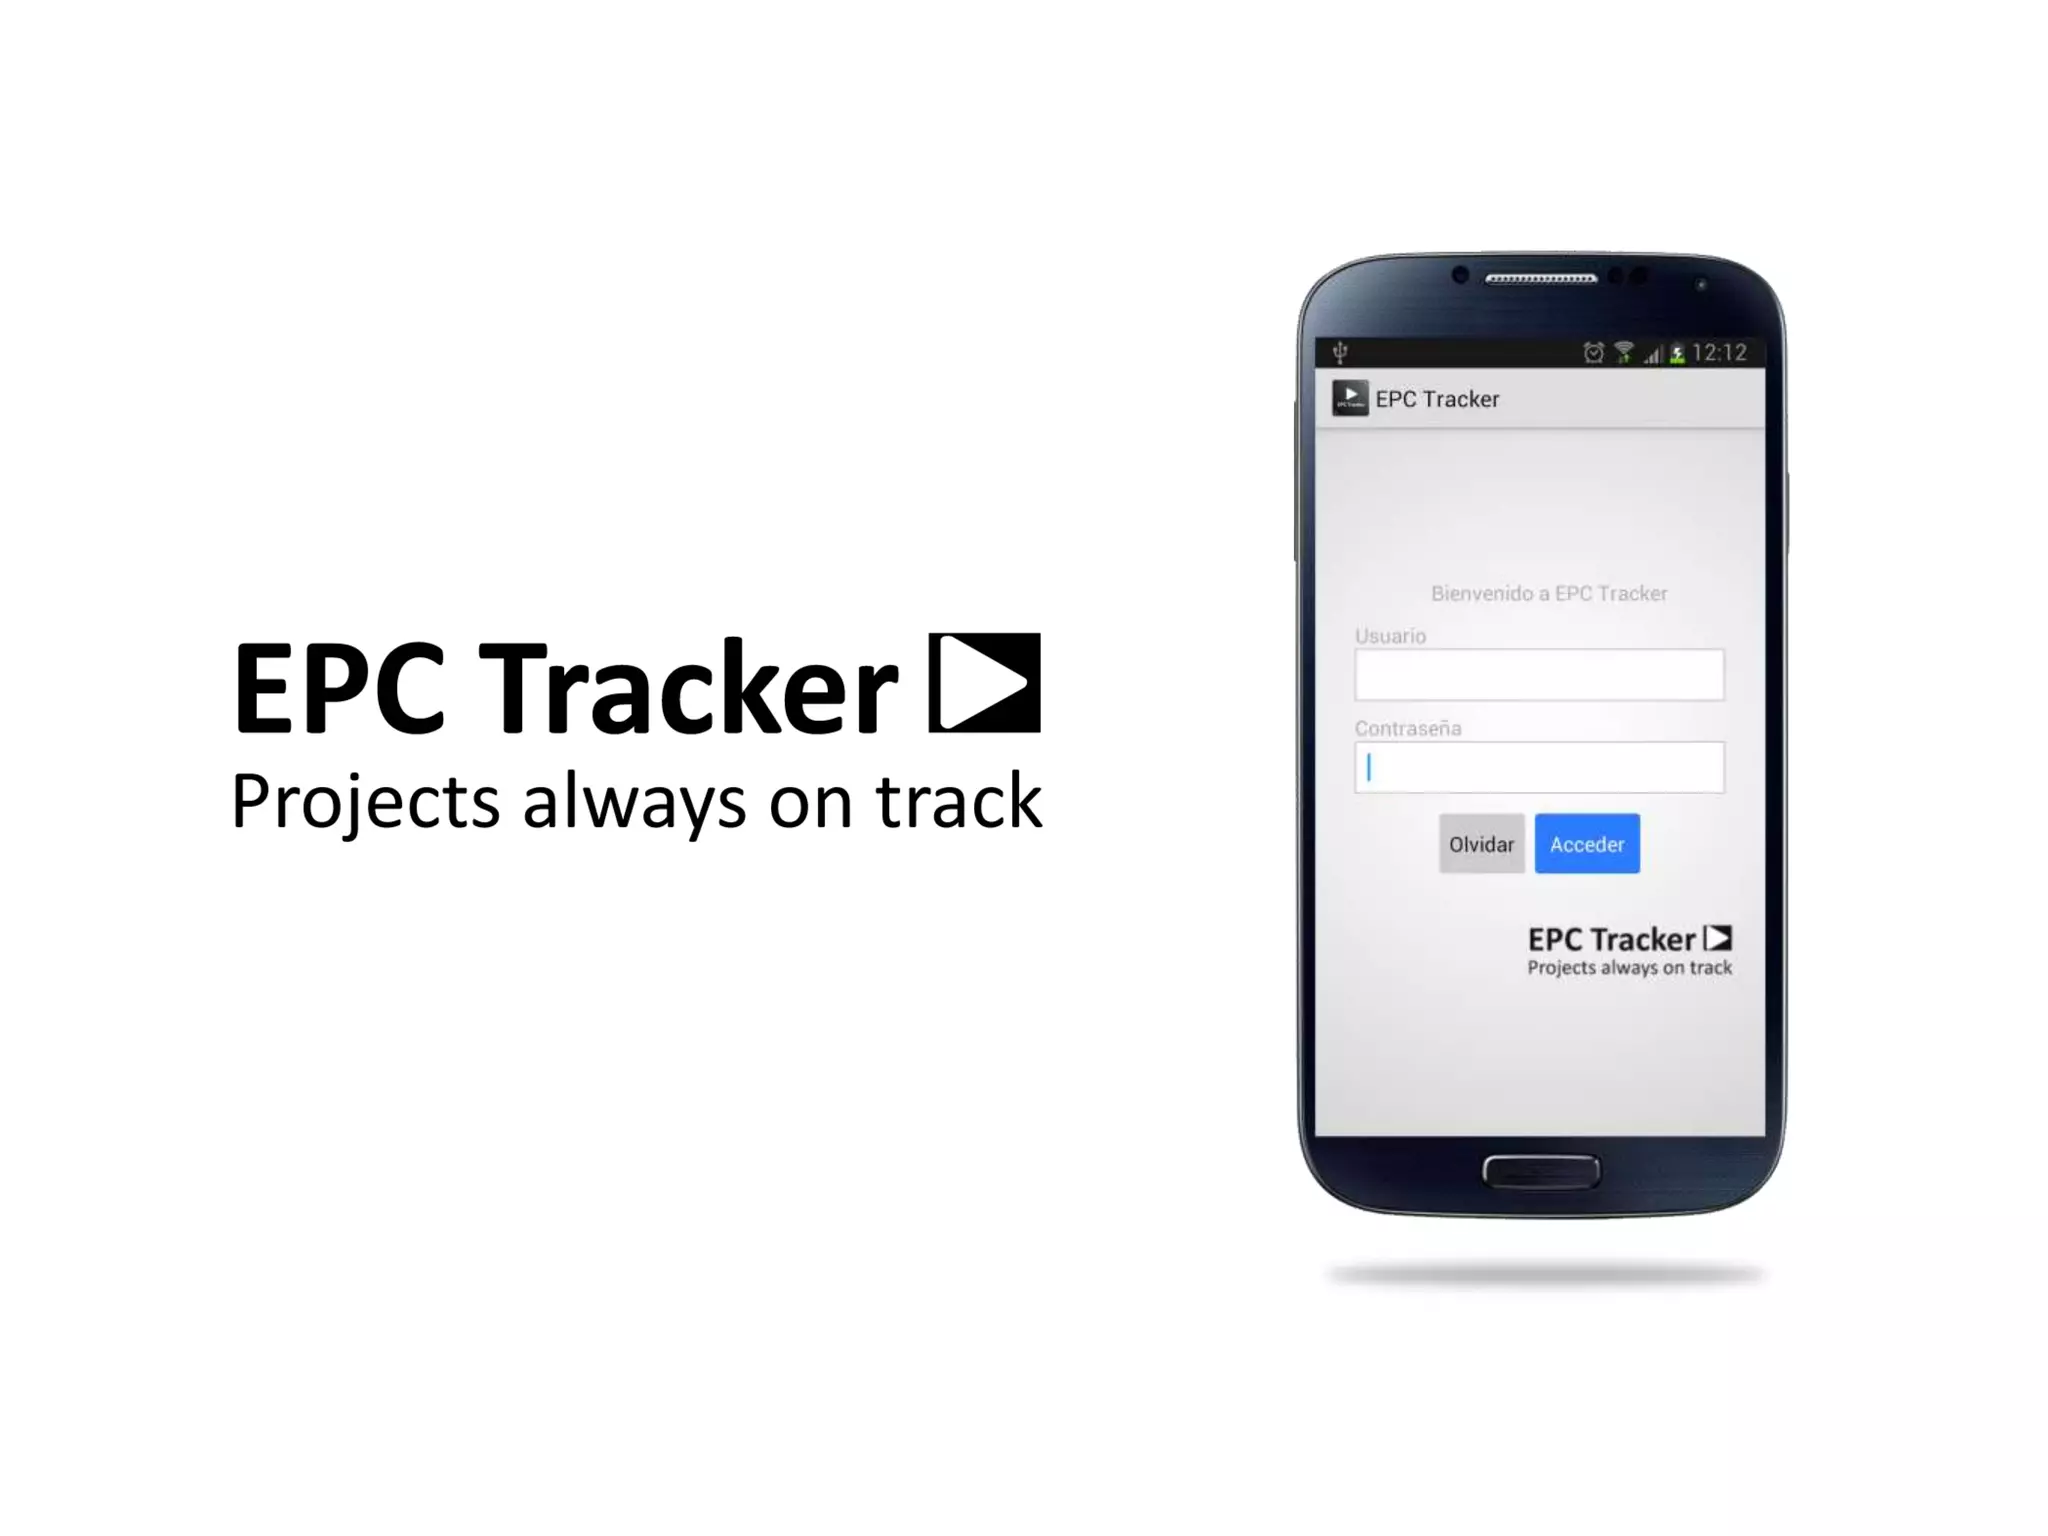
The opening slide introduces the company name, EPC Tracker , accompanied by the tagline "Projects always on track." The visual focus is a smartphone mockup (a Samsung Galaxy S4 era device) showing a login screen with fields for 'Usuario' (User) and 'Contraseña' (Password), and buttons for 'Olvidar' (Forgot) and 'Acceder' (Login). This immediately signals that the product is a mobile-first application intended for field use.
Slide 2: The EPC Lifecycle
Slide 2 illustrates the interconnected nature of the industry. It features three primary headers: ENGINEERING , PROCUREMENT , and CONSTRUCTION . Below these, a circular flow diagram connects INGENIERÍA , LOGÍSTICA , and COMPRAS (Purchasing), with CONSTRUCTION placed at the center of the diagram in a red oval. This slide establishes that the software is designed to sit at the nexus of these three critical departments, facilitating the flow of data between the office and the site.
Slide 3: The Problem Statement
The problem is presented through a stark visual contrast. A photograph shows a group of seven men in a construction site trailer, surrounded by stacks of large physical binders and loose papers. The text identifies two core issues: 1. Disparity of criteria and 2. Manual and paper-based processes. This slide is effective because it uses a real-world image to represent the 'before' state—disorganized, slow, and prone to human error due to the lack of a centralized digital truth.
Slide 4: Value Proposition Overview
Slide 4 serves as a transition, labeled "#4 VALUE PROPOSITION." It features a composite image of the software running on a tablet, a smartphone, and a laptop. The branding 'Evolucionapp' is visible on the tablet screen. This slide reinforces the multi-platform nature of the tool, suggesting that data captured on the phone in the field is instantly accessible via the web version on a laptop in the head office.
Slide 5: Web Version Functionality
This slide dives into the desktop experience. It shows two monitor mockups. The left monitor is labeled "Listados de actividades e incidencias" (List of activities and incidents), showing a grid of project photos and status updates. The right monitor is labeled "Panel por cada actividad o incidencia" (Panel for each activity or incident), showing a detailed view that includes a map, a progress chart, and specific document attachments. This demonstrates the software's ability to drill down from a high-level project overview to granular task management.
Slide 6: Organizational Communication Flow
Slide 6, titled "Communication according organization chart," is one of the most important slides for understanding the product's utility. It maps out how information moves between three roles:
Supervisor: Uses a mobile device to input data. The screen shows a specific user, 'Jose Alberto Cordero Rios,' with his cargo, telephone, and email. · Chief of Department: Also uses a mobile device to monitor departmental goals ('Objetivo Principal'). · Site Manager: Uses the web version (desktop) to oversee the entire operation.
The slide uses double-sided arrows to indicate that communication is bi-directional, ensuring that the site manager can push instructions down just as easily as the supervisor can push reports up.
Slide 7: The ROI Calculation
The deck makes a bold financial claim on Slide 7 under the heading "Increase of productivity." It presents a linear equation: 150 workers X 365 days X 1 hour a day X 60 euros/hour = 3,285,000 euros. This is a classic 'value-based' selling point. By framing the software not as a cost, but as a way to reclaim over 3 million euros in lost time, the company attempts to make the purchase decision a mathematical certainty for large construction firms.
Slide 8: Competitive Landscape (Blue Ocean Strategy)
The "Mapa de Posicionamiento" (Positioning Map) on Slide 8 uses the 'Blue Ocean Strategy' framework. It plots competitors on two axes: Maturity and Independence from other software. EPC Tracker is placed in the bottom right, indicating it is a newer entrant but possesses high independence. It contrasts itself against:
Legacy Project Management: Primavera de Oracle, Microsoft Project, Projectwise. · Generic Tools: Dropbox, Evernote, Sharefile, Outlook. · Field Competitors: Plangrid, Fieldlens.
The vertical blue arrow pointing upward from EPC Tracker suggests a trajectory toward higher maturity while maintaining its unique independent status.
Slide 9: Real-World Application
The final attached slide, labeled "#7 FIGURES," shows a mobile screen with a real project entry: "CONSTRUCCIÓN DE LA AREA GENERAL" for Iberdrola Renovables . It lists a progress of 60% , a start date of 29/05/2013 , and a scheduled finish of 25/07/2013 . The responsible party is listed as 'José Luis Zelaya' from the 'Electrical' department. This slide serves as a proof-of-concept, showing that the software is not just a theoretical mockup but is being used for actual industrial infrastructure projects.
What Works and What is Missing
The EPC Tracker deck succeeds in its visual storytelling . By showing the 'messy' reality of paper-based construction and then providing clean, structured digital alternatives, the founders clearly communicate the 'Why' behind their product. The ROI slide is also a strong inclusion, as it speaks the language of the CFOs who ultimately sign off on enterprise software contracts.
However, the deck has significant omissions that would be red flags for modern venture capital investors: 1. No Team Slide: In a complex industry like EPC, the pedigree of the founders is paramount. There is no mention of who is building this or if they have actual construction experience. 2. No Business Model: The deck explains what the product does, but not how the company makes money. Is it per-user, per-project, or a flat enterprise license? 3. No Traction Metrics: While Slide 9 shows an Iberdrola project, the deck does not state how many active customers they have, their churn rate, or their current Annual Recurring Revenue (ARR). 4. No Funding Ask: An investor deck must eventually ask for money. This deck describes a product but fails to define the investment opportunity, the valuation, or the intended use of funds.
Founder Takeaway
Founders in the 'Industrial Tech' or 'ConTech' space should copy the role-based communication map seen on Slide 6. Investors often struggle to understand how a mobile app fits into a complex corporate hierarchy; showing exactly who uses the phone and who uses the desktop clarifies the user journey. Furthermore, the quantified productivity gain on Slide 7 is a powerful tool, provided the assumptions (like the 60 euro hourly rate) are backed by industry data. However, founders must ensure they don't get so caught up in product features that they forget to sell the business —the team, the financials, and the specific deal on the table are just as important as the software screenshots.
Frequently asked questions
- What specific problem does EPC Tracker solve?
- According to Slide 3, the company solves the 'disparity of criteria' and the reliance on 'manual and paper-based processes' in the construction industry. The slide illustrates this with a photo of a meeting room filled with physical binders and paper documents, suggesting that information silos and slow data transmission are the primary pain points for engineering and procurement teams.
- How does the company calculate its value proposition to a construction firm?
- The company uses a productivity-based ROI model shown on Slide 7. It assumes a mid-sized project team of 150 workers. By saving one hour of manual work per day per worker, valued at 60 euros per hour over a full year (365 days), the company claims a total potential savings of 3,285,000 euros. This provides a tangible 'hard dollar' justification for the software's implementation cost.
- Who are the primary competitors identified in the deck?
- Slide 8 lists several competitors across two axes: 'Grado de madurez' (Degree of maturity) and 'Grado de independencia de otros software' (Degree of independence from other software). Competitors include heavyweights like Primavera de Oracle, Microsoft Project, and Projectwise, as well as generic tools like Dropbox, Evernote, Microsoft Outlook, and Sharefile. It also mentions field-specific tools like Plangrid and Fieldlens.
- What does the user interface look like for field workers?
- Slide 9 shows a mobile interface on a Samsung device. The UI includes 'Detalle Actividad' (Activity Detail) with progress tracking (shown at 60%), descriptions, start/end dates (e.g., 29/05/2013 to 25/07/2013), priority levels, and status. It also identifies the 'Responsable' (Responsible party) and the specific department, such as 'Electrical,' ensuring accountability at the field level.
- What critical information is missing from this pitch deck?
- The deck is missing several fundamental components required for a professional investment round. There is no 'Team' slide highlighting founder expertise, no 'Ask' slide detailing how much capital is being raised, and no 'Financials' slide showing historical revenue or future projections. Additionally, there is no mention of the current customer count or the business model (SaaS vs. Licensing).