Pop Up Archive’s 2012 seed deck is a study in visual minimalism and data-driven storytelling. With only 10 slides, the company successfully communicated a complex technical value proposition—making sound searchable—by focusing on the explosion of digital audio content and their own impressive financial performance. The deck highlights a 50% month-over-month revenue growth rate and 70% margins, providing a strong quantitative foundation for their $1.4 million raise. While the deck lacks a traditional 'Problem' slide with text-heavy descriptions, it uses iconography and logos to imply market ne…
Key takeaways
- The deck relies on a minimalist aesthetic, using only 10 slides to convey the entire business case.
- Slide 2 establishes the scale of the opportunity by citing 12 hours of audio uploaded to SoundCloud per minute and 100 hours of video to YouTube per minute.
- Traction is the centerpiece of the deck, with Slide 5 reporting 50% month-over-month revenue growth and 70% margins.
- The company claims a $200K current run rate on Slide 5, which is repeated on the final slide for emphasis.
- Market size is defined on Slide 9 as an $8 billion total addressable market, split between Voice Recognition and Media Search.
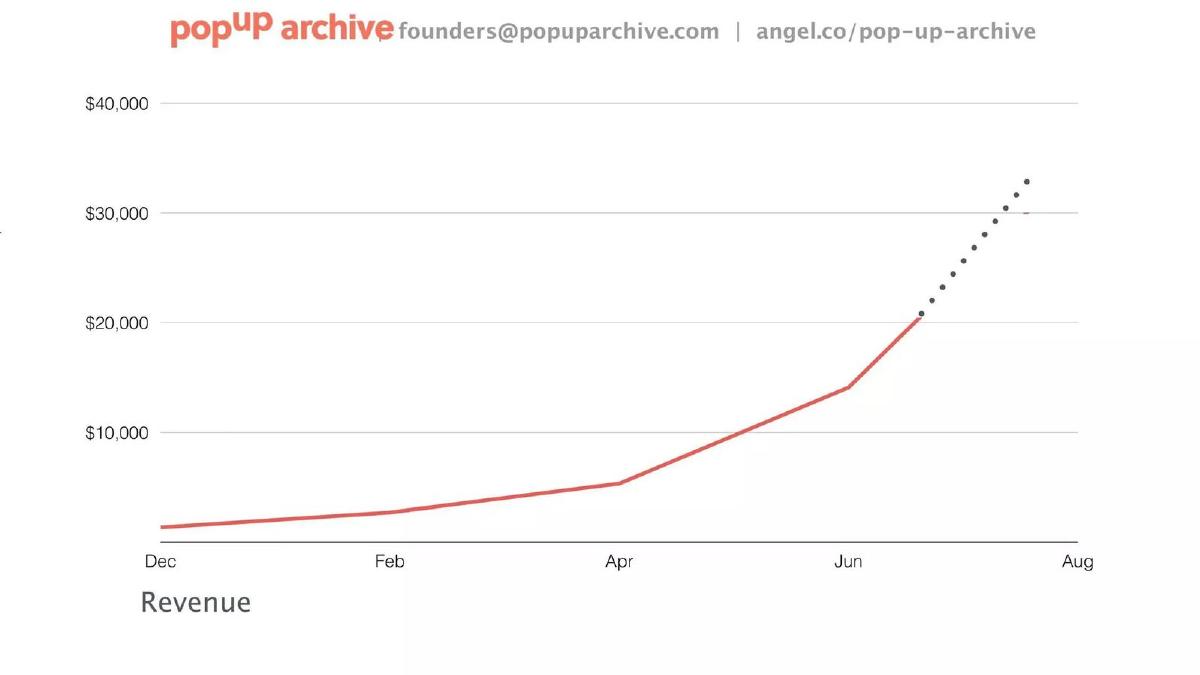
- The revenue chart on Slide 6 shows a clear hockey-stick trajectory from December to June, with a dotted line projecting future growth.
- The team slide (Slide 8) highlights pedigree with logos from UC Berkeley, Code for America, Yahoo!, and Pivotal Labs.
- The deck completely omits a specific 'Ask' slide, failing to state the amount being raised or the intended use of funds within the slides themselves.
The Power of Minimalist Traction
Pop Up Archive’s 2012 seed deck is a reminder that when the numbers are good, you don't need much text. At just 10 slides, this deck is shorter than the average seed presentation, yet it managed to secure $1.4 million in funding. The strategy here is clear: lead with the explosion of data, prove you can monetize it with high margins, and show a team that has the pedigree to execute. By 2012 standards, the 50% month-over-month growth mentioned on Slide 5 was an incredibly strong signal for a seed-stage startup.
Slides 1-3: The Context and the Content
Slide 1: Title Slide The deck opens with a clean logo and a simple four-word value proposition: "makes sound searchable." It includes contact information and a link to their AngelList profile. This sets a tone of transparency and directness that carries through the rest of the presentation.
Slide 2: The Data Explosion Instead of a traditional 'Problem' slide, Slide 2 uses a comparative visual to show the volume of content being created. It notes that 12 hours of audio are uploaded to SoundCloud every minute, while 100 hours of video are uploaded to YouTube every minute. This slide establishes the 'Why Now?' factor—the sheer volume of unindexed audio and video content is becoming unmanageable without automated tools.
Slide 3: The Searchable Web This slide is a word cloud of topics like "SF real estate," "transit strike," "marriage equality," and "Hillary Clinton" overlaid on a background of media logos including KQED, KCRW, and Princeton Theological Seminary. It visually represents the types of content currently being processed by their system and the high-quality institutions already using or providing the data. It serves as a soft 'Social Proof' slide without needing a list of testimonials.
Slides 4-6: The Business Model and Traction
Slide 4: The Process Using three simple icons—a text document, an eye, and a dollar sign—this slide explains the business logic. It implies a workflow of transcription (text), discovery/indexing (eye), and monetization (dollar sign). It is perhaps the most abstract slide in the deck, but it bridges the gap between the technology and the financial results shown next.
Slide 5: Key Metrics This is the 'money slide.' It presents three bold figures: "50% MoM rev growth," "200K current run rate," and "70% margins." These are elite metrics for a seed-stage company. The 70% margin figure is particularly important as it signals a software-driven business rather than a service-heavy manual transcription shop. By putting these numbers front and center, the founders shift the conversation from 'what is this?' to 'how big can this get?'
Slide 6: Revenue Chart Slide 6 visualizes the growth mentioned on the previous slide. The chart shows revenue from December to June. While the Y-axis caps at $40,000, the red line shows a sharp upward curve starting in April, reaching just above $20,000 in June. A dotted line projects this trend into July and August, reinforcing the 50% MoM growth narrative. It provides a visual 'hockey stick' that investors look for in early-stage deals.
Slides 7-10: Expansion, Team, and Market Size
Slide 7: Market Expansion This slide uses a 'Now vs. Next' framework. Under "Now," it lists Education, Radio, and Television. Under "Next," it targets Government, Data Analysis, and Advertising. This demonstrates that the founders aren't just thinking about podcasting or radio; they see their technology as a horizontal layer for any industry that generates spoken-word data.
Slide 8: The Team The team slide features CEO Anne Wootton and CTO Bailey Smith. The bottom of the slide is anchored by logos from UC Berkeley School of Information, Code for America, Yahoo!, and Pivotal Labs. This is a classic 'pedigree' slide, showing that the founders have been vetted by top-tier institutions and tech companies. In a seed round, the team is often the most important factor, and these logos provide instant credibility.
Slide 9: Total Addressable Market (TAM) Slide 9 presents an "$8B total addressable market." The visual is a pie chart where a small slice represents "Media Search" and the vast majority represents "Voice Recognition." This is a strategic way to frame the company; while they might be starting in media search, the real prize is the broader voice recognition market. It justifies a venture-scale investment by showing a path to a billion-dollar valuation.
Slide 10: Conclusion The final slide repeats the logo and the three key metrics from Slide 5. It’s a strong closing move, ensuring that the last thing an investor sees is the company's growth rate, run rate, and margins. It leaves the viewer with the quantitative proof of the company's success.
What Works in This Deck
Extreme Brevity: The deck doesn't waste time on fluff. Every slide serves a specific purpose, moving from the market opportunity to traction, then to the team, and finally to the total market size. In an era of 20-30 slide decks, this 10-slide approach is refreshing and respectful of an investor's time.
Focus on Margins: Mentioning 70% margins is a critical detail. It distinguishes Pop Up Archive from manual transcription services, which are notoriously difficult to scale. It tells the investor that this is a technology company, not a labor company.
Visual Consistency: The use of a consistent color palette (coral/salmon and grey) and simple iconography makes the deck feel professional and cohesive. It suggests a level of polish and attention to detail that investors often associate with high-quality product teams.
What is Missing
The Ask: The most glaring omission is a slide detailing the fundraise. There is no mention of how much capital is being sought, the valuation cap, or how the money will be spent. While this information is often handled in person or via a follow-up email, including a 'Use of Funds' slide can help investors understand the company's immediate priorities (e.g., hiring more engineers vs. expanding sales).
Competitive Landscape: The deck assumes the viewer understands that 'making sound searchable' is a unique value proposition. However, it doesn't address competitors in the speech-to-text or media indexing space. A simple competitive matrix could have helped define their unique technical moat.
Unit Economics: While the deck mentions 70% margins, it doesn't dive into Customer Acquisition Cost (CAC) or Lifetime Value (LTV). For a company claiming 50% MoM growth, investors would want to know if that growth is sustainable and profitable at the unit level.
What a Founder Should Copy
The 'Now vs. Next' Slide: Slide 7 is a perfect example of how to show a realistic go-to-market strategy while still promising a massive future. Founders should copy this format to show they have a beachhead market (Radio/Education) but aren't limited by it.
Repetition of Key Metrics: Repeating the traction metrics on the final slide is a brilliant psychological tactic. It ensures the most impressive facts about the business are the ones that stick in the investor's mind after the presentation ends.
Logo-Based Credibility: If you have worked at a major tech firm or attended a top university, use the logos. Slide 8 does this perfectly—it doesn't need long descriptions of past roles because the logos of Yahoo! and UC Berkeley do the heavy lifting for them.
Frequently asked questions
- How much did Pop Up Archive raise with this deck?
- According to the catalogue facts, Pop Up Archive raised $1,400,000 in a Seed round in 2012. Interestingly, the deck itself does not explicitly state the fundraising goal or the terms of the round, relying instead on the traction metrics to generate investor interest.
- What is the core technology behind Pop Up Archive?
- The deck describes the company's mission as 'makes sound searchable' on Slide 1. The catalogue listing clarifies that this is achieved through speech-to-text technology that indexes and analyzes audio to create data points like topics, entities, and recommendations for distributors and advertisers.
- Who were the founders of Pop Up Archive?
- As shown on Slide 8, the company was led by CEO Anne Wootton and CTO Bailey Smith. Their professional backgrounds include experience at high-profile organizations such as Yahoo!, Code for America, and Pivotal Labs, as well as academic ties to the UC Berkeley School of Information.
- What markets was the company targeting for expansion?
- Slide 7 outlines a transition from current markets (Education, Radio, and Television) to 'Next' markets. These future targets included Government, Data Analysis, and Advertising, suggesting a broad horizontal application for their audio search and indexing technology.
- What were the key financial metrics presented in the deck?
- The deck emphasizes three primary metrics on Slides 5 and 10: 50% month-over-month revenue growth, a $200,000 current run rate, and 70% margins. These figures suggest a highly scalable software-as-a-service model with significant early-stage momentum.