EnLink Midstream’s September 2014 presentation serves as a blueprint for infrastructure companies leveraging corporate sponsorship for rapid scaling. The company emphasizes a shift to a low-risk financial profile, with 95% of its gross operating margin derived from fee-based contracts (Slide 7), insulating it from commodity price volatility. Central to the pitch is the relationship with Devon Energy, which provides over 50% of EBITDA and a clear pipeline of 'dropdown' assets worth approximately $375 million in potential cash flow by 2017 (Slide 10). The deck successfully balances immediate op…
Key takeaways
- The company maintains an investment-grade credit rating (BBB / Baa3) and a Debt/EBITDA ratio of approximately 3.5x (Slide 22).
- Devon Energy is the primary sponsor and largest customer, accounting for 56% of the consolidated gross operating margin (Slide 7).
- Revenue is highly de-risked, with 95% of contracts being fee-based rather than commodity-sensitive (Slide 7).
- A clear growth roadmap is presented through four 'avenues': Dropdowns, Growing with Devon, Organic Projects, and M&A (Slides 10, 13, 16, 19).
- The company projects a potential for ~$375 million in additional cash flow from asset dropdowns through 2017 (Slide 10).
- Geographic concentration is primarily in Texas (57%), followed by Louisiana (19%) and Oklahoma (19%) (Slide 7).
- EnLink has significant liquidity, citing approximately $700 million available for platform expansion and acquisitions (Slide 19).
- Organic growth is highlighted by the Ohio River Valley project, involving a 45-mile condensate pipeline and $250 million in new capital deployment (Slide 16).
Executive Summary: The Power of Strategic Sponsorship
The EnLink Midstream investor presentation from September 2014 is a textbook example of how to pitch a large-scale infrastructure business. Unlike early-stage tech startups that pitch on vision and potential, EnLink pitches on stability, scale, and predictable growth . The deck focuses heavily on the company's relationship with Devon Energy, its primary sponsor, and its transition toward a fee-based revenue model that insulates it from the volatile energy markets of the era.
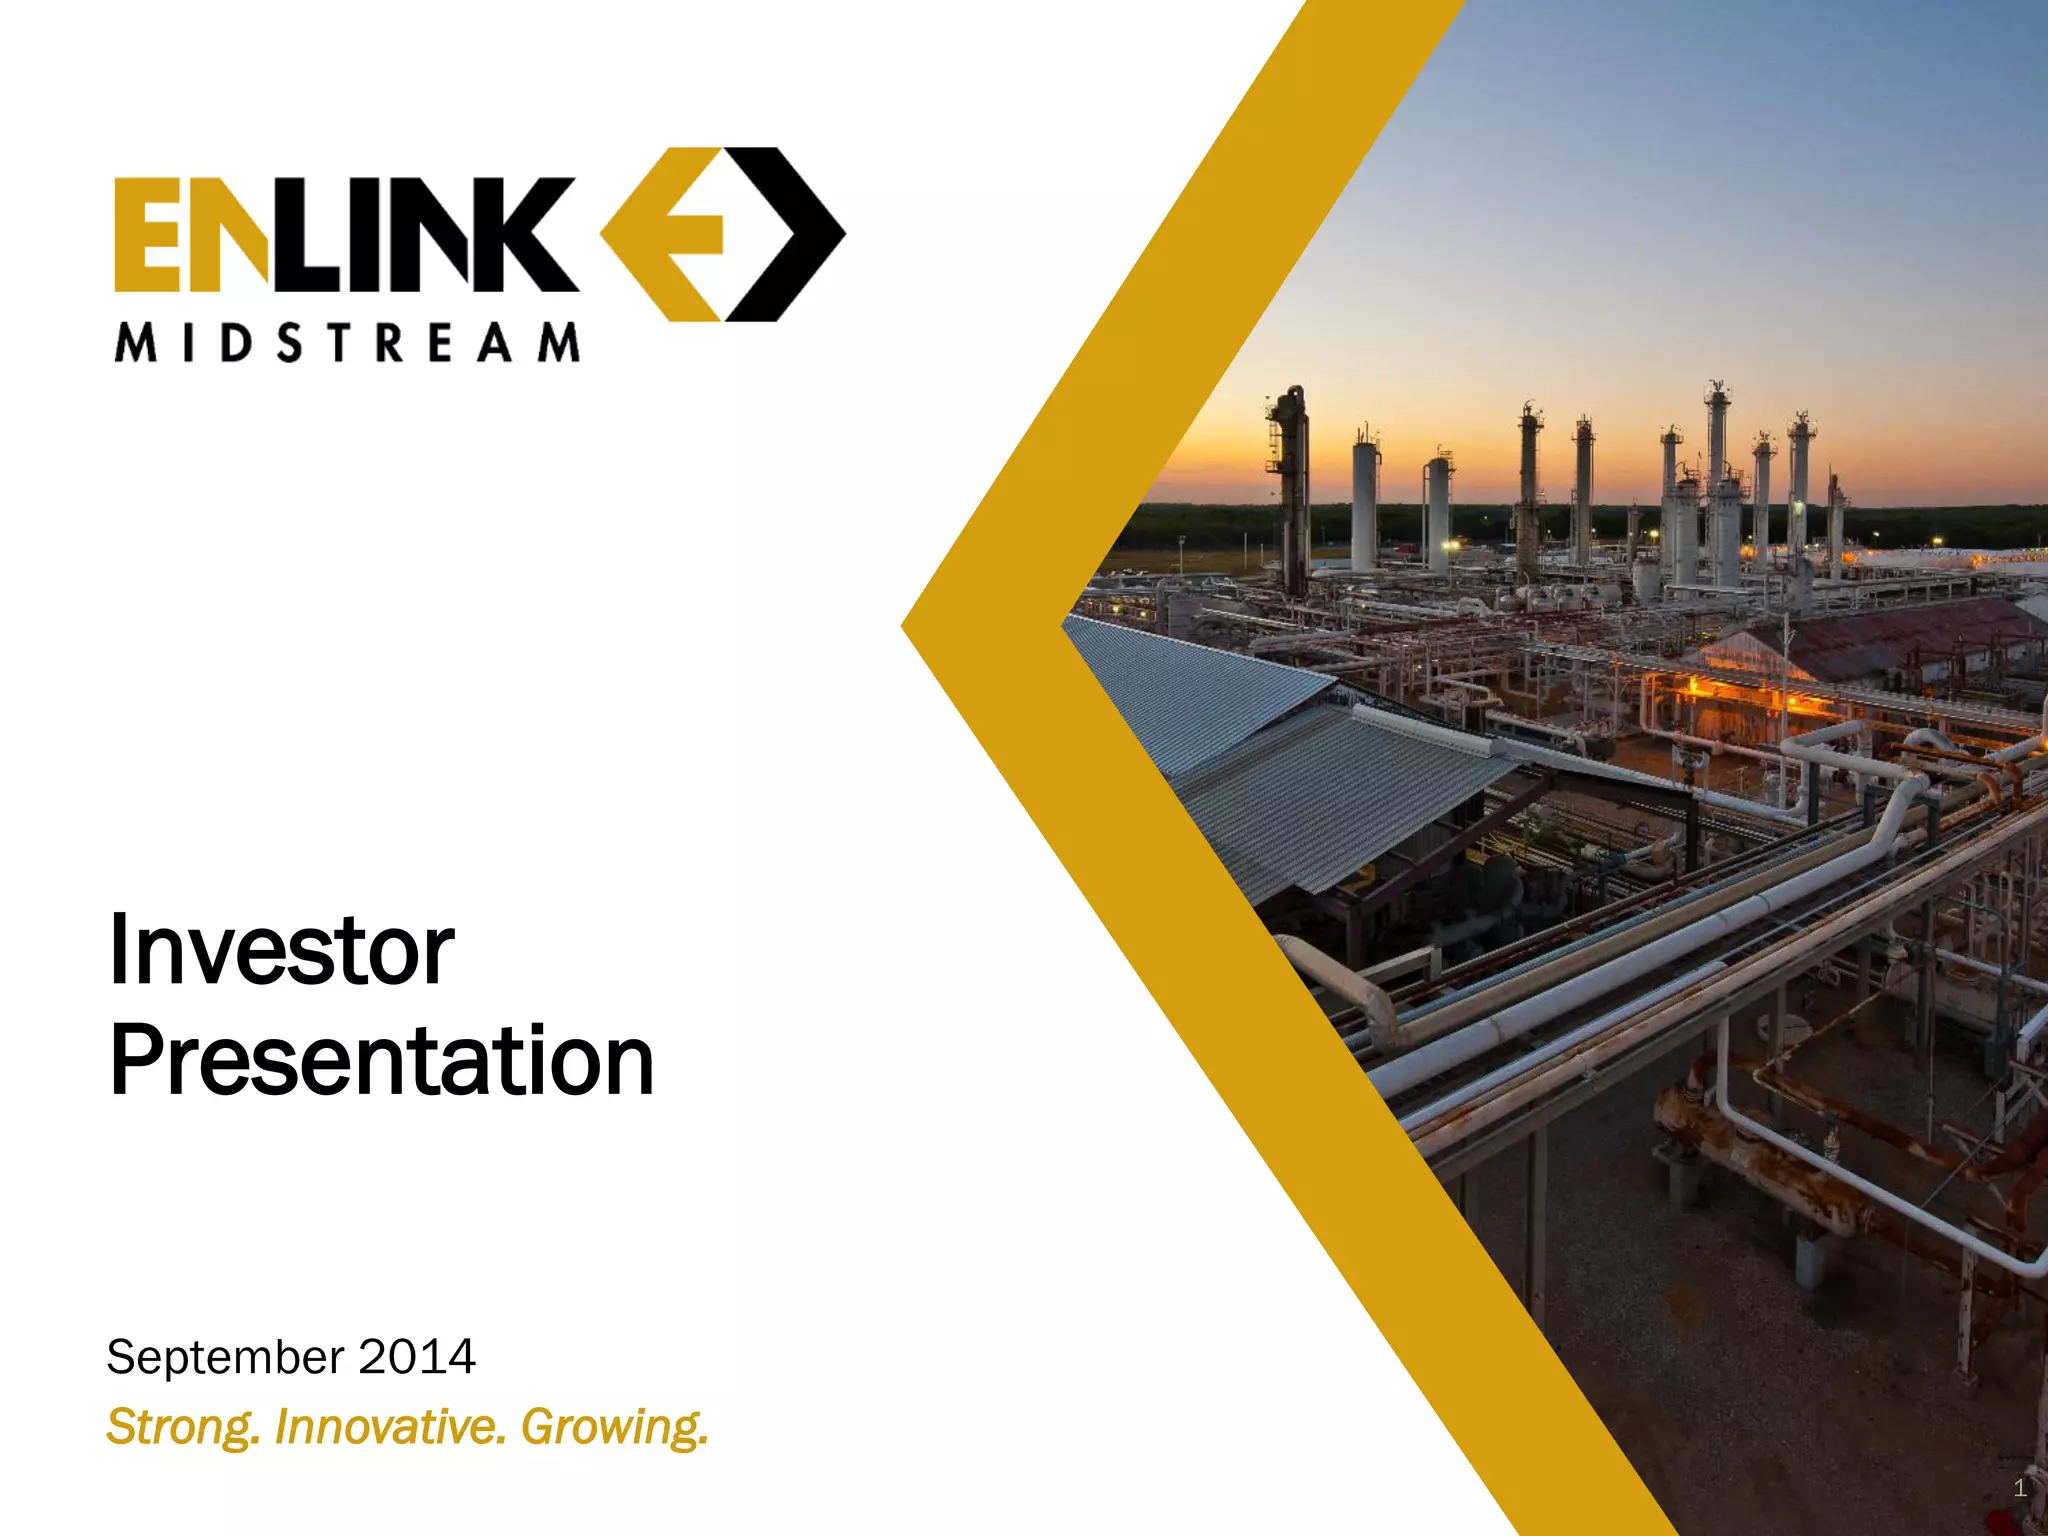
Slide 1: Title and Brand Identity
The cover slide establishes a professional, industrial tone. The tagline "Strong. Innovative. Growing." sets the thematic pillars for the rest of the presentation. The use of high-quality industrial photography immediately communicates the physical nature of the asset base—pipelines, processing plants, and heavy infrastructure.
Slide 4: Our Strategy
This slide outlines the five core components of EnLink's business model. It emphasizes the stability of cash flows , noting that approximately 95% of contracts are fee-based. This is a crucial point for midstream investors who prioritize dividend safety. It also introduces the concept of "Devon Energy sponsorship," citing a potential $375 million in additional cash flow from dropdowns by 2017. The inclusion of an investment-grade credit rating highlights financial maturity.
Slide 7: The Vehicle for Sustainable Growth
Slide 7 uses data visualization to prove the company's diversification and risk profile. Three donut charts break down the Gross Operating Margin by Region, Customer, and Contract Type. Texas represents the largest regional share at 57% , while Devon Energy accounts for 56% of the customer base. The most important metric here is the "95% Fee-Based" contract type, which reinforces the message that EnLink is a service provider, not a commodity speculator.
Slide 10: Avenue 1 - Future Dropdowns
This slide provides a clear, chronological roadmap for asset acquisitions from Devon Energy. It lists specific projects like the Victoria Express Pipeline (estimated $70 million capital cost) and the Access Pipeline (estimated $1.0 billion capital cost). By quantifying the estimated cash flow from these projects (~$375 million total), EnLink gives investors a tangible way to model future growth. The "Cautionary Note" at the bottom is a standard but necessary legal disclaimer for forward-looking infrastructure projections.
Slide 13: Avenue 2 - Growing With Devon
This slide explains the symbiotic relationship between the sponsor and the subsidiary. It notes that Devon has a "significant financial incentive" to use EnLink because Devon owns 70% of ENLC and 52% of ENLK. The chart showing Devon's 2014 E&P Capital Budget ($5.0 - 5.4 Billion) illustrates the massive pool of potential work available to EnLink. By showing that Devon historically spends $350-$700 million annually on midstream CAPEX , EnLink positions itself as the natural beneficiary of that spending.
Slide 16: Avenue 3 - Organic Growth Projects
Moving away from the Devon relationship, Slide 16 focuses on EnLink's independent growth in the Ohio River Valley. It details a 45-mile condensate pipeline and new compression stations. The slide lists specific technical capacities, such as ~50,000 bpd (barrels per day) and ~560 MMcf/d (million cubic feet per day) . This level of granular detail is essential for industrial investors to verify the feasibility and scale of the projects.
Slide 19: Avenue 4 - Mergers & Acquisitions
The final growth pillar is M&A. This slide is less about specific targets and more about financial readiness . It highlights $700 million in liquidity and an investment-grade balance sheet (BBB / Baa3). The strategy is clear: EnLink will pursue scale in new basins, particularly where Devon is active, using its low cost of capital as a competitive advantage.
Slide 22: Long Term Vision and Financial Attributes
The presentation concludes with a summary of key financial metrics. It reiterates the $14 billion enterprise value and the ~$675 million projected adjusted EBITDA for 2014. By grouping these into four categories—Credit Profile, Cash Flow, Scale, and Growth—the deck provides a concise wrap-up of the investment thesis. The mention of a 3.5x Debt/EBITDA ratio serves as a final reassurance of fiscal conservatism.
What EnLink Midstream Does Well
The deck is exceptionally strong at quantifying the future . Rather than speaking in generalities about growth, it provides specific dollar amounts for potential dropdowns, specific mileage for pipelines, and specific percentages for contract types. This transparency builds significant trust with institutional investors.
Furthermore, the structure of the "Four Avenues" of growth provides a comprehensive view of the company's strategy. It shows that they aren't just relying on their parent company (Devon), but are also building their own projects (Organic) and looking for external opportunities (M&A). This multi-pronged approach suggests a mature management team that understands risk diversification.
What is Missing from the Deck
While the deck is comprehensive for an industrial firm, there are a few notable omissions based on the 8 slides provided:
Management Team: There is no slide detailing the experience or track record of the leadership team. In a capital-intensive business, the ability of the CEO and CFO to manage debt and execute large projects is paramount. · Competitor Analysis: The deck operates in a vacuum, never mentioning other midstream players like Enterprise Products Partners or Kinder Morgan. Investors would benefit from seeing how EnLink's fee-based percentage or yield compares to industry peers. · Unit Economics: While total EBITDA is provided, there is little information on the specific margins per barrel or per mcf transported. This makes it difficult to assess the operational efficiency of the assets compared to the industry average.
Founder's Playbook: What to Copy
1. The "Sponsorship" Narrative: If your startup has a strategic partner or a major corporate customer that anchors your business, make that relationship the centerpiece of your deck. EnLink shows how a large partner de-risks the entire investment by providing a "captive" market for growth.
2. Revenue Quality Breakdown: Don't just say you have revenue; show the quality of that revenue. EnLink's breakdown of fee-based vs. commodity-sensitive contracts is a perfect example of how to communicate low-risk profiles to investors. If your revenue is recurring or under long-term contract, highlight it visually.
3. The Roadmap of "Avenues": Categorizing growth into distinct "avenues" (Slide 10, 13, 16, 19) is a brilliant way to organize a complex business. It allows you to talk about different timelines and risk profiles without confusing the listener. It shows that you have a plan for the next 12 months, 3 years, and 5 years.
4. Use of Industrial Metrics: EnLink uses the language of its industry—bpd, MMcf/d, EBITDA multiples, and credit ratings. Founders should ensure their decks use the specific KPIs that their target investors use to evaluate success in their specific sector.
Final Thoughts
EnLink Midstream’s deck is a masterclass in corporate storytelling through data . It successfully transitions the company from a complex infrastructure entity into a simple, yield-generating machine in the eyes of the investor. By focusing on the 95% fee-based margin and the $14 billion scale, the company presents itself as an inevitable winner in the midstream space, backed by the financial muscle of Devon Energy.
Frequently asked questions
- What is the significance of the Devon Energy relationship for EnLink?
- Devon Energy acts as both a majority owner and the primary customer. According to Slide 13, Devon owns 70% of ENLC and 52% of ENLK. This 'sponsorship' model provides EnLink with a steady stream of midstream projects and 'dropdown' assets—infrastructure built by Devon that EnLink later acquires—ensuring a predictable growth trajectory and a stable base of fee-based revenue.
- How does EnLink protect itself from fluctuations in oil and gas prices?
- EnLink utilizes a fee-based contract model to minimize commodity risk. Slide 7 shows that 95% of their consolidated gross operating margin comes from fee-based contracts, while only 5% is commodity-sensitive. This structure allows the company to generate stable cash flows regardless of the market price of the energy products they transport and process.
- What are 'dropdowns' and how do they impact EnLink's financials?
- Dropdowns are asset transfers from a parent company (Devon) to the subsidiary (EnLink). Slide 10 outlines a timeline of potential dropdowns, including the Access Pipeline and Victoria Express Pipeline. These transactions are expected to contribute approximately $375 million in additional cash flow by 2017, providing a clear path for increasing investor distributions without relying solely on new market discoveries.
- What is EnLink's current scale and financial health as of this deck?
- As stated on Slide 22, EnLink has a total consolidated enterprise value of approximately $14 billion. Their projected 2014 combined adjusted EBITDA is ~$675 million. The company maintains an investment-grade balance sheet with a 3.5x Debt/EBITDA ratio and $700 million in liquidity, indicating a strong capacity to fund future growth projects and acquisitions.
- What specific organic growth projects are highlighted in the presentation?
- Slide 16 details the Ohio River Valley (ORV) expansion. This includes a 45-mile, 8-inch condensate pipeline with a 50,000 bpd capacity and six new stabilization/compression stations. EnLink plans to deploy over $250 million in capital for this project, bringing their total investment in the ORV to over $500 million, supported by long-term contracts.