E maji addresses the critical issue of water contamination in Africa, where the deck claims 8 million people die annually. The current testing cycle is depicted as dangerously slow, taking up to seven weeks for government action. E maji proposes an IoT-based system using 'Wasp Mote' sensors and GPRS/3G modules to provide real-time detection and response. The business model is diverse, targeting government contracts, commercial sectors like hotels and schools, and a 'Maker kit' for community empowerment. While the deck establishes a powerful problem-solution fit and shows physical prototypes,…
Key takeaways
- The problem is framed with high-stakes health data, stating 8 million annual deaths in Africa due to water contamination (Slide 1).
- Current water testing is shown to be a 7-week cycle from contamination to government action, which the company aims to shorten to real-time (Slide 3).
- The total addressable market is anchored by the existence of 700,000 boreholes in Africa (Slide 3).
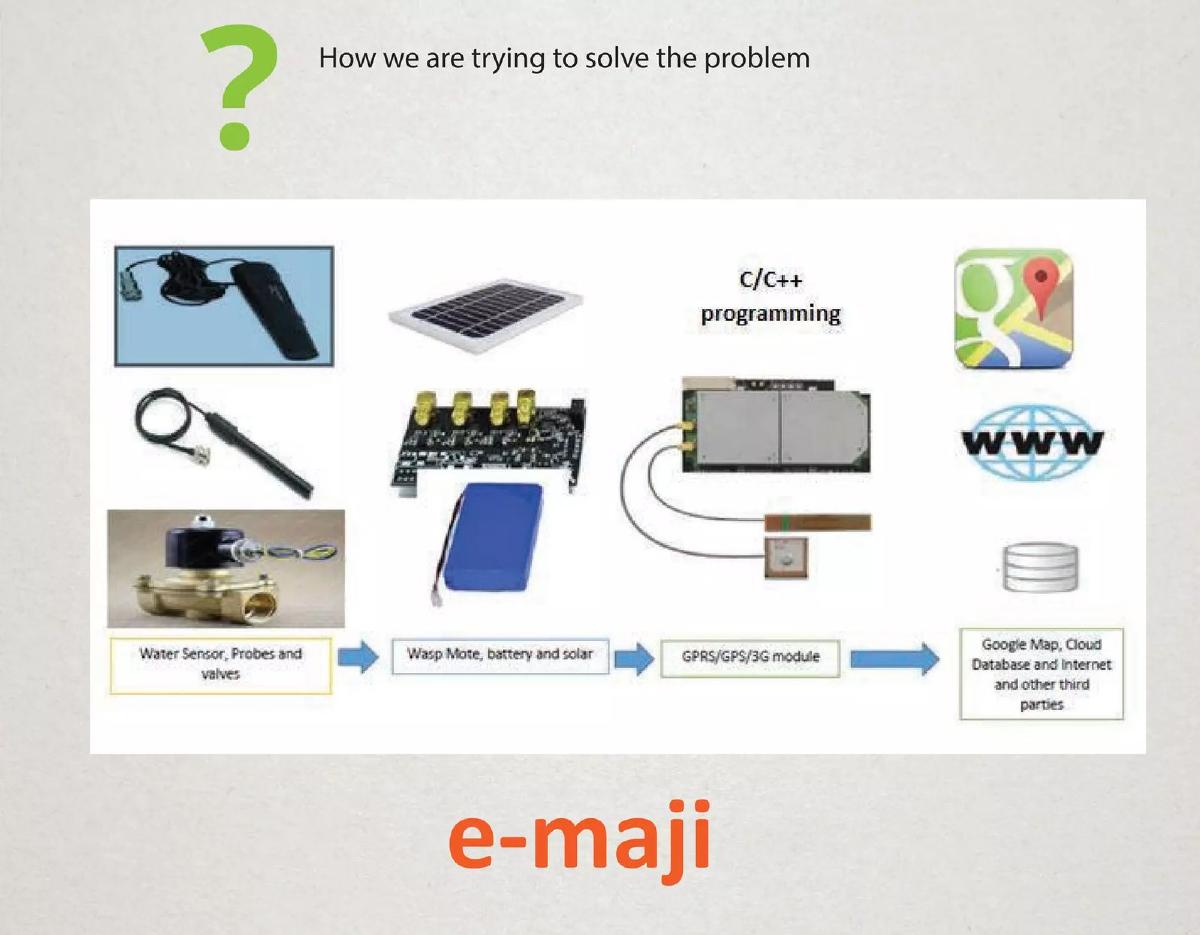
- The technical stack involves water sensors, solar-powered Wasp Motes, and C/C++ programming to send data to a cloud database (Slide 5).
- E maji offers two hardware versions: Pre-Assembled kits for immediate use and Maker kits for community DIY (Slide 7).
- Potential markets are segmented into B2G, B2C (households/travelers), B2B (hotels/schools), and a separate data monetization play (Slide 9).
- The deck includes a photo of the team receiving a '1st Place' award, suggesting early external validation of the concept (Slide 10).
- There is a total absence of financial projections, pricing, or a specific capital requirement in the provided slides.
Problem and Impact: The Water Crisis in Africa
Slide 1: The Human Cost
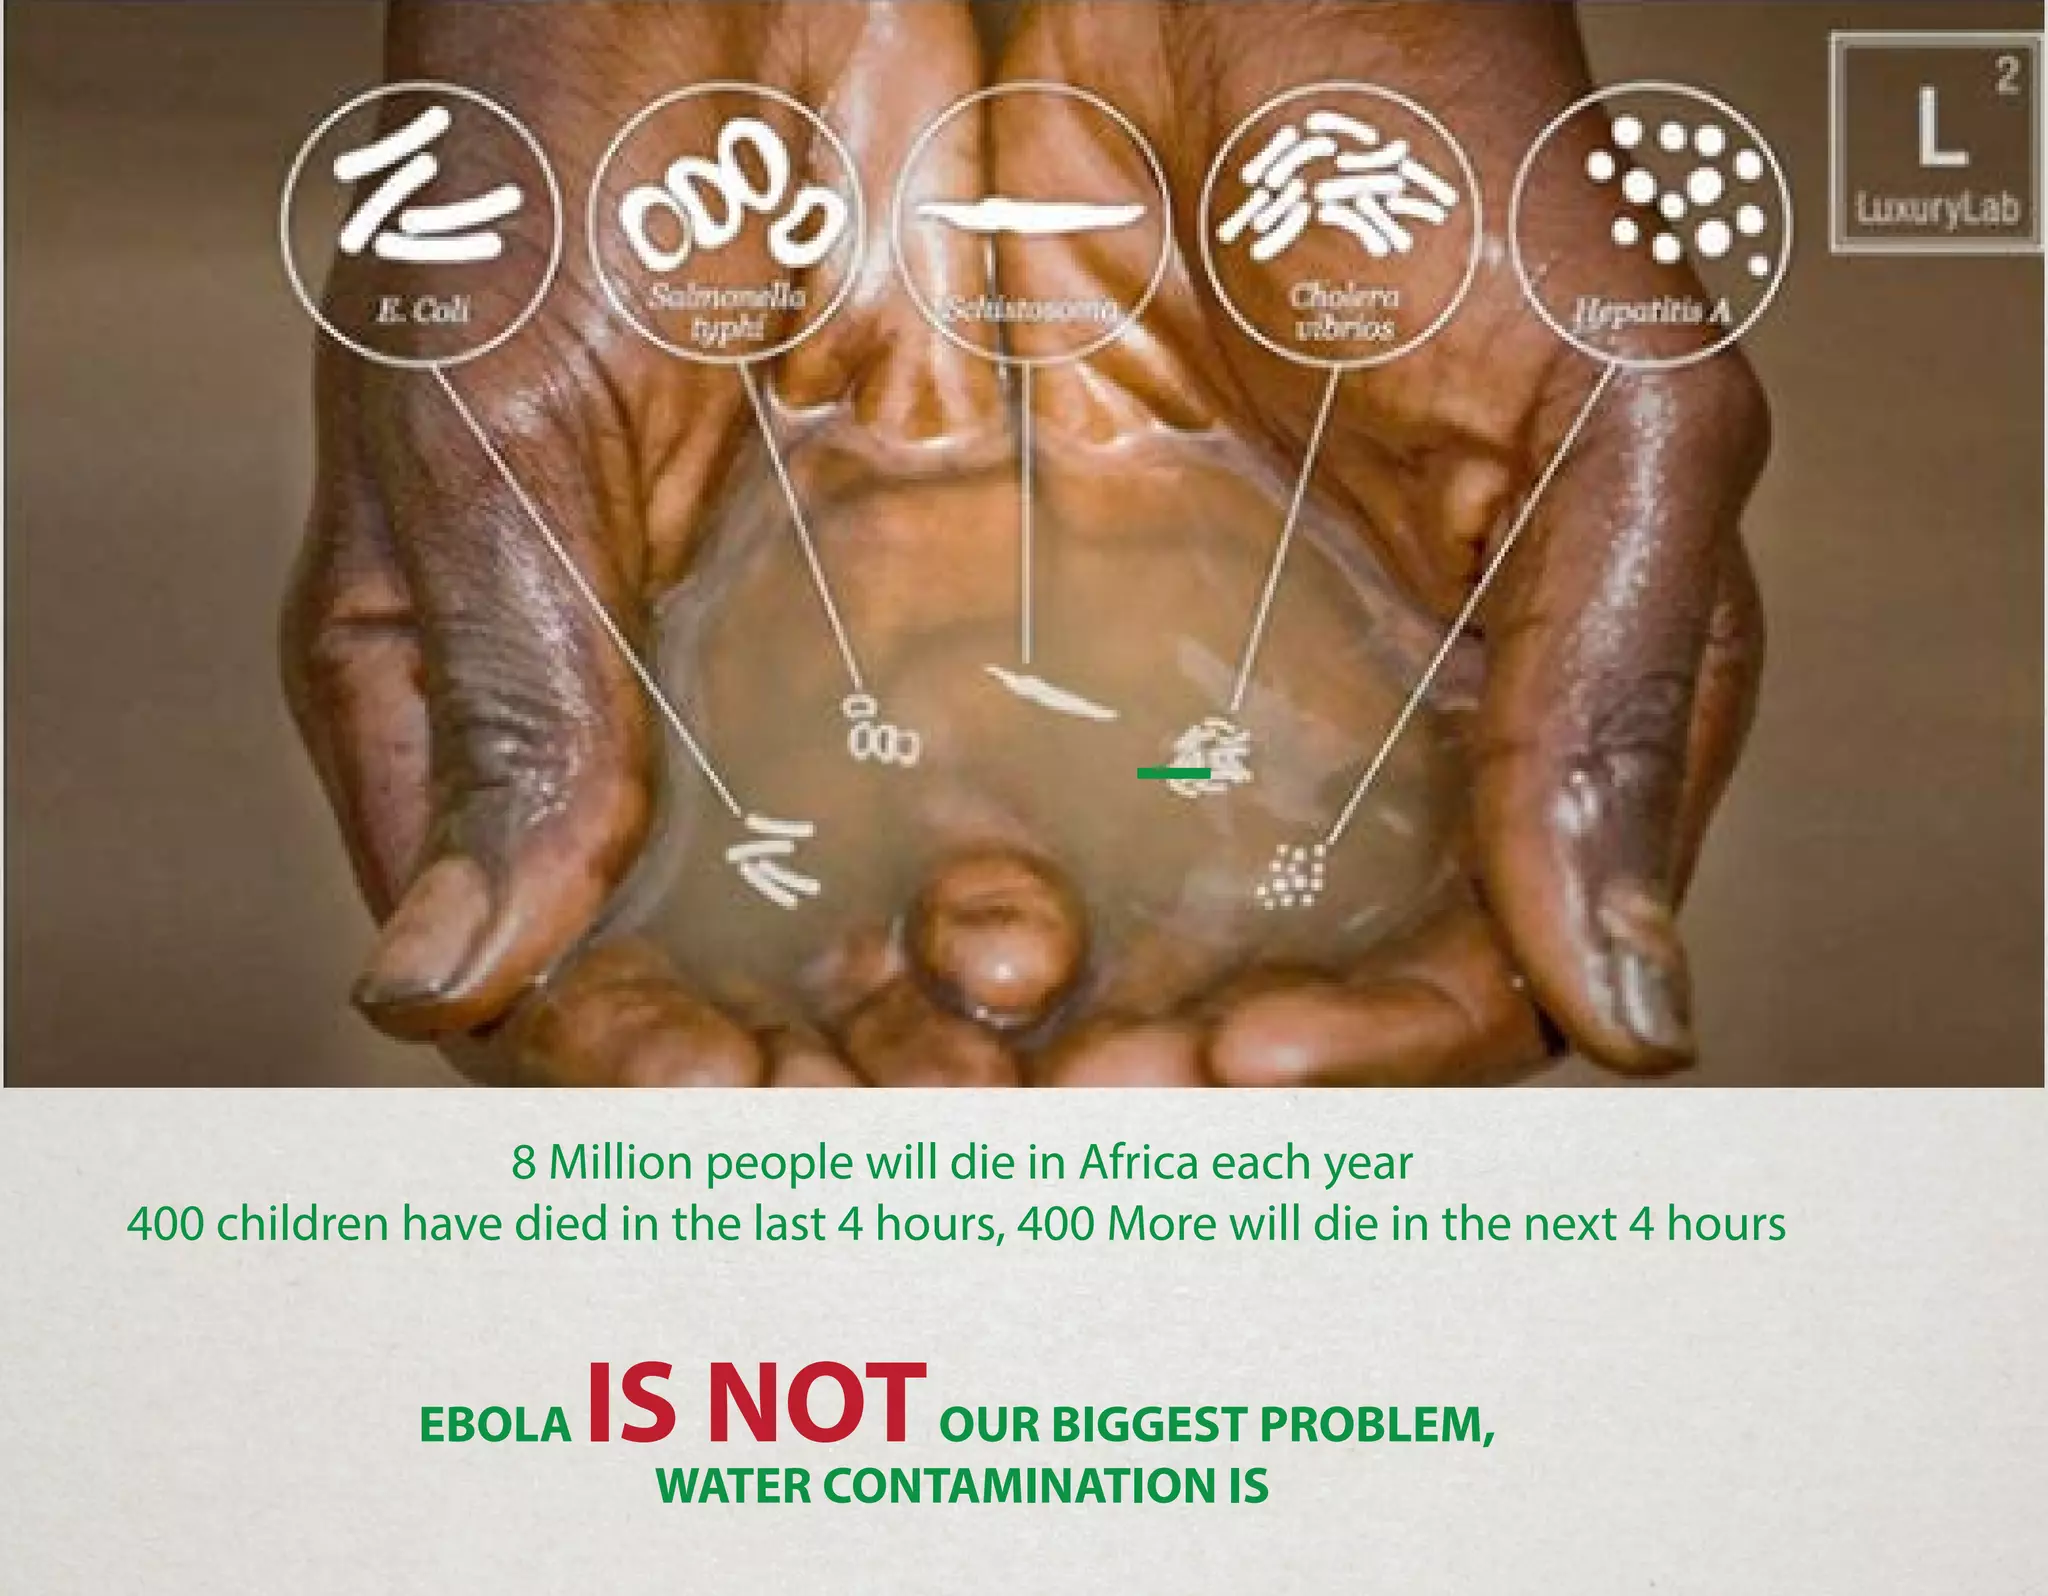
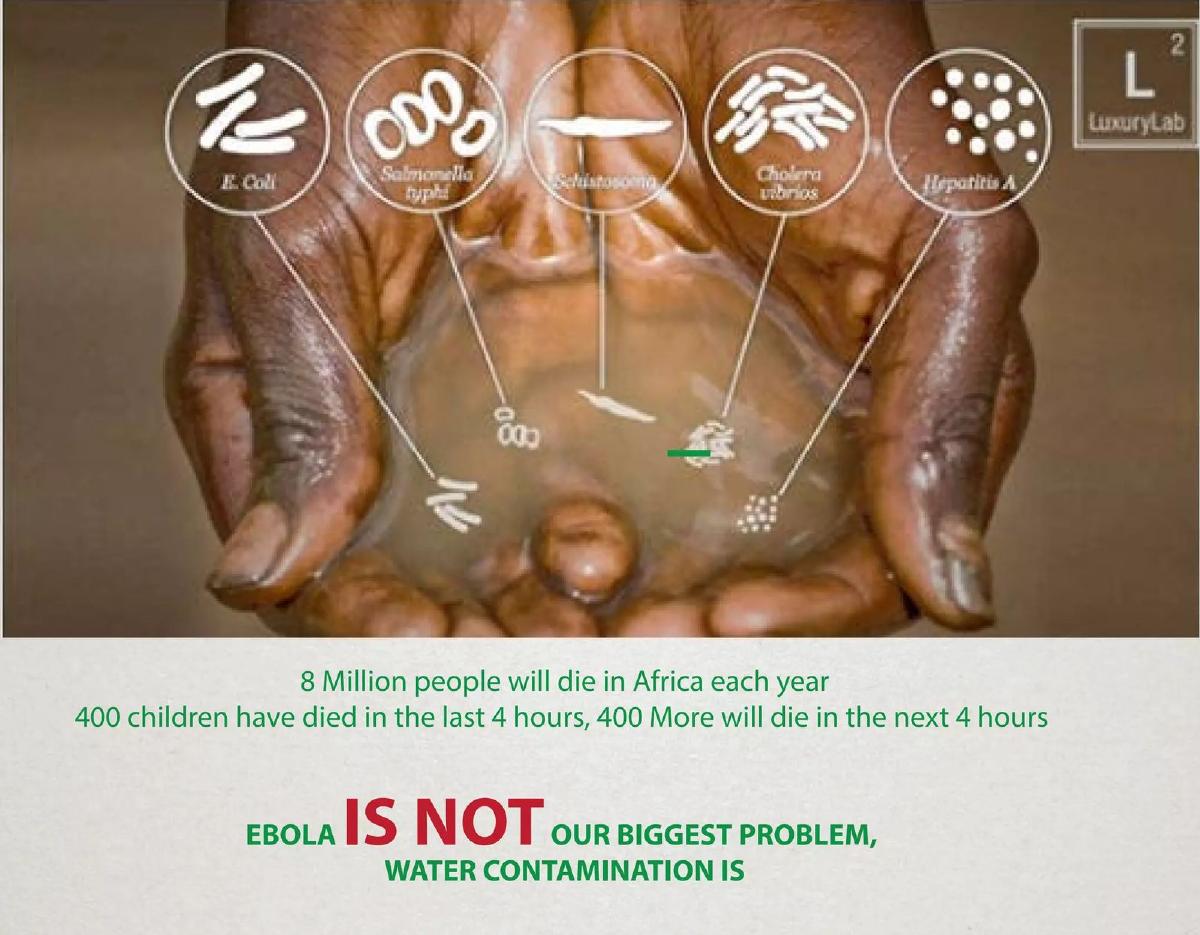
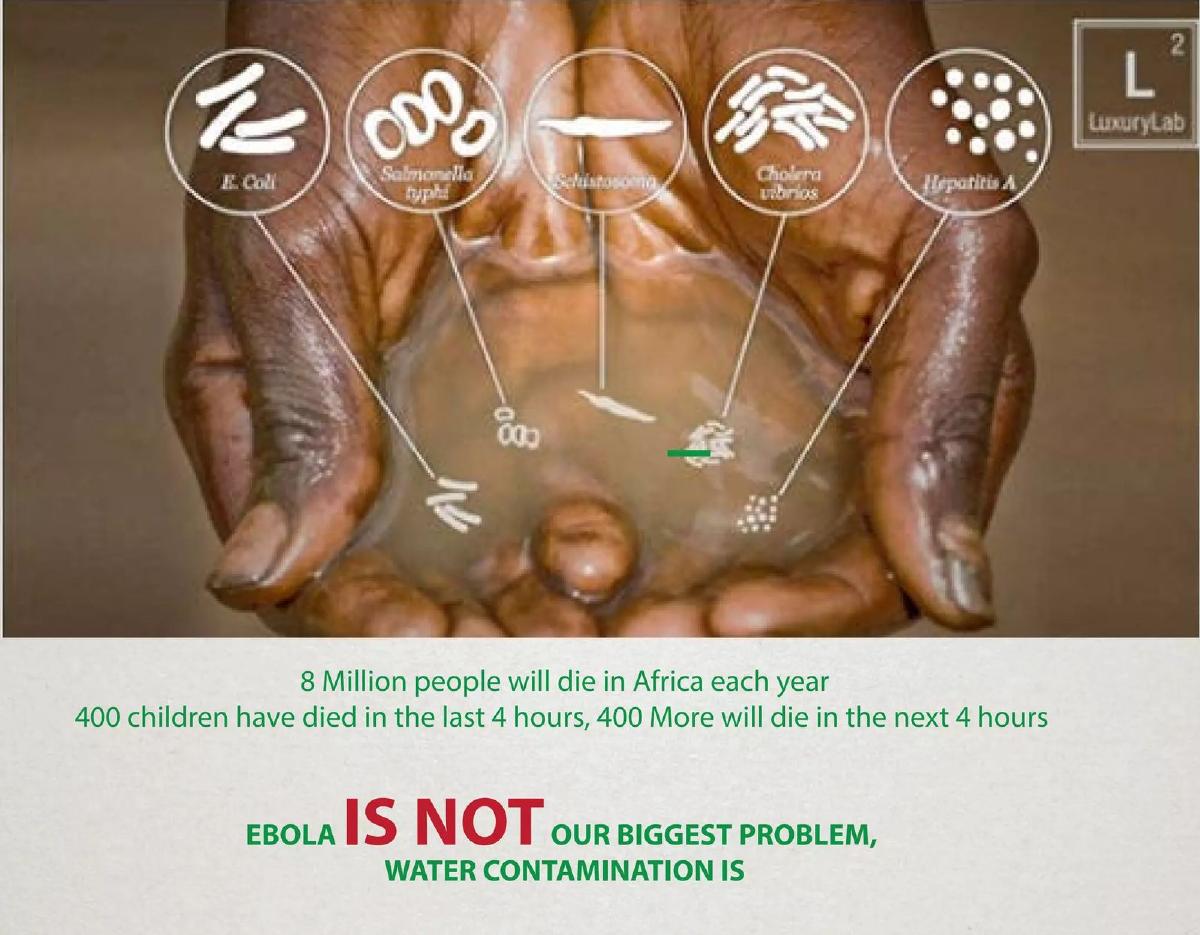
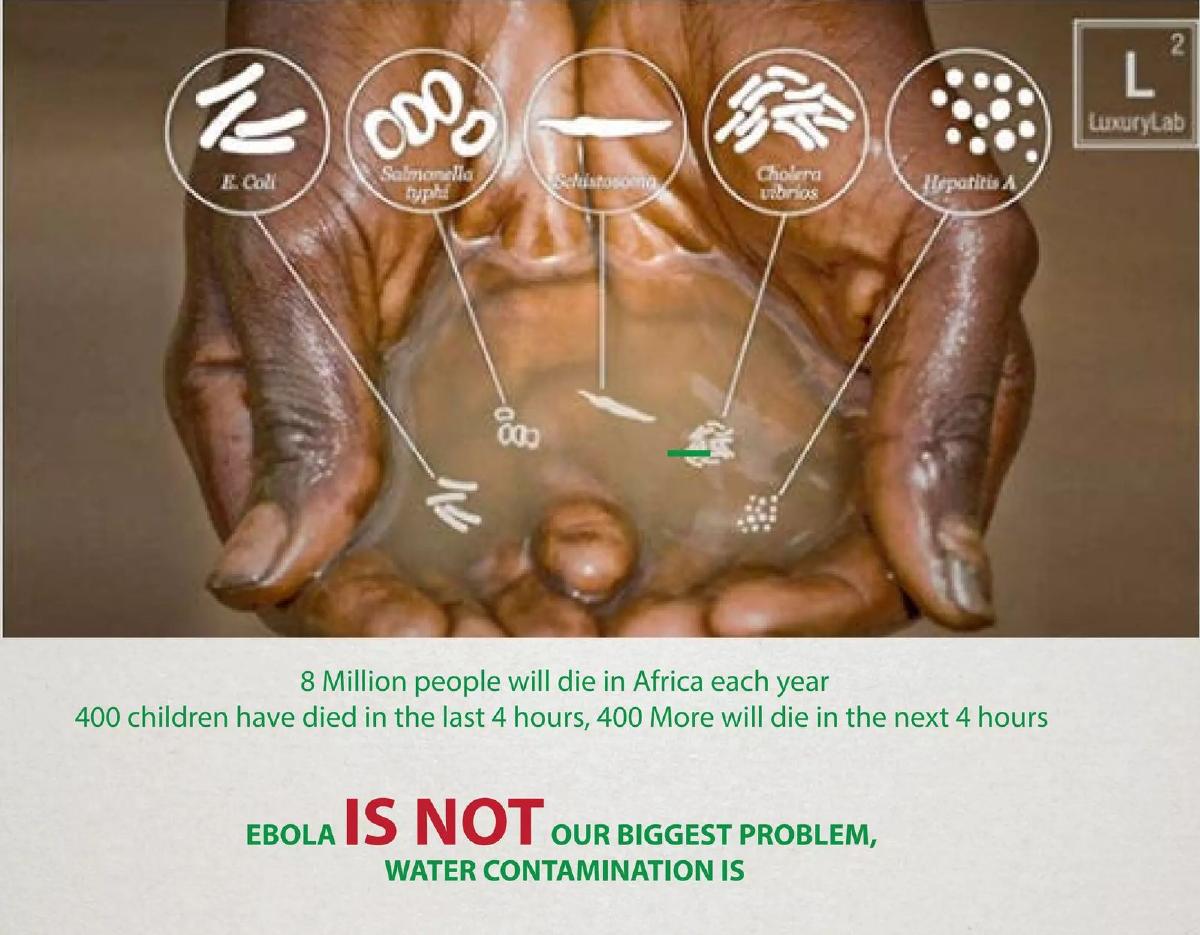
The deck opens with a visceral image of dirty water held in cupped hands, overlaid with icons of pathogens: E. Coli, Salmonella typhi, Schistosoma, Cholera vibrios, and Hepatitis A. The text establishes a high-stakes environment, stating that 8 Million people will die in Africa each year due to water contamination. It further breaks this down into a terrifying frequency: 400 children have died in the last 4 hours , with 400 more expected in the next 4 hours. The slide concludes with a provocative statement: EBOLA IS NOT OUR BIGGEST PROBLEM, WATER CONTAMINATION IS . This positioning is designed to reframe the investor's perspective on African health crises, prioritizing water infrastructure over more publicized viral outbreaks.
Slide 2: The Inefficiency of Current Systems
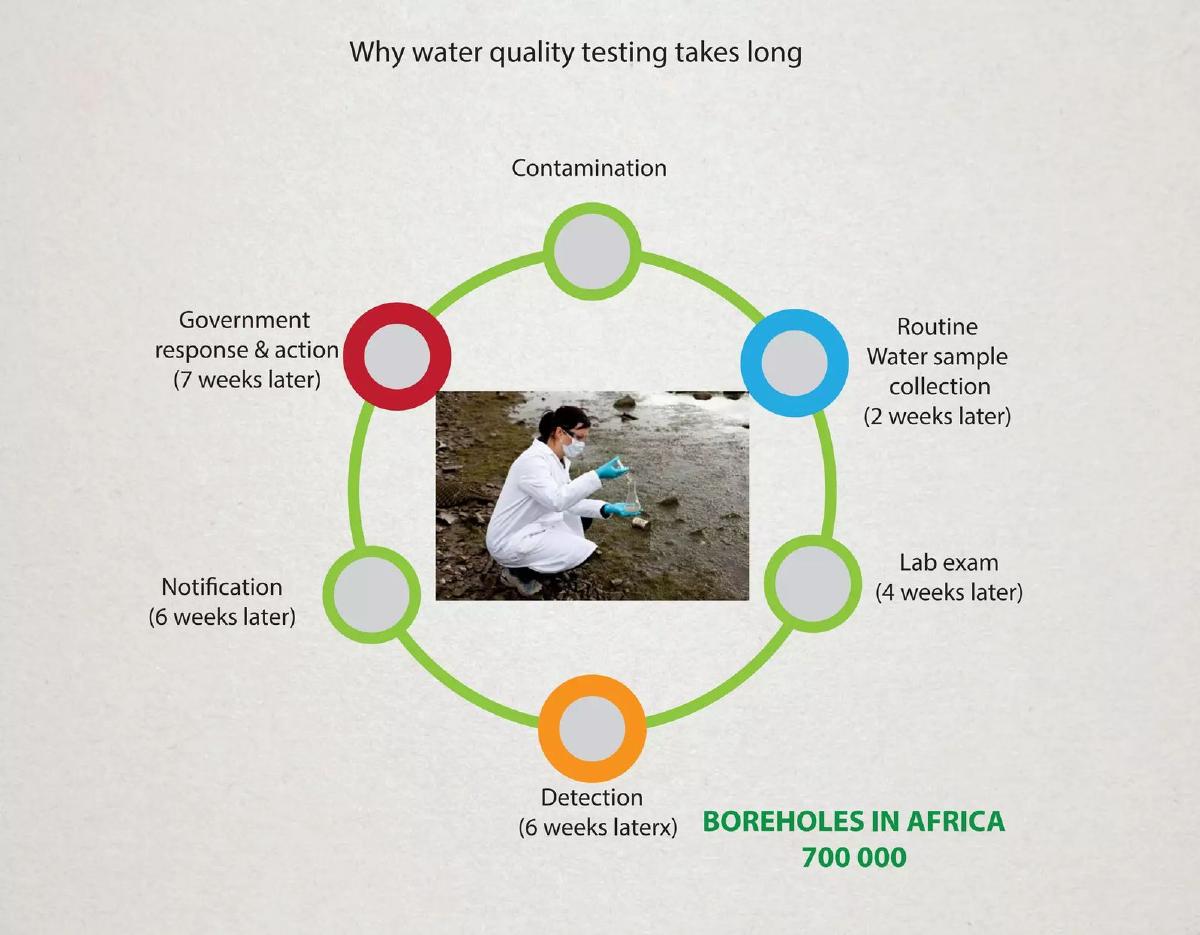
This slide illustrates the 'Why water quality testing takes long' cycle. It depicts a six-stage circular process: Contamination, Routine Water sample collection (2 weeks later), Lab exam (4 weeks later), Detection (6 weeks later), Notification (6 weeks later), and finally, Government response & action (7 weeks later). In the corner, the figure 700,000 BOREHOLES IN AFRICA is introduced, providing a scale for the potential deployment of a better solution. The central image shows a technician manually sampling water, highlighting the labor-intensive nature of the status quo.
The Solution: Real-Time Monitoring
Slide 3: Shortening the Cycle
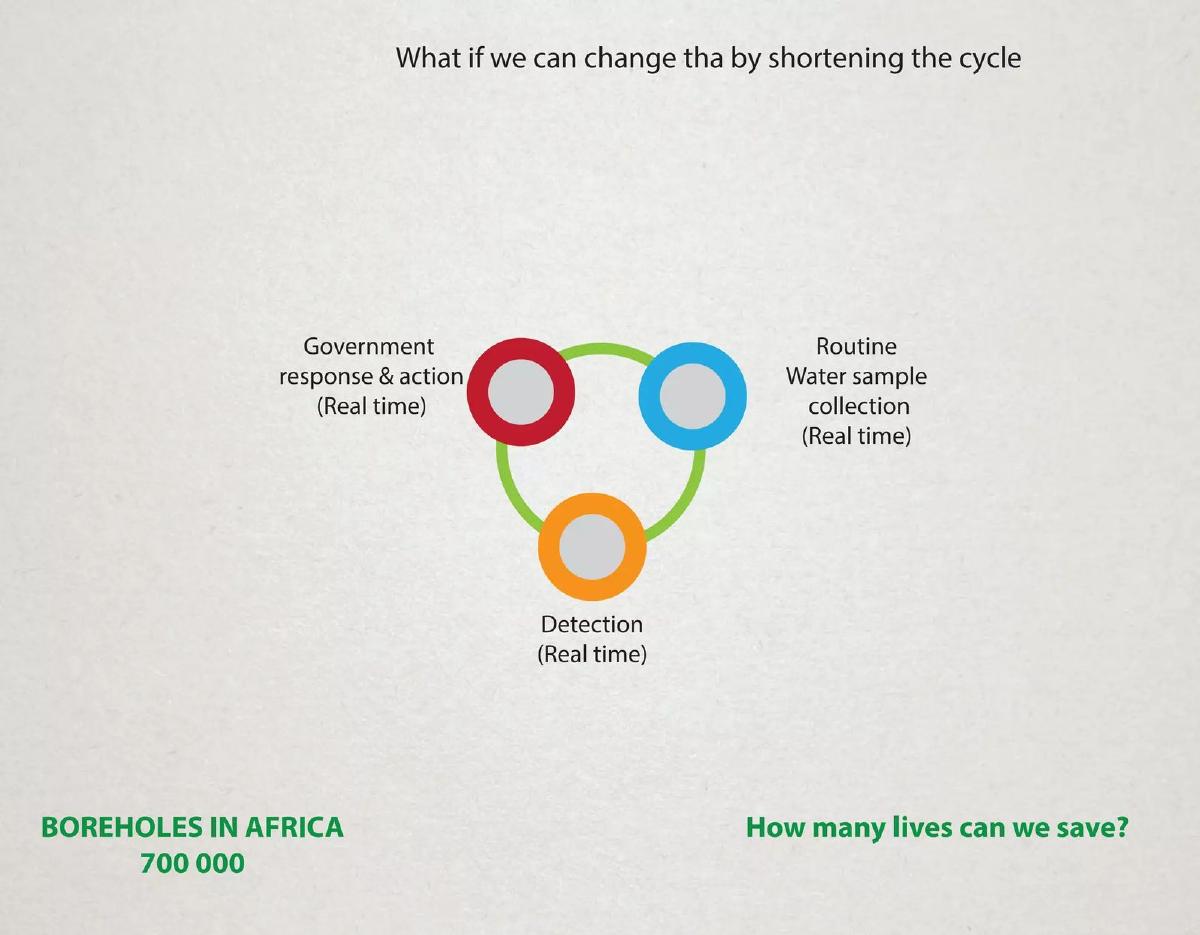
E maji proposes a simplified, three-part 'Real time' cycle to replace the seven-week manual process. The new loop consists of: Routine Water sample collection (Real time) , Detection (Real time) , and Government response & action (Real time) . The slide asks the rhetorical question, 'How many lives can we save?' while repeating the 700,000 borehole figure. This slide is the core value proposition: the transition from weeks of delay to instantaneous awareness.
Slide 4: Technical Implementation
This slide provides a high-level overview of the hardware and software stack. It lists components including Water Sensor, Probes and valves , which feed into a Wasp Mote, battery and solar unit. The data is processed via C/C++ programming and transmitted through a GPRS/GPS/3G module . The final destination is a Google Map, Cloud Database and internet and other third parties . This technical flow demonstrates that the company has moved beyond a mere concept and has identified the specific hardware components (like the Wasp Mote) required to build the system.
Product and Market Strategy
Slide 5: Product Variants
E maji identifies two distinct product offerings. The first is Pre-Assembled kits , which appear to be finished, ruggedized orange boxes ready for installation on pipes or boreholes. The second is Maker kits , shown as raw circuit boards and components. A photo of two men working on the electronics accompanies the 'Maker kits' label, emphasizing a 'DIY Learning and community empowerment' angle. This dual approach suggests a strategy that targets both high-level infrastructure and grassroots education.
Slide 6: Market Segmentation
The 'Potential Markets' slide lists four primary categories. Business to Government is described as 'The 800-pound gorilla,' indicating it is the primary revenue target. Business to Customer targets households, travelers, and the 'adventurous.' Business to Business targets hotels, schools, retailers, and factories. Finally, the slide lists DATA in large green letters, suggesting that the aggregated information collected by these sensors has independent value. This slide shows a broad, perhaps overly ambitious, range of targets, but it correctly identifies the government as the most significant player in water infrastructure.
Validation and Team
Slide 7: Recognition
The final slide in the provided sequence is a photograph of four team members. One member is holding a certificate that clearly displays a 1st Place laurel. The background features logos for Microsoft and other entities, suggesting this was taken at a hackathon or startup competition. While the slide lacks names, titles, or bios, the visual evidence of winning a competition provides a degree of social proof and technical validation for the project.
What Works and What is Missing
What Works
Urgency and Scale: The deck does an excellent job of establishing the 'Problem' with staggering statistics. By comparing water contamination to Ebola, it creates an immediate sense of priority. · Visualizing the Gap: The contrast between the 7-week manual cycle and the 'Real time' IoT cycle is a powerful way to communicate the value proposition without needing complex jargon. · Hardware Readiness: Showing actual photos of the 'Wasp Mote' and the ruggedized orange enclosures suggests that the team has progressed to the prototyping or small-batch production stage.
What is Missing
Funding Ask: There is no slide indicating how much capital the company is looking to raise or how those funds will be allocated. · Unit Economics: The deck mentions hotels, schools, and governments as markets, but provides no information on the cost to manufacture a kit versus the intended sale price or subscription fee for the data. · Competitive Landscape: The deck assumes E maji is the only solution. It does not address other water filtration companies or existing remote monitoring startups. · Team Bios: While there is a photo of the team, there is no information regarding their technical expertise, engineering backgrounds, or previous experience in the African water sector. · Traction Metrics: Beyond the 1st place award, there are no details on pilot programs, number of units currently deployed, or letters of intent from the '800-pound gorilla' (government).
Founder's Guide: What to Copy
The 'Current State vs. Future State' Diagram: Slide 2 and 3 are excellent examples of how to visualize a process improvement. Founders should copy the method of showing exactly how many weeks/days are saved by their intervention. · Hardware Transparency: If you are building an IoT startup, showing the components (sensors, modules, power source) as E maji does on Slide 4 helps de-risk the technical side for investors. · Market Hierarchy: Identifying a primary 'gorilla' market (B2G) while acknowledging secondary markets (B2B, B2C) shows a sophisticated understanding of how a product might scale across different sectors.
Frequently asked questions
- What is the core technology behind E maji?
- E maji utilizes an IoT hardware stack consisting of water sensors, probes, and valves connected to a 'Wasp Mote' (a modular wireless sensor platform). This is powered by a battery and solar panel. Data is transmitted via a GPRS/GPS/3G module to a cloud database and visualized through Google Maps for real-time monitoring by third parties or government agencies.
- How does E maji plan to make money?
- The deck outlines a multi-pronged revenue strategy. This includes 'Business to Government' (B2G) for large-scale borehole monitoring, 'Business to Business' (B2B) sales to hotels, schools, and factories, and 'Business to Customer' (B2C) sales to households and travelers. Additionally, they identify 'DATA' as a standalone potential market, implying the sale of water quality insights.
- What specific problem in the current water testing system does E maji solve?
- According to Slide 3, the current manual testing process is fragmented and slow. It takes 2 weeks for sample collection, 4 weeks for lab exams, and 6 weeks for notification. E maji aims to replace this entire 7-week lag with a 'Real time' loop of collection, detection, and government response, potentially saving lives by closing the gap between contamination and action.
- Who is the target audience for the 'Maker kits'?
- The 'Maker kits' are designed for 'DIY Learning and community empowerment.' Slide 7 shows a photo of two individuals working directly with circuit boards and components. This suggests a grassroots approach where local communities can build and maintain their own monitoring systems, rather than relying solely on pre-assembled imported hardware.
- Is there evidence of traction or a team in the deck?
- The deck includes a team photo (Slide 10) showing four individuals holding a '1st Place' award certificate. While the names and roles of the team members are not listed on the slide, the photo serves as proof of concept validation and suggests the project has participated in and won startup or innovation competitions.