Virtual QE is a service-oriented company providing 'Video Work Instructions' to manufacturers in highly regulated sectors. The deck, dated 2018, identifies a $436 billion market opportunity in manufacturing quality, arguing that traditional text-based instructions lead to inconsistent results and lost revenue. Their solution involves clients capturing operations via recording glasses, which Virtual QE then converts into formal instructions. The business model relies on a $450 per-instruction implementation fee and recurring maintenance fees, projecting a jump from $265 million to over $11 bil…
Key takeaways
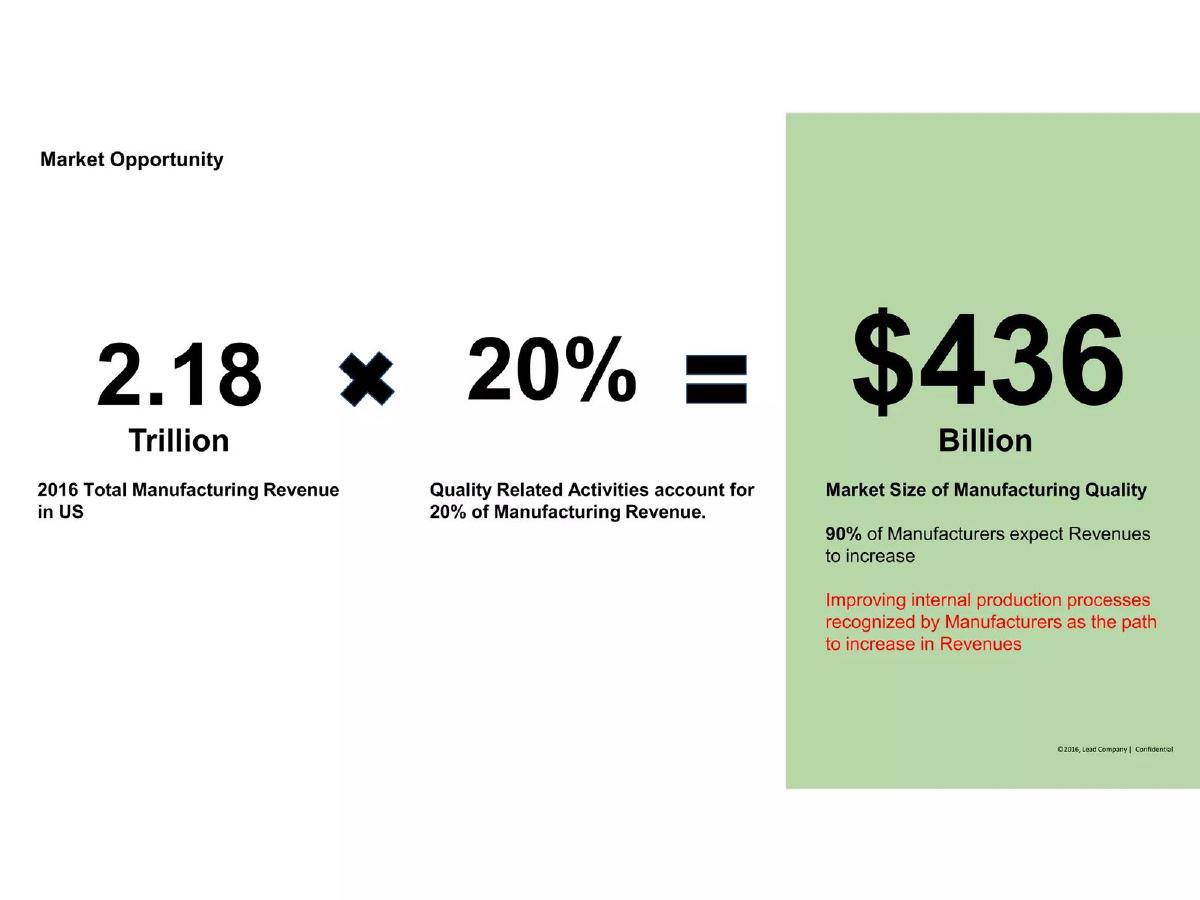
- The market size for manufacturing quality is calculated as 20% of the $2.18 trillion US manufacturing revenue, totaling $436 billion (Slide 3).
- The solution requires clients to use recording glasses to capture operations, which Virtual QE then processes into instructions (Slide 5).
- Pricing is set at $450 per Video Work Instruction, which the company claims offers a 56% profit margin (Slide 6).
- Lifetime value per customer is segmented by manufacturer size, with large manufacturers (> $1B revenue) estimated at $2.25M in Year 1 (Slide 7).
- The company claims a high sales success rate, stating that 25 out of 27 companies wanted to move forward after a product demo (Slide 8).
- Revenue projections are exceptionally aggressive, starting at $265 million in 2018 and reaching $11.9 billion by 2023 (Slide 10).
- The competitive landscape identifies TUV, BSI, and UL as 'ineffective' and 'vague' compared to Virtual QE's 'specific' solutions (Slide 11).
- The deck omits a dedicated team slide, an executive summary, and a specific financial ask for investors.
Virtual QE Pitch Deck Analysis
Slide 1: Title Slide
The deck opens with a minimalist title slide: "Video Work Instructions Pitch Deck." The company name, Virtual QE LLC , is displayed with a four-color cross-shaped logo. A copyright notice for 2018 is present at the bottom.
Slide 2: Introduction
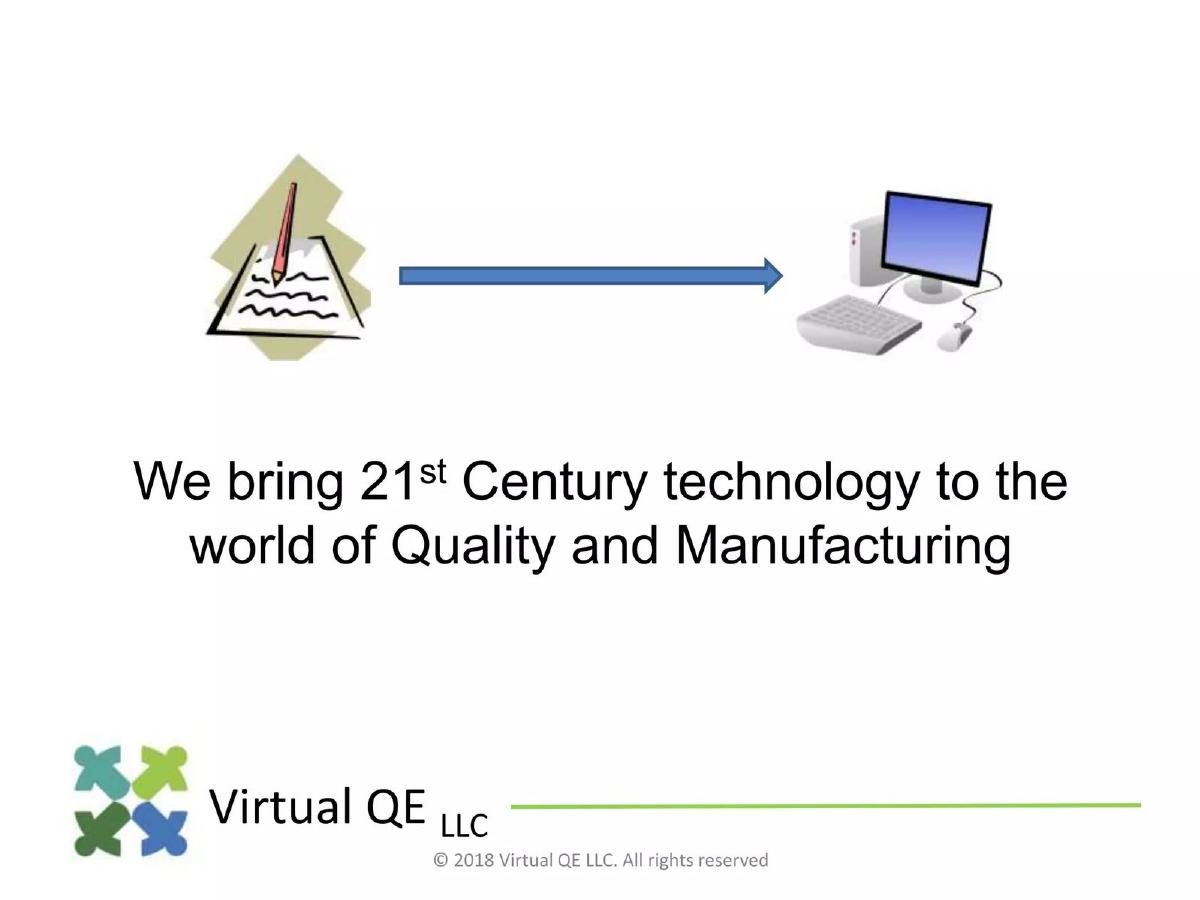
This slide features a simple clip-art graphic showing a transition from a paper-and-pencil icon to a desktop computer. The text states: "We bring 21st Century technology to the world of Quality and Manufacturing." This serves as a high-level mission statement but lacks specific detail on the technology itself.
Slide 3: Market Opportunity
Virtual QE calculates its market opportunity using a top-down approach. It cites a 2016 Total Manufacturing Revenue in US of $2.18 Trillion . By applying a factor of 20% (representing quality-related activities), it arrives at a $436 Billion Market Size of Manufacturing Quality . The slide also notes that 90% of manufacturers expect revenues to increase and recognize improving internal production processes as the path to that growth.
Slide 4: Problem and Current Solutions
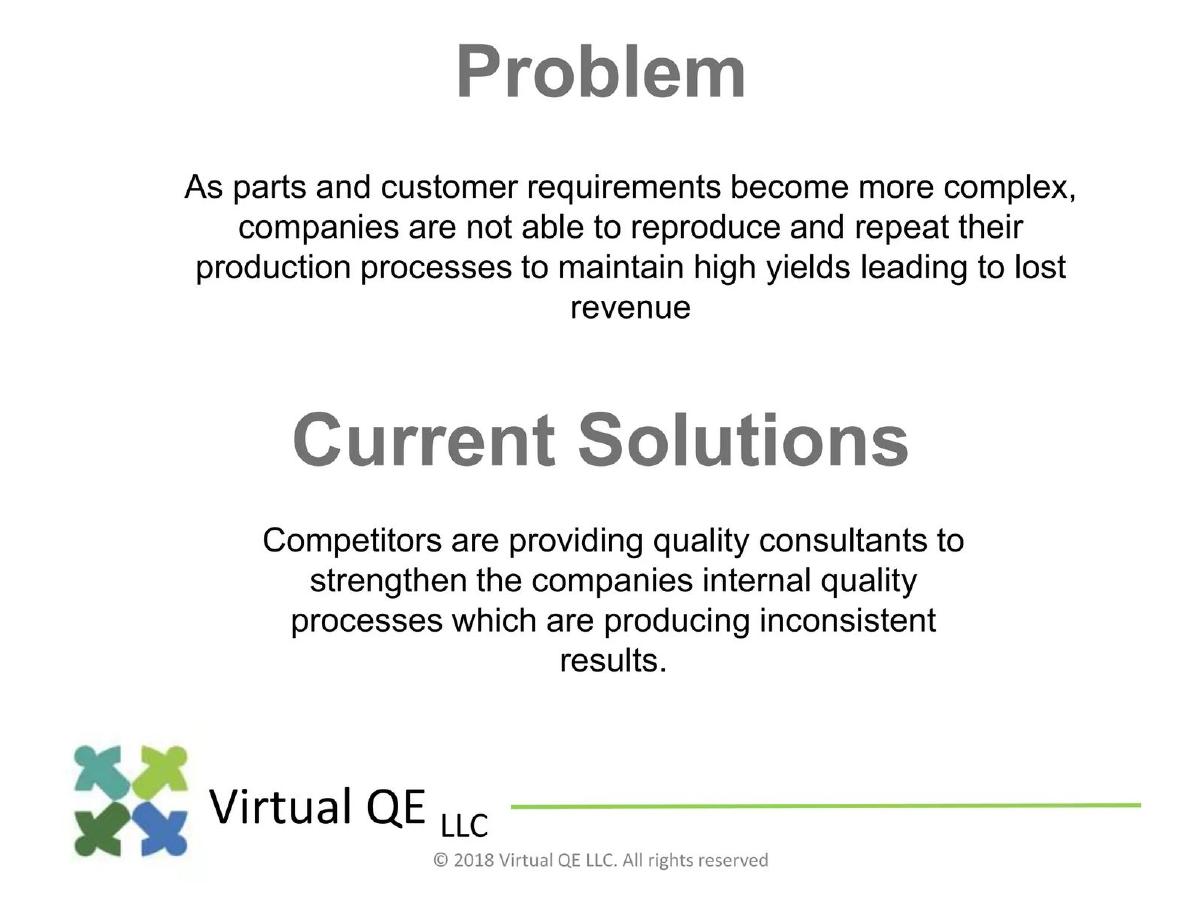
The problem is defined as the inability of companies to reproduce and repeat production processes as parts and customer requirements become more complex, leading to lost revenue. The "Current Solutions" section criticizes competitors for providing quality consultants who produce "inconsistent results." This sets up a narrative where human-led consulting is the primary failure point.
Slide 5: Our Solution
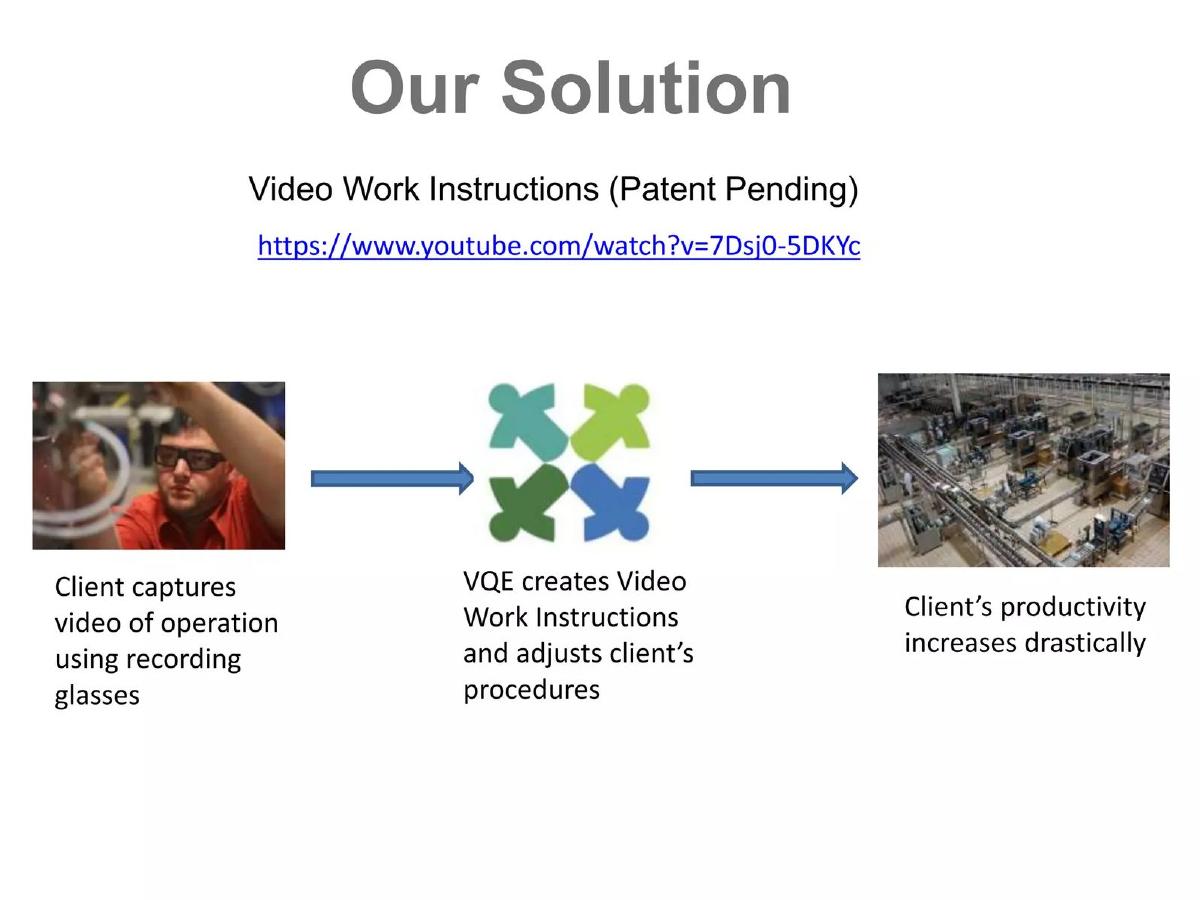
The solution is "Video Work Instructions (Patent Pending)." A three-step flowchart explains the process: 1. Client captures video of operation using recording glasses. 2. VQE creates Video Work Instructions and adjusts client's procedures. 3. Client's productivity increases drastically. A YouTube link is provided for a demo, though the slide itself relies on static images of a factory floor and a worker wearing glasses.
Slide 6: Revenue Model - Pricing
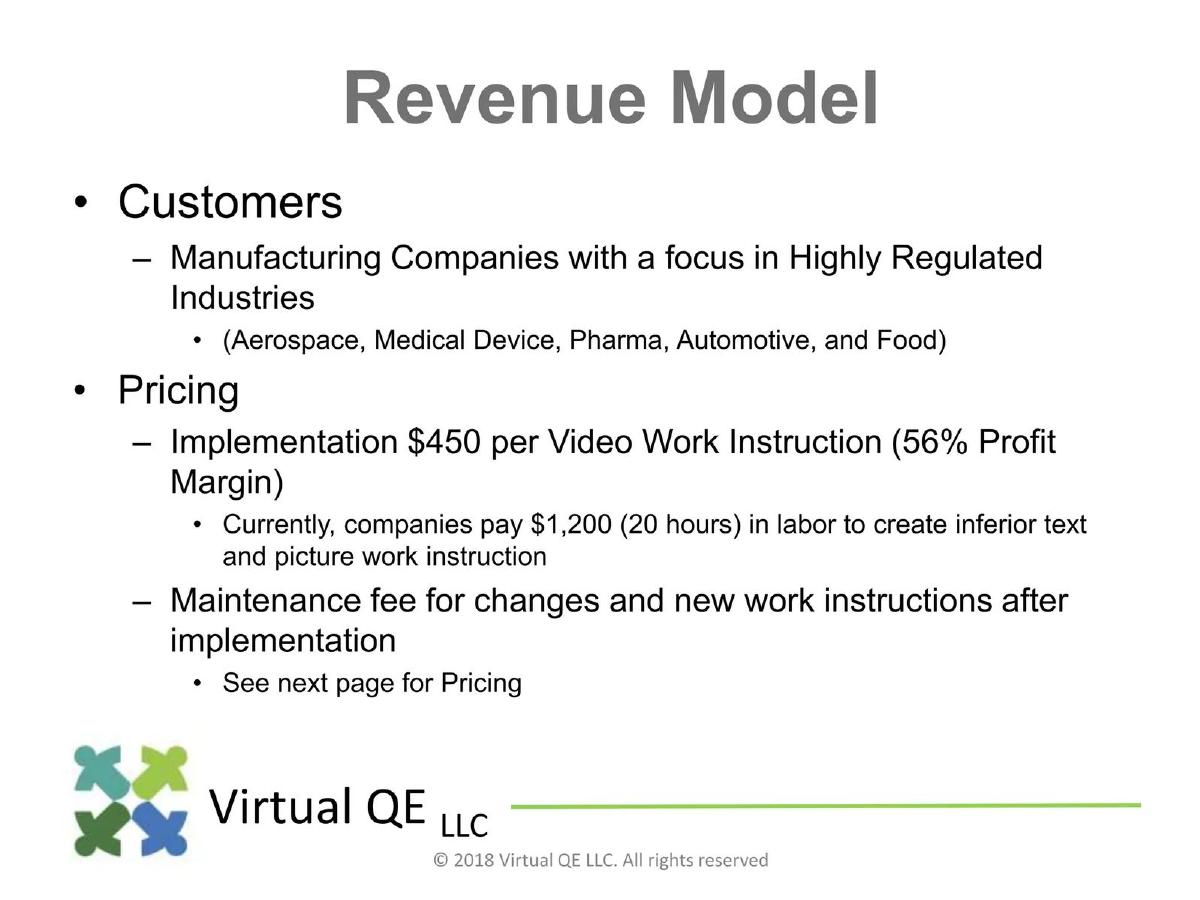
This slide details the customer focus (Aerospace, Medical Device, Pharma, Automotive, and Food) and the pricing structure. The implementation fee is $450 per Video Work Instruction , which the company claims yields a 56% Profit Margin . It contrasts this with a current market cost of $1,200 (20 hours of labor) for traditional text and picture instructions. A maintenance fee is also mentioned but not priced on this slide.
Slide 7: Revenue Model - Lifetime Value
Virtual QE segments Lifetime Value (LTV) by manufacturer size. For a Small Manufacturer ( , Year 1 revenue is estimated at $90,000 . For a Medium Manufacturer ($100M-$999M) , it is $450,000 . For a Large Manufacturer (>$1 Billion) , the Year 1 estimate is $2,250,000 . The slide also specifies that payments are accepted via ACH and Credit Card, which is an unusual level of operational detail for a high-level pitch deck.
Slide 8: Marketing & Growth Strategy - Conversion
This slide focuses on sales traction. It claims that "25 out of 27 companies want to move forward" after being presented with a product demo. The stated conversion strategy is to "use all connections to obtain conference call or in-person meeting for product demo." This suggests a heavily relationship-based sales model.
Slide 9: Marketing & Growth Strategy - Channels
A hierarchy chart outlines "Channels to Connections." It includes Consulting (Supplier Quality, ISO Auditing), Training (Purchase CALISO), LinkedIn (Quality Consultants, Quality Professionals), and Conferences (Expo, Workshops). A note at the bottom indicates that items in orange (Purchase CALISO) are "not yet completed." The numbers listed (e.g., 20,000 Contacts, 6,000 Referrals) represent the scale of the target audience within these channels.
Slide 10: Revenue Projections
The projections are presented in a simple table. The company forecasts $265 Million in 2018 , growing to $1.327 Billion in 2019 , and reaching $11.947 Billion by 2023 . These are exceptionally high figures for a service-based business model, and the deck provides no explanation for the massive scale-up in production capacity required to generate $11 billion in $450 increments.
Slide 11: The Competitive Landscape
A standard four-quadrant chart plots "Effectiveness" against "Specificity of Initiatives." Virtual QE places itself in the top-right (High Effectiveness, High Specificity). Competitors like TUV, BSI, and UL are placed in the top-left (High Effectiveness, Low Specificity), while Maetrics and Validant are in the bottom-right. The key insight provided is that competitors' offerings are "vague and ineffective."
Slide 12: Customer Profile
This slide reiterates the target industries (Aerospace, Medical Device, Pharma, Automotive, and Food) and clarifies that the size range spans from startups to Fortune 500 companies. This is largely a repetition of information from Slide 6.
Slide 13: Questions
The final slide provides contact information for Shawn Findlater . There is no closing summary or call to action.
What Works in This Deck
Specific Pricing: The deck does not hide its pricing. By stating the $450 per instruction fee and comparing it to the $1,200 cost of traditional methods, the founders provide a clear value proposition based on cost savings (Slide 6).
Niche Targeting: Focusing on "Highly Regulated Industries" is a smart move. These sectors have a mandatory requirement for rigorous documentation, making the "Video Work Instruction" more than just a luxury; it is a compliance tool.
Sales Traction: The claim that 25 out of 27 demos resulted in a desire to move forward (Slide 8) is a strong indicator of product-market fit, assuming the data is accurate and the "move forward" translates to paid contracts.
What Is Missing or Problematic
The Missing Team Slide: Perhaps the most significant omission is a team slide. In early-stage fundraising, investors bet on the founders. There is no information regarding the technical or manufacturing background of Shawn Findlater or any other team members.
Unrealistic Projections: Projecting $11.9 billion in revenue within five years (Slide 10) for a service that requires manual video processing and adjustment of client procedures is highly suspect. To reach $11.9 billion at $450 per instruction, the company would need to produce over 26 million instructions per year. The deck does not explain how they will achieve this level of automation or labor scale.
Lack of an 'Ask': The deck never specifies how much money is being raised, what the valuation is, or how the funds will be used. Without an 'Ask,' it functions more like a sales presentation than a fundraising pitch.
Operational Complexity: The solution requires clients to use "recording glasses." This introduces hardware friction. The deck does not address who provides the glasses, how they are managed, or the technical hurdles of capturing high-quality video in diverse manufacturing environments.
Founder Takeaways
Ground your projections in reality: While big numbers look good on a slide, they must be supported by a logical growth plan. If your revenue is tied to manual labor or service hours, you cannot project multi-billion dollar revenues without a massive hiring plan or a breakthrough in AI automation. · Include the team: Never omit the team slide. Investors need to know why you are the right person to solve this specific problem, especially in a technical field like manufacturing quality. · Clarify the 'Ask': If the goal is to raise money, tell the investor exactly what you need and what milestones that money will help you reach. · Show, don't just tell, the technology: For a product based on video, the deck would benefit from actual screenshots of the final "Video Work Instruction" product to show how it differs from a standard YouTube video.
Frequently asked questions
- What is the core product of Virtual QE?
- Virtual QE provides 'Video Work Instructions.' According to Slide 5, the process involves the client capturing video of a manufacturing operation using recording glasses. Virtual QE then takes that footage to create formal work instructions and adjust the client's existing procedures to improve productivity.
- How does Virtual QE generate revenue?
- The revenue model is two-fold: an implementation fee of $450 per video work instruction and a recurring maintenance fee for changes or new instructions. Slide 6 notes that this $450 price point competes against a traditional cost of $1,200 for text and picture instructions, while maintaining a 56% profit margin.
- Who are the target customers for this service?
- Virtual QE targets manufacturing companies in highly regulated industries. Slide 6 and Slide 12 specifically list Aerospace, Medical Device, Pharma, Automotive, and Food. The company aims to serve a range of sizes, from startups to Fortune 500 manufacturing companies.
- Are the revenue projections realistic based on the deck?
- The projections on Slide 10 are extremely ambitious, forecasting growth from $265 million in 2018 to $11.9 billion in 2023. However, the deck does not explain the headcount or infrastructure required to produce the volume of videos necessary to reach these figures, especially given the service-heavy nature of the 'implementation' model.
- What information is missing from the pitch deck?
- The deck lacks several standard components: there is no team slide to establish founder credibility, no 'Ask' slide detailing how much capital is being raised, and no breakdown of unit economics beyond the gross margin. It also lacks a clear roadmap for technological automation versus manual video editing.