The Pair pitch deck is a masterclass in 'show, don't tell' for a technical product. Spanning 12 slides, the presentation leans heavily on full-bleed imagery and high-impact metrics to demonstrate the utility of its markerless Augmented Reality (AR) platform. Founded in 2012, the company successfully pivoted from architectural drafting (as Visidraft) to consumer-facing furniture visualization. The deck highlights a significant traction milestone: growing from 774 to 10,451 Monthly Active Users (MAU) in just six months. By anchoring their value proposition in a massive catalog expansion—jumping…
Key takeaways
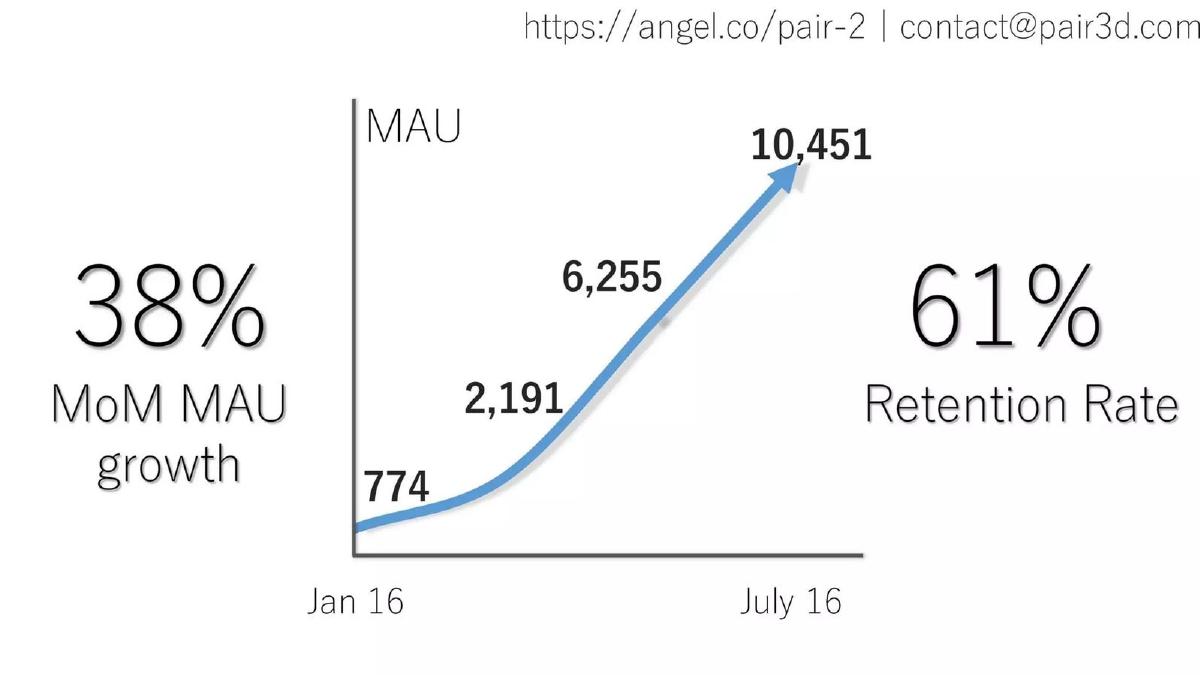
- The company demonstrated a 38% month-over-month MAU growth between January and July 2016 (Slide 3).
- Pair achieved a 61% retention rate, significantly higher than typical mobile engagement benchmarks (Slide 3).
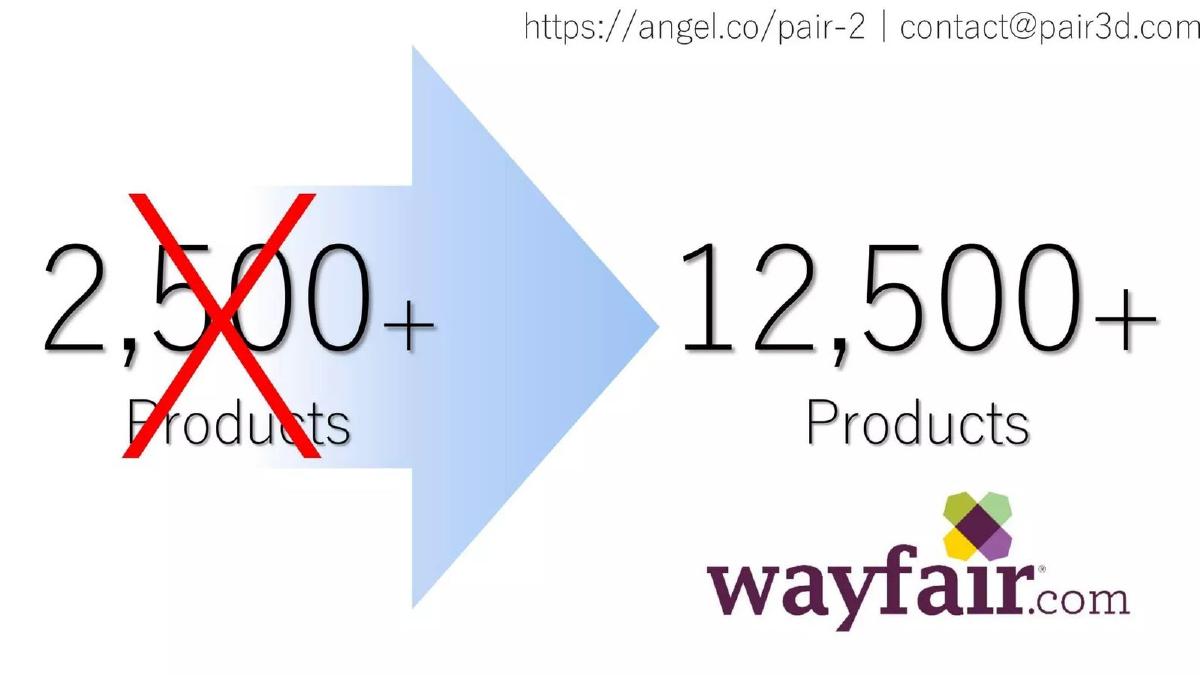
- A strategic partnership with Wayfair expanded their product catalog from 2,500 to over 12,500 items (Slide 5).
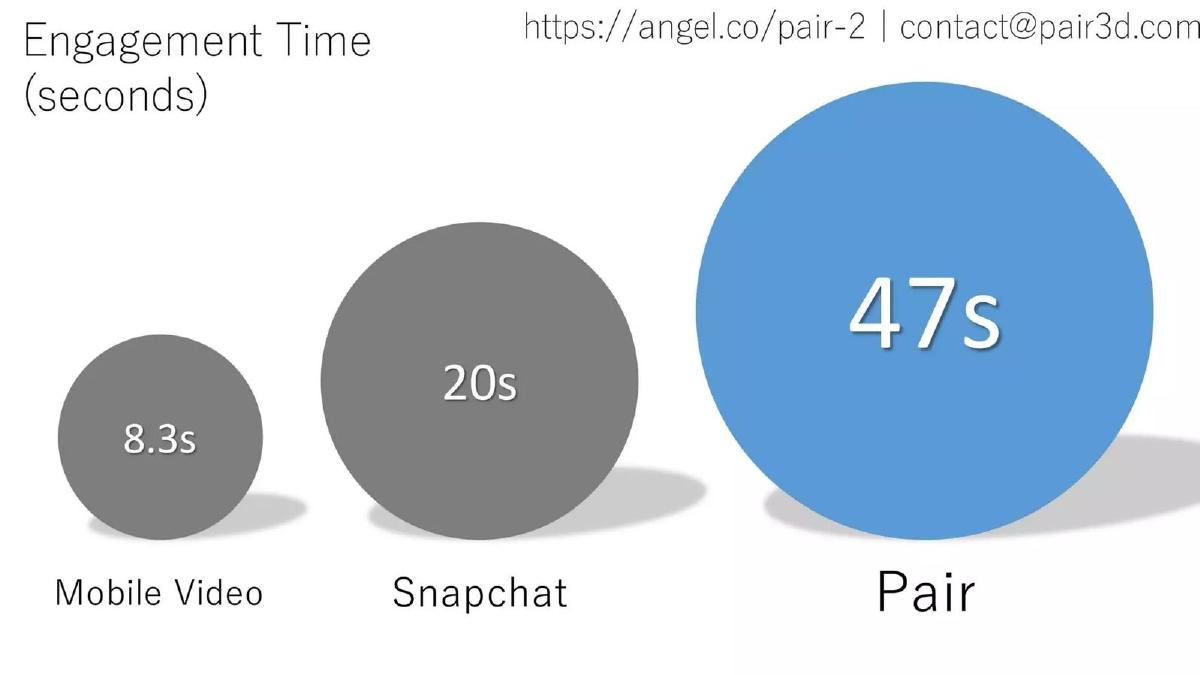
- User engagement time on Pair averaged 47 seconds, more than double that of Snapchat at the time (Slide 6).
- The technology utilizes markerless AR, allowing users to place and measure 3D objects in real-time without physical cues (Slide 2).
- The team slide features logos from high-prestige organizations including the U.S. Air Force, WB Games, and Gensler (Slide 11).
- The deck uses minimal text, relying on large-scale product demonstrations to explain complex spatial mapping technology (Slides 7-10).
- There is a total absence of a business model, competition analysis, or funding request within the 12 slides.
The Visual-First Approach to AR Fundraising
The Pair (formerly Visidraft) pitch deck is an artifact from the early days of mobile Augmented Reality. At a time when AR was often seen as a gimmick, Pair needed to prove that their technology was both functional and engaging. They achieved this by stripping away the jargon and letting the product visuals do the heavy lifting. With only 12 slides, the deck moves quickly from 'what it is' to 'how fast it is growing.'
Slides 1-2: The Hook and the Product in Action
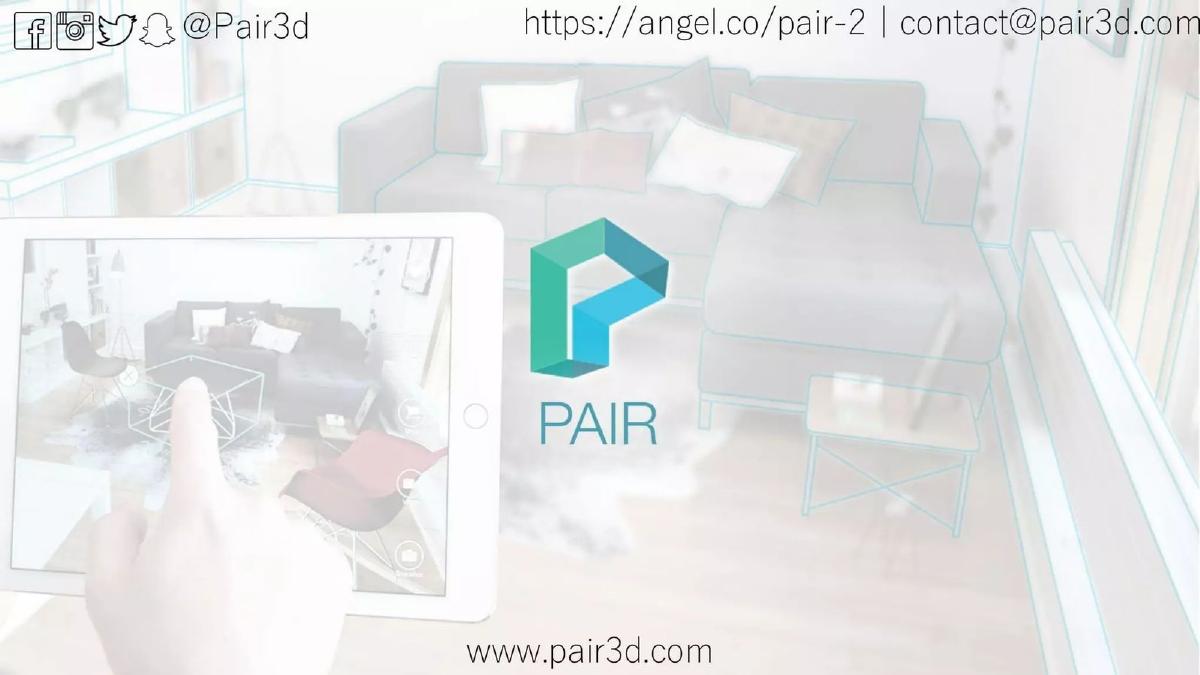
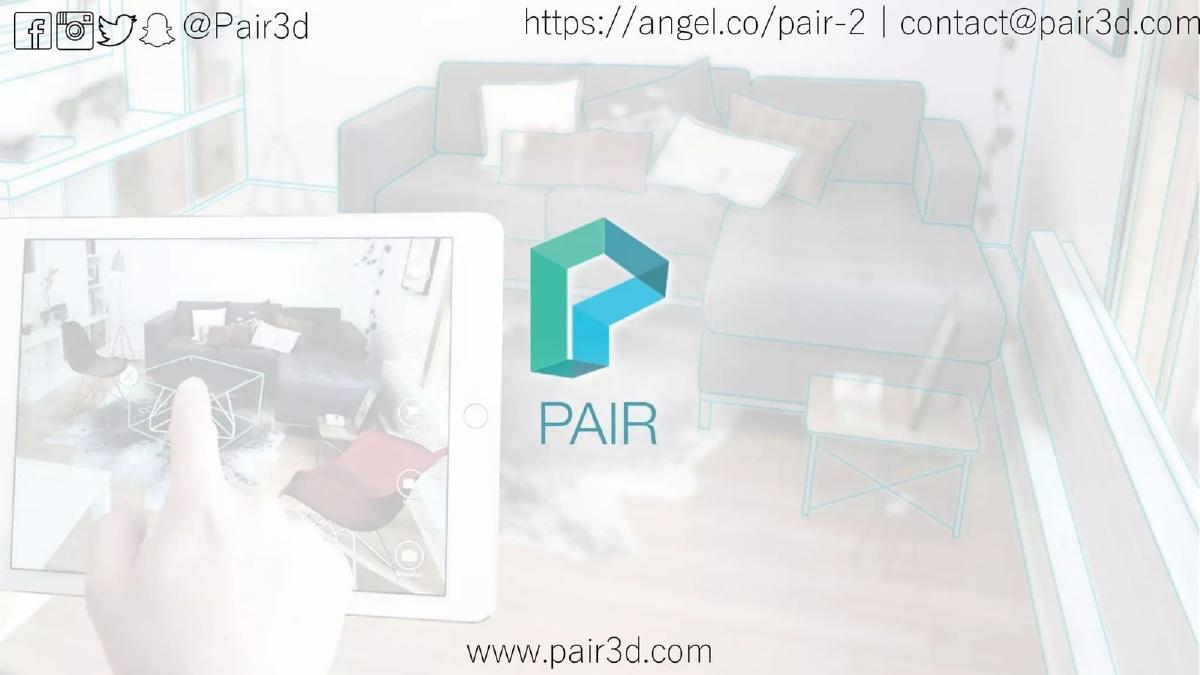
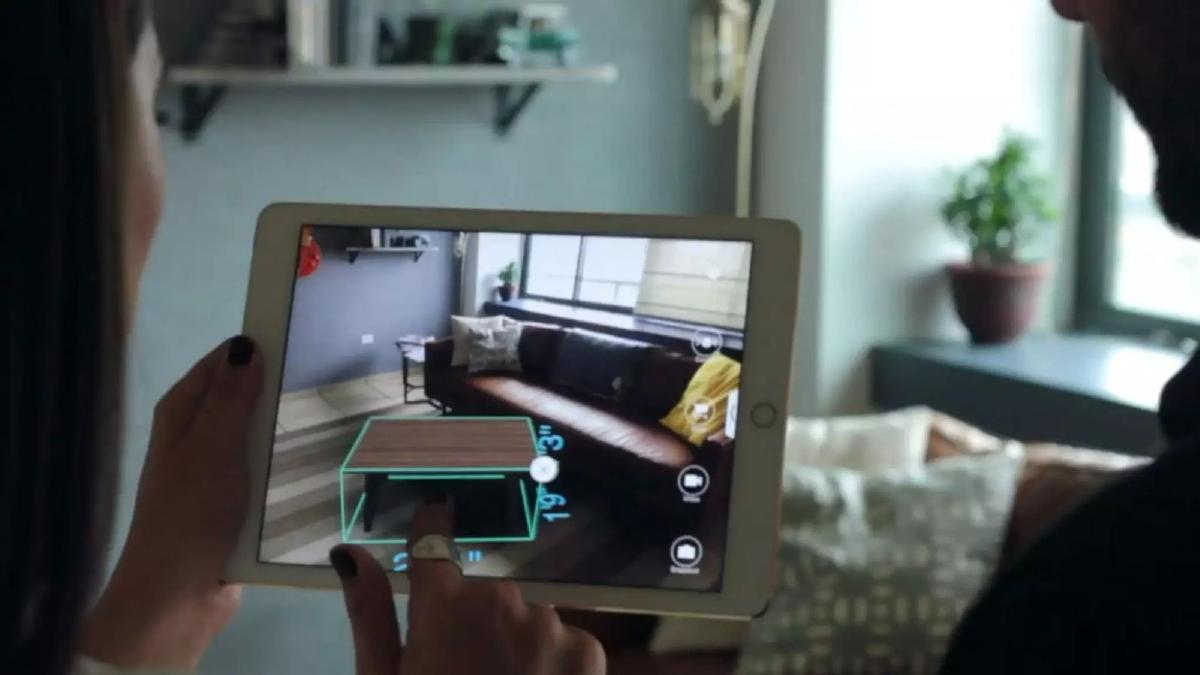
Slide 1 serves as a clean title card featuring the logo and a background image of the app in use. It immediately establishes the context: a tablet being used to overlay digital outlines onto a physical living room. Slide 2 is a full-bleed photograph that serves as a silent demo. It shows a user's finger interacting with a 3D coffee table on an iPad screen. Notably, the screen displays a real-time measurement ('19" 3"'), highlighting the utility of the tool for spatial planning rather than just aesthetic visualization.
Slide 3: The Traction Inflection Point
This is arguably the most important slide in the deck. Slide 3 presents a Monthly Active User (MAU) graph that shows a classic 'hockey stick' growth curve. The numbers are specific: starting at 774 in January 2016 and climbing to 10,451 by July 2016. Flanking the graph are two critical KPIs: 38% MoM MAU growth and a 61% Retention Rate . For a Seed stage startup, a 61% retention rate is an elite metric, signaling to investors that once a user tries the AR experience, they find enough value to return.
Slides 4-5: Scaling the Catalog
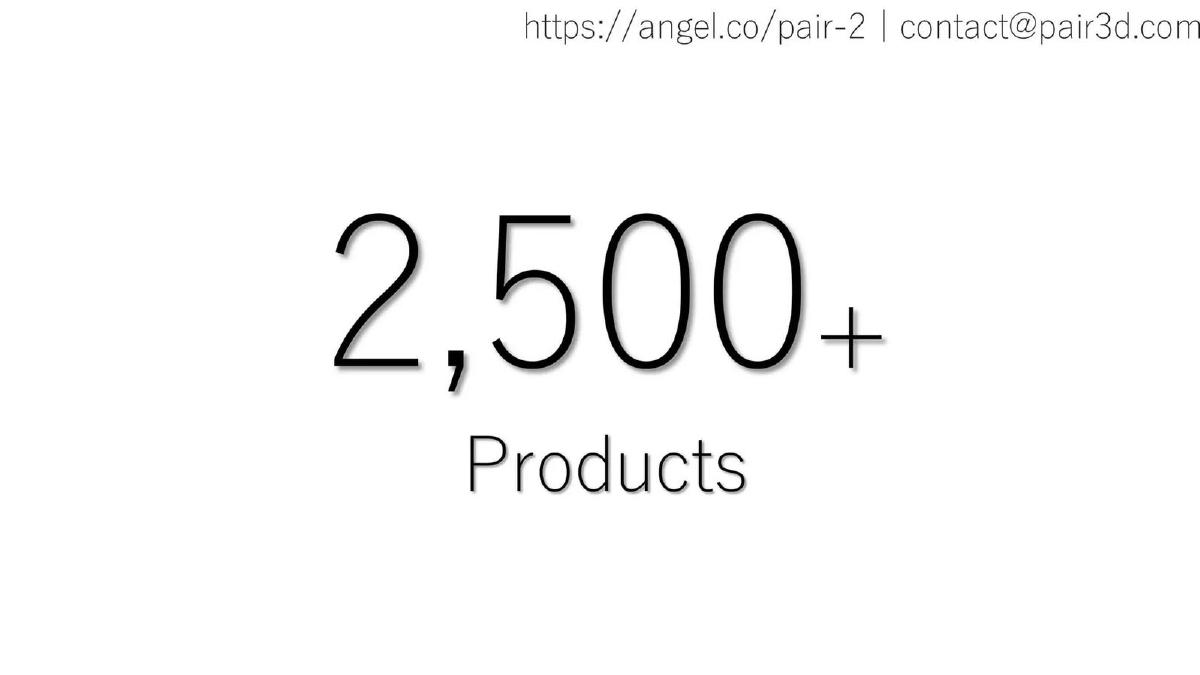
Slide 4 simply states '2,500+ Products,' which is immediately followed by Slide 5 , showing a transition to '12,500+ Products' with the Wayfair.com logo. This sequence tells a story of rapid scale. By partnering with a major retailer like Wayfair, Pair solved the 'content problem' that plagues many AR platforms. They weren't just a tool; they were a gateway to a massive inventory of purchasable goods.
Slide 6: The Engagement Benchmark
Slide 6 uses a bubble chart to compare 'Engagement Time (seconds).' It places Pair (47s) against Snapchat (20s) and Mobile Video (8.3s). This is a bold comparison. By framing their app against the most popular social platform of the era, Pair argues that AR is a more captivating medium. The 47-second average suggests that users are deeply involved in the design process, which is a high-value behavior for advertisers and retailers.
Slides 7-10: Technical Depth and Computer Vision
This middle section of the deck shifts toward the 'how.' Slide 7 shows a point cloud and a camera frustum, representing the underlying SLAM (Simultaneous Localization and Mapping) technology. Slide 8 demonstrates the app's ability to recognize and label existing furniture in a room, such as an 'IKEA Lamp' for $89. This suggests a future where the app isn't just for adding new items, but for auditing existing spaces. Slide 9 and Slide 10 provide further visual evidence of the mapping capabilities, including a 3D mesh of a room and a high-fidelity render of a Tesla Model S in a driveway. These slides prove the technology is versatile enough to handle everything from small furniture to large vehicles.
Slide 11: The Pedigree Slide
The team slide ( Slide 11 ) is notable for what it doesn't include: names and titles. Instead, it features six headshots and a collection of high-authority logos. The inclusion of the U.S. Air Force , WB Games , Gensler , and the University of Alberta Center for Machine Learning suggests a team with deep roots in defense-grade computer vision, AAA gaming graphics, and world-class architecture. This 'logo soup' is a shorthand way to build instant credibility without requiring the investor to read six biographies.
Slide 12: The Visionary Close
The final slide ( Slide 12 ) is a dark, atmospheric shot of an architectural interior. It returns to the company's roots as Visidraft, reminding the audience that while furniture is the current growth engine, the underlying technology is built for the massive architecture and construction industries. It leaves the investor with a sense of the 'big picture' potential beyond just e-commerce.
What Works in the Pair Deck
1. Extreme Brevity: The deck is only 12 slides and contains fewer than 200 words total. It respects the investor's time and forces the focus onto the metrics and the product visuals. 2. Comparative Metrics: Comparing engagement time to Snapchat (Slide 6) provides a relatable benchmark for the 'stickiness' of the product. 3. Proof of Scale: The Wayfair partnership (Slide 5) demonstrates that the company can integrate with major industry players, which de-risks the business model.
What is Missing from the Pair Deck
1. The Business Model: There is no mention of how Pair makes money. Do they charge Wayfair? Do they charge the users? Is it a white-label solution? This is a glaring omission for a Seed round. 2. The Ask: The deck does not state how much money they are raising or what the milestones for the next 18 months will be. 3. Competitive Landscape: In 2012-2016, several AR companies were emerging. Pair does not explain why their markerless SLAM technology is superior to competitors or built-in solutions like Apple's ARKit (which was announced shortly after this period).
What a Founder Should Copy
1. The 'Before and After' Catalog Slide: Slide 5 is a perfect way to show a 'quantum leap' in value. If you have a partnership that changes your scale, give it its own slide. 2. High-Fidelity Demos: Instead of explaining how AR works, Pair showed it. Slides 2, 8, and 10 are excellent examples of using product screenshots to explain complex technical features. 3. The Traction Slide: Slide 3 is a textbook example of how to present growth. It combines a clear visual trend (the graph) with the two most important supporting numbers (MoM growth and Retention).
Frequently asked questions
- What is the primary value proposition of Pair?
- Pair provides a markerless AR tool that allows users to visualize 3D models of furniture and architectural designs within their actual physical environment. As shown on Slide 8, the tool can identify existing furniture (like an IKEA lamp or Wayfair sofa) and overlay pricing and product details, effectively turning a living room into an interactive shopping catalog.
- How did Pair demonstrate traction in this deck?
- Traction is primarily shown through user growth and engagement metrics. Slide 3 illustrates a sharp upward curve in Monthly Active Users, peaking at 10,451 in July 2016. Furthermore, Slide 6 compares Pair's 47-second engagement time against Snapchat (20s) and general mobile video (8.3s), suggesting that the AR experience is highly immersive and sticky for users.
- Who are the key partners mentioned in the deck?
- The most prominent partner is Wayfair.com, which is credited on Slide 5 for increasing Pair’s product count by 500%. The team slide (Slide 11) also implies deep industry connections through logos of former employers or collaborators, including Gensler (architecture), WB Games (software/rendering), and the University of Alberta Center for Machine Learning.
- Is there a clear monetization strategy in the slides?
- No. The deck is entirely focused on product utility and user growth. While Slide 8 shows product prices (e.g., 'Sofa: Grey; Wayfair: $699'), it does not explicitly state if Pair takes a commission on sales, charges a SaaS fee to manufacturers, or uses a different revenue model. This is a common omission in early-stage 'growth' decks.
- What stage of funding was this deck used for?
- According to catalogue data, this was a Seed round where the company raised $250,000. The deck reflects this stage by focusing on early product-market fit and the technical capability of the team rather than mature financial statements or complex market share breakdowns.