Wischoff Ventures Fund III is a $50M early-stage vehicle focused on the intersection of money, movement, and manufacturing. The deck serves as a masterclass in how emerging managers can transition from small, 'spray-and-pray' style first funds to institutional-grade concentrated portfolios. By showcasing a clear evolution from Fund I (0.70% average ownership) to Fund II (4.5% average ownership) on Slide 11, the firm proves its ability to lead rounds and secure meaningful stakes. The deck is notably transparent regarding deal flow metrics, revealing a funnel that includes 50 outbound LinkedIn…
Key takeaways
- The fund targets a $50M raise for Fund III, representing a significant scale-up from the $5M Fund I and $20M Fund II (Slide 2, Slide 11).
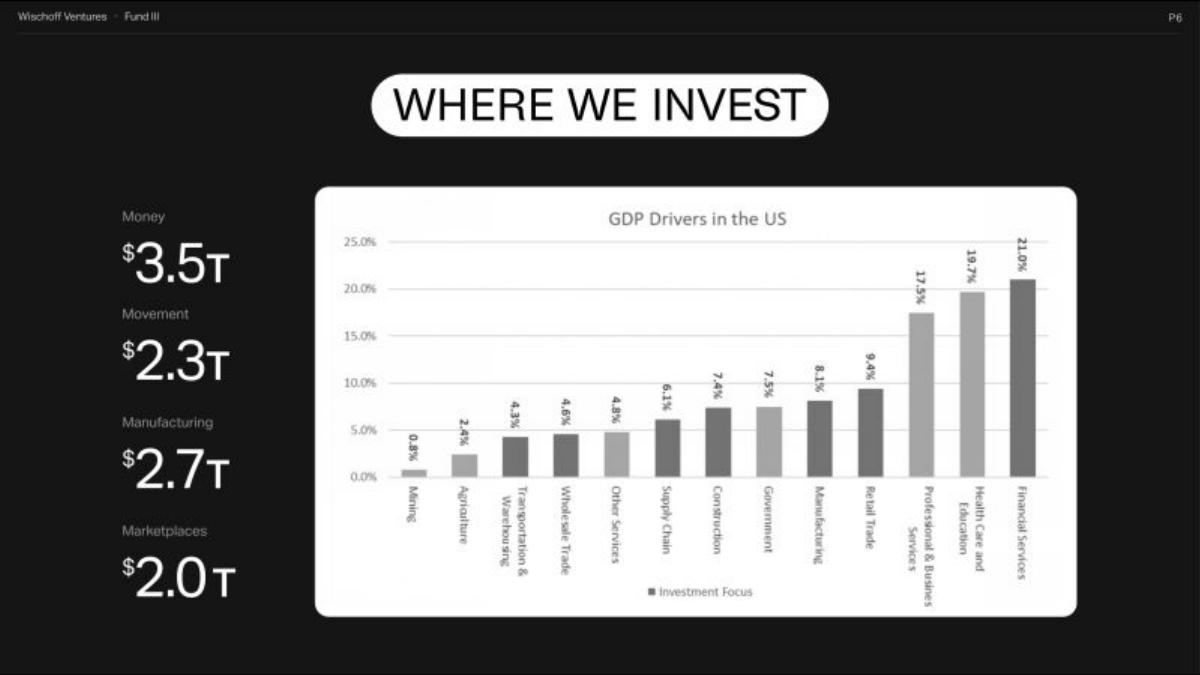
- Investment focus is strictly defined by four GDP drivers: Money ($3.5T), Movement ($2.3T), Manufacturing ($2.7T), and Marketplaces ($2.0T) (Slide 6).
- Track record transparency is high, showing Fund I at 1.40x MOIC and Fund II at 1.22x MOIC with a 25.83% Gross IRR (Slide 11).
- The firm demonstrates a clear strategy shift toward higher conviction, increasing average ownership from 0.70% in Fund I to 4.35% in Fund II (Slide 13).
- Deal flow is quantified through a specific outbound funnel: 50 DMs per week to PMs and Engineers at high-growth startups (Slide 24).
- The deck highlights 'Super Pro-Rata' rights and the ability to lead or co-lead deals as a core evolution of the firm's model (Slide 12).
- Portfolio construction for Fund III targets 30-35 positions with core checks between $800K and $1.6M for 7-10% ownership (Slide 25).
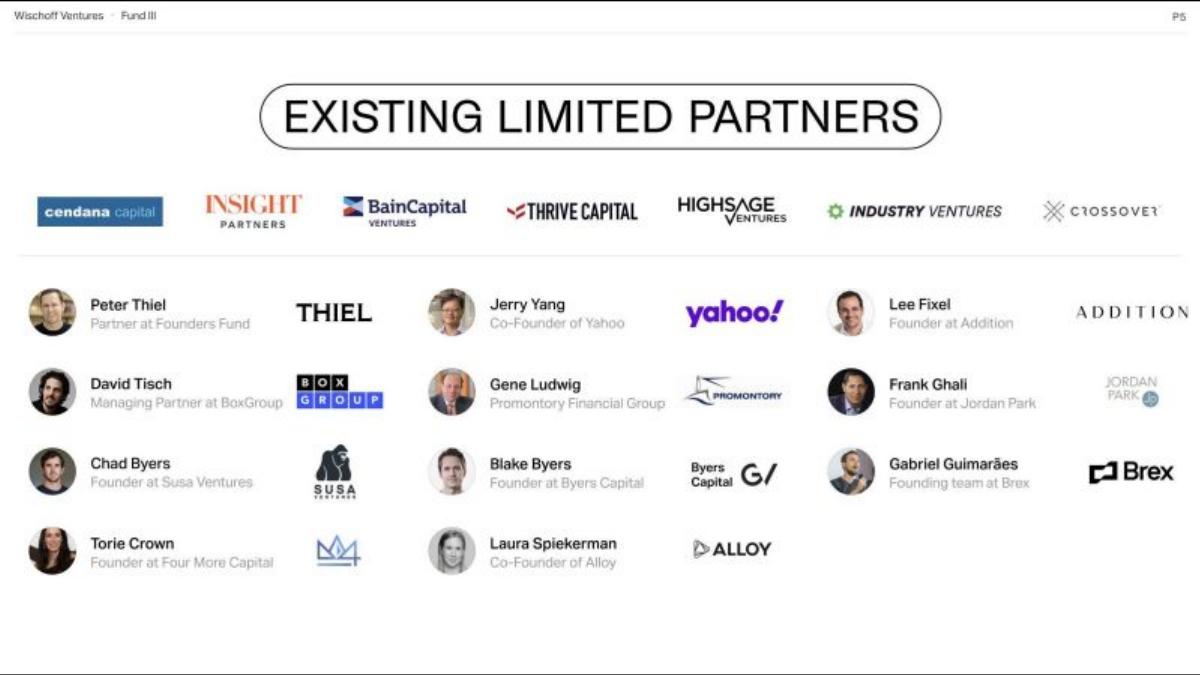
- Social proof is anchored by a heavy-hitting LP list including Cendana Capital, Insight Partners, and individual VCs like Peter Thiel and Lee Fixel (Slide 5).
Executive Summary: The Institutionalization of the Solo GP
The Wischoff Ventures Fund III deck is a compelling example of how an emerging manager builds a bridge between a personal brand and an institutional investment firm. Clocking in at 24 slides, the presentation avoids the typical fluff of 'disruption' and instead focuses on the mechanics of venture capital: sourcing, ownership, and follow-on signaling. The fund is seeking $50M to double down on a thesis centered on 'money, movement, and manufacturing,' targeting the digitization of legacy industries.
Slides 1-5: Identity and Social Proof
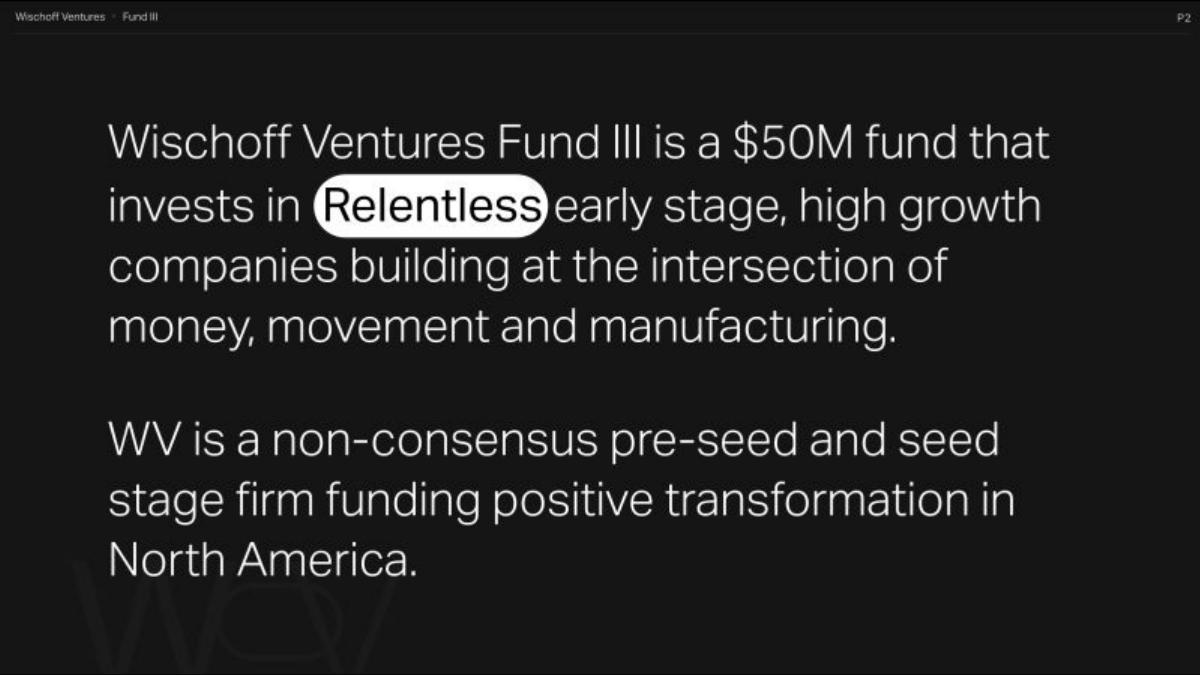
Slide 1 is a minimalist cover. Slide 2 immediately establishes the fund's parameters: a $50M vehicle for 'non-consensus' pre-seed and seed stages in North America. The use of the word 'Relentless' is highlighted, setting a tonal expectation for the GP's operating style.
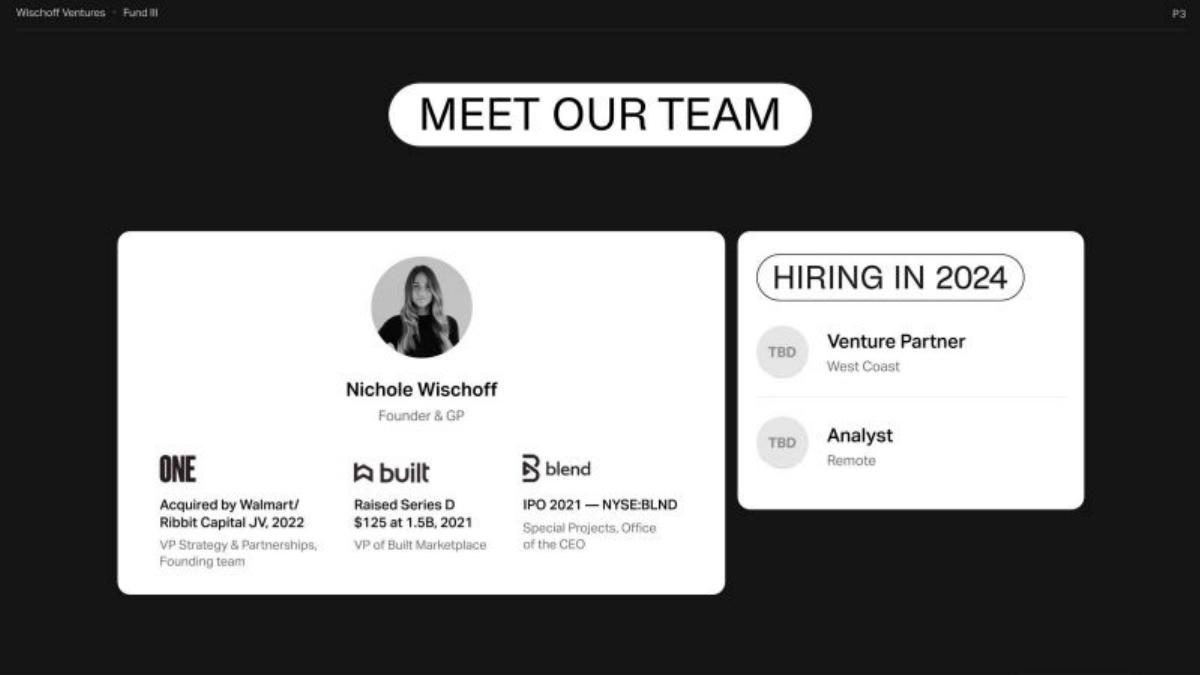
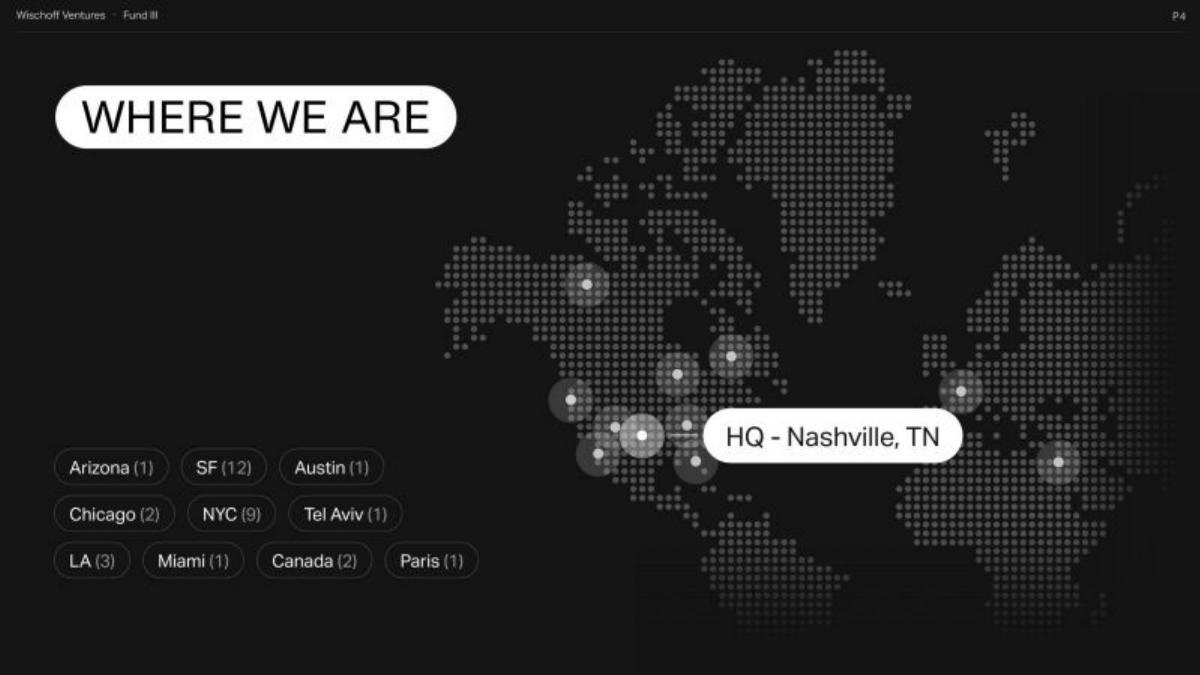
Slide 3 introduces Nichole Wischoff, the Founder and GP. The slide emphasizes her operator background at ONE (acquired by Walmart), Built ($1.5B valuation), and Blend (IPO 2021). It also signals growth by noting the firm is hiring a Venture Partner and an Analyst in 2024. Slide 4 provides a geographic breakdown of the portfolio, anchored in Nashville, TN, but with significant clusters in SF (12 companies) and NYC (9 companies), proving that while the GP is 'non-consensus' in location, she is deeply embedded in major tech hubs.
Slide 5 is the 'Social Proof' slide. It is exceptionally strong for an emerging manager, listing institutional LPs like Cendana Capital and Thrive Capital alongside individual titans like Peter Thiel, Jerry Yang, and Lee Fixel. This slide serves to de-risk the investment for new LPs by showing that the industry's most sophisticated players have already performed due diligence and committed capital.
Slides 6-9: Thesis and Founder Archetypes
Slide 6 connects the investment thesis to macroeconomics. It uses a bar chart of US GDP drivers to justify the focus on Financial Services (21.0%), Manufacturing (8.1%), and Supply Chain (6.1%). By quantifying the 'Money' sector at $3.5T and 'Manufacturing' at $2.7T, the deck argues that the fund is playing in the largest possible sandboxes. Slide 7 maps existing portfolio companies like Beam, Stell, and Coast to these specific buckets, proving the thesis is already being executed.
Slide 8 defines the 'Who.' The firm looks for Product and Engineering founders with 'huge chips on their shoulders' and a 'life's mission.' Notably, they explicitly state 'No Accelerators' and 'No quick exits,' signaling a preference for high-conviction, long-term builders over momentum-chasing startups. This slide is critical for LPs who want to know how a GP filters the thousands of deals they see annually.
Slides 10-14: The Track Record and Evolution
This section is the meat of the deck. Slide 11 compares Fund I (2021) and Fund II (2022). Fund I was a $5M vehicle with 26 investments and a 1.40x MOIC. Fund II grew to $20M with 15 investments and a 1.22x MOIC. The most important metric here is the 'Average Ownership' jump from 0.70% to 4.5%. This demonstrates that the GP has successfully transitioned from a 'scout' style participant to a meaningful 'lead' investor.
Slide 12 uses a bar chart to show 'Portfolio Momentum,' claiming over $140M in follow-on capital raised from top funds. The chart shows a clear upward trend in follow-on capital per quarter, peaking at $35M in Q2 and Q4 of 2023. Slide 13 reinforces this with a checklist of goals met, including 'Increase Ownership 4x+' and 'Earn Our Super Pro-Rata.' Slide 14 provides a granular 'Ownership Evolution' chart, visualizing the shift toward higher conviction stakes in Fund II companies (represented by the taller bars on the right side of the chart).
Slides 15-22: Sourcing and Value Add
Slide 15 (Select Investments) is a table showing entry stages and MOIC for specific companies. It highlights an 8x MOIC on a mortgage infrastructure play and a 4.33x on an ecommerce company. Crucially, it lists the 'Lead' and 'Follow-On' investors, featuring names like a16z, Founders Fund, and Accel. This shows that Wischoff Ventures is a 'kingmaker' that gets founders into the top-tier VC ecosystem.
Slide 16 is a case study on 'Checkmate,' detailing how the firm supported the company from pre-seed through a $15M Series A led by Google Ventures. Slide 18 outlines the 'Access' strategy: Brand, Network, Experience, and Community. It mentions 'Small curated dinners' and 'Monthly Portfolio Company Showcases' as the primary mechanisms for providing value. Slide 22 lists co-investors by frequency, showing 6x co-investments with Susa Ventures and 3x with Bain Capital, reinforcing the firm's status as a preferred partner for larger funds.
Slides 23-25: The Deal Flow Machine
Slide 23 provides a 'Transaction Summary' that is rare in VC decks. It shows the total deals funded in the market versus deals seen by Wischoff. In Q4 2023, they saw 68 deals out of 350 funded in the market, investing in 2. This transparency regarding 'market share' of deal flow is a strong institutional signal.
Slide 24 (mislabeled as P7 in some versions but appearing as the 24th slide) breaks down the 'Outbound' funnel. They send 50 DMs per week to PMs and Engineers, resulting in a 40% response rate. This proves that the GP is not just waiting for the phone to ring but is actively 'hunting' talent. Slide 25 concludes with 'Portfolio Construction.' For the $50M Fund III, they target 30-35 positions. 70% of the fund is allocated to 'Core' checks ($800K-$1.6M for 7-10% ownership), while 30% is 'Collaborative' ($500K checks). They also reserve 20% for follow-on investments.
What Wischoff Ventures Fund III Does Well
The deck excels at quantifying the qualitative . Most VCs talk about 'great deal flow,' but Wischoff provides a LinkedIn funnel with response rates (Slide 24). Most talk about 'moving up-market,' but Wischoff shows a bar chart of ownership percentage growing from 0.70% to 4.5% (Slide 11). This data-driven approach is exactly what institutional LPs (Endowments, Foundations, Pensions) need to see to move past the 'Solo GP' risk. Furthermore, the alignment of the thesis (Slide 6) with actual portfolio companies (Slide 7) shows a disciplined adherence to the stated strategy.
What is Missing from the Deck
While the deck is strong on sourcing and track record, it is light on the 'Exit' environment . There is no mention of realized returns or liquidity events, which is expected for a young firm (2021 vintage), but a slide discussing the M&A landscape for 'offline industries going online' would have strengthened the case for Fund III. Additionally, the deck lacks a detailed 'Operating Manual' for how the GP manages 30-35 positions solo. While 'curated dinners' are mentioned, the logistics of being a lead investor and board observer for dozens of companies is a common LP concern that could have been addressed more directly.
Founder and Manager Takeaways
Show the Evolution: If you are raising a subsequent fund, show how your strategy has matured. Wischoff’s ownership growth chart (Slide 14) is the most important slide in the deck because it proves the GP can win larger allocations. · Quantify Your Funnel: Don't just say you have a 'strong network.' Show the number of DMs sent, the response rates, and the percentage of the total market you are seeing (Slide 23, 24). · Leverage Social Proof Early: The LP list on Slide 5 is a masterclass in building a 'who's who' of backers. Even if you don't have Peter Thiel, listing your most reputable angel investors or early LPs creates a 'fear of missing out' for others. · Define Your 'No': By explicitly stating 'No Accelerators' (Slide 8), the firm defines its edge. Founders and LPs both appreciate knowing exactly what a fund is not looking for.
Frequently asked questions
- What is the specific investment thesis of Wischoff Ventures?
- Wischoff Ventures invests in early-stage, high-growth technology companies that are bringing massive offline industries online. Specifically, they target the intersection of 'money, movement, and manufacturing.' As shown on Slide 6, they map their focus to specific US GDP drivers, prioritizing sectors like financial services, supply chain, and manufacturing, which represent trillions in market value.
- How has the firm's investment strategy evolved across its three funds?
- The firm has moved from a high-volume, low-ownership 'index' style to a concentrated 'lead' style. Slide 11 shows Fund I had 26 investments with only 0.70% average ownership. By Fund II, the number of investments dropped to 15 while average ownership rose to 4.5%. Fund III continues this trend, targeting 7-10% ownership per core position (Slide 25).
- What does the deck reveal about their deal sourcing process?
- The deck is unusually specific about sourcing. Slide 24 details an outbound LinkedIn funnel targeting Product Managers and Engineers at Series C to Pre-IPO startups. They send 50 DMs per week, achieving a 40% response rate. Additionally, Slide 7 notes they receive an average of 5 warm inbound decks and 10 cold inbound decks per day via social media.
- Who are the key Limited Partners (LPs) supporting the fund?
- Wischoff Ventures has secured a mix of institutional and high-profile individual LPs. Institutional backers include Cendana Capital (Anchor), Insight Partners, and Bain Capital Ventures. High-profile individual LPs listed on Slide 5 include Peter Thiel (Founders Fund), Jerry Yang (Yahoo), Lee Fixel (Addition), and David Tisch (BoxGroup).
- What are the financial terms for Wischoff Ventures Fund III?
- According to Slide 24, Fund III has a $50M target size. The management fee is set at 2%, and carried interest is 20%. Notably, there is a performance tier mentioned: 25% carry at a 5x performance target. The fund uses Wilson Sonsini for counsel and Cornerstone for administration.